isprsarchives XL 7 W3 617 2015
Teks penuh
Gambar
Garis besar
Dokumen terkait
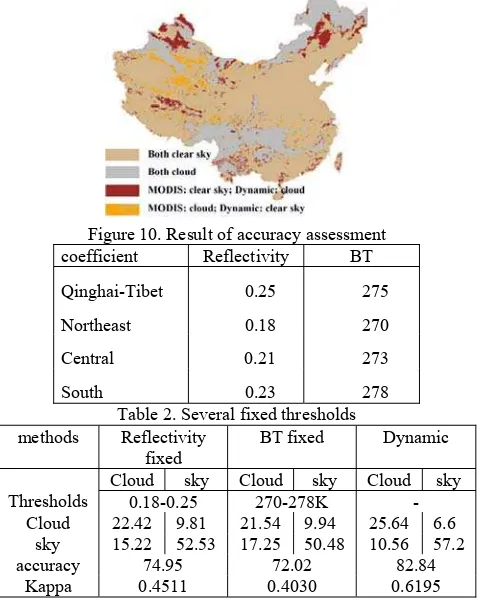
A global map of the relative height error confidence level for the final DEM tiles, derived from the quicklook mosaic of the relative height error of all the available
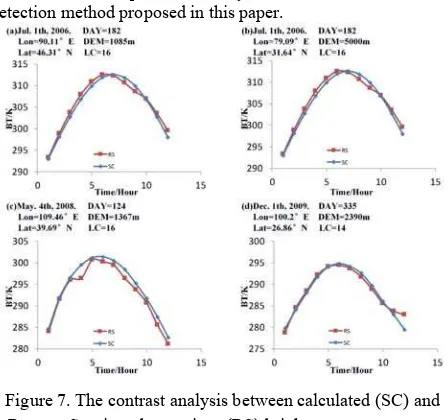
Finally, figure 6 shows the comparison between the horizontal po- sition of the tide-coordinated shoreline interpolated for the tidal height of the acquisition time of the image
Figures 5 and 6 were the results obtained after running the knowledge base classification in section 3.3 and they represent the lithology of the study area.. However
Landsat images from 1977 to 2014 and water discharge data were analysed to find out a relationship between dynamics of erosion and accretion for different time intervals with
Provided the differences seen in the yearly and daily estimates are in fact related to vegetation changes across the different years, the quality of the soil moisture retrieval
Since forests on different sites react quite differently to drought conditions, we used the process-based growth model BiomeBGC and climate time series from sites all over Germany
KEY WORDS: Land surface temperature; Ground coverage ratio; Building volume density; Urban heat island; Landsat
At canopy level, the comparison of tree crown temperature recorded by a UAV-borne infrared camera suggests a small temperature increase related to disease
