Conference paper
Teks penuh
Gambar
Garis besar
Dokumen terkait
Such as a strong relationship between wheat yield and NOAA-AVHR NDVI data over an Italian region [10] ; the establishment of a linear regression model to estimate
In this study, we analyzed the time-series Terra/ Aqua MODIS satellite hotspot products spanning from year 2001 to 2013 to unravel the inter- and intra-annual
Present study made use of several ancillary reference datasets like SRTM DEM, MODIS Water mask, DMSP-OLS nighttime lights time series data, AWiFS imagery and Google Earth©
Moreover, those areas with rice crop also have lower range of NDVI values as The International Archives of the Photogrammetry, Remote Sensing and Spatial
The study shows that increase in the gross irrigated area, fertilizer consumption, use of high yielding crop varieties and adoption of agricultural mechanization in terms of
The study also developed reliable regression model for the estimation of LAI, biomass, NPP, C & N storage in dry tropical forests by using NDVI and
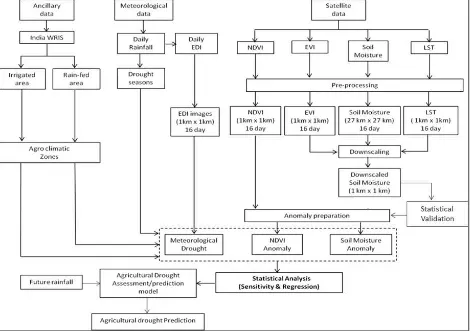
The specific objectives of the current study are; (1) to generate composite index of agricultural drought vulnerability based on exposure, sensitivity and adaptive
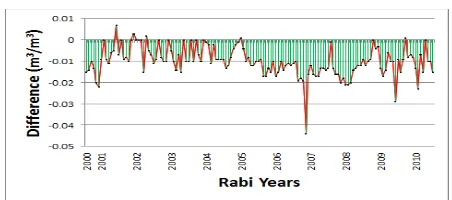
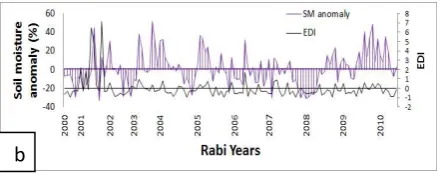
The specific objectives of this study are to 1 downscale AMSR-E soil moisture based on six MODIS indicators and TRMM precipitation using machine learning, 2 validate the downscaled soil
