THE MODEL OF WHEAT YIELD FORECAST BASED ON MODIS-NDVI
——
A CASE STUDY OF XINXIANG
Hongwei Zhanga,b, Huailiang Chena, Guanhui Zhoub
a
CMA·Henan Key Laboratory of Agro-meteorological Safeguard and Applied Technique, Zhengzhou 450003, China
– ([email protected], [email protected]) b
Xinxiang Meteorological Service, Henan, Xinxiang 453000, China – (xxqxjzhw1966, xxqxjzgh)@163.com
Commission VII/1
KEY WORDS: Normalized Difference Vegetation Index, Above Ground Biomass, Harvest Index, Model
ABSTRACT:
The yield estimation models on a regional scale are generally constrained by the lack of spatially distributed information on major environmental. The utilization of remote sensing data with various spatial and temporal resolutions can settle this problem. The NDVI, which retrieved from satellite remote sensing, was adopted to forecast winter wheat yields in this paper. There are two key steps in the process of calculating. The first is the establishment of the relationship between NDVI and Above Ground Biomass (AGB). The second is the Harvest Index(HI) calculating based on the change of NDVI from the period of re-greening to maturity. The validation results showed that forecast accuracy is satisfied and can be applied in practice of winter wheat yield forecasting. However, the error will be increased in abnormal weather condition, for higher or lower value of NDVI is made than normal situation, (such as re-greening too early, overgrowth, and late-maturing, etc.). So the model amendment is required according to the status of crop and weather condition in the year.
This work is supported by the project of “Special Scientific Research (Meteorology) for Public Welfare” (GYHY200906022) & fund of CMA·Henan Key Laboratory of Agro-meteorological Safeguard and Applied Technique (AMF 201105)
1. INTRODUCTION
Accurate and real-time estimation of crop yield on regional, national and international scales is becoming increasingly important in both developing and developed countries. In particular, crop yield estimation may play a fundamental role in supporting policy formulation and decision-making in agriculture, even affecting a country’s security and stability. Among the possible approaches that integration of crop simulation model and satellite data seems to be one of the most appropriate quantitative analysis methodologies in future. Crop simulation simple models have used after the World War II[1]. In the subsequent decades the complicated models have been used more and more and potentially more useful[2]. Sinclair and Seligman suggested that some simple models have been shown better performance when the research objective was highly specific or related to a single factors[3], such as water or temperature[4]. Meanwhile, the weakness of these approaches are incapable of accounting for the direct impact of temperature and water stresses on plant growth and are also often limited for the lack of data from which they were developed.
On the other hand, more complex models, such as CERES[5], WOFOST[6], CROPSYST[7] simulate the crop growth on a daily basis throughout the biological cycle. These models try to integrate multiple factors that affect crop growth, such as plant available soil water, temperature, etc. The advantage of these models as a tool in research lie in their unique ability in simulating the soil–environment–plant interactions, but the model utilization was restricted for a number of physiological and pedological parameters is required that are not easily acquired.
For yield assessment must be carried out on regional scale, the limitations have been shown in both simple and more complex models. To overcome these problems, the remote sensing is
proposed as a most useful method, for remote sensed data are in fact used as source of information for “real-time” model driving, it can providing spatial-tempo distributed information map with different resolution, and is frequently required when parameters simulating in crop yield forecasting[8].
Traditional crop yield estimation methods based on remote sensing data use the statistic and semi- empirical relationships between Above Ground Biomass(AGB) and vegetation index, which are combinations of different bands. The most popular nowadays is NDVI, which can be derived from various satellite data[9]. Such as a strong relationship between wheat yield and NOAA-AVHR NDVI data over an Italian region[10]; the establishment of a linear regression model to estimate corn and wheat yield at a regional scale based on vegetation indices computed with Landsat MSS data[11]; the potential of using multi-year NOAA-AVHRR NDVI data to estimate wheat yield in North African countries[12] , etc.
There are a lot of research achievement in crop yield estimation and vegetation. Such as, NDVI & RVI were applied in the relationship research of LAI & AGB, the regression analysis showed that the performance of NDVI is better than RVI, and the power-function model best reflect the relation between NDVI(R950,R650) & LAI. For the retrieval of AGB, RVI performance is better than NDVI[13]. A harvest index (HI) was proposed and applied in the simulating of HI dynamic change in various weather conditions, and also applied in wheat yield estimation couple with NPP model[14]. The mechanic of HI had been analyzed, and applied it in wheat yield forecasting, the probability was discussed of take the advantage of remote sensing to estimate HI[15]. The relationship between Biomass, Harvest Index and Grain yield have been studied, and the relationship of HI and Grain yield is found to be significant[16]. The similar occasions were also found in different crops in other regions. These methods are simple and practical, but the ISPRS Annals of the Photogrammetry, Remote Sensing and Spatial Information Sciences, Volume I-7, 2012
XXII ISPRS Congress, 25 August – 01 September 2012, Melbourne, Australia
limitation is that the parameters in one region can’t be promoted in other regions.
The integration of remote sensing data with crop simulation models has been making yield estimation methods more robust and easily exportable. For the crop simulation models describe the physiological and biological mechanisms which control crop growth (Moulin et al., 1998) [17]. Some methods to integrate the spectrum observations with a crop model were described by Maas (1988) [18], Delecolle et al. (1992) [19] and Moulin et al. (1998) [20], whose main study included: (i) the direct use of driving variables retrieval from remote sensing data; (ii) the parameters updating within the model; (iii) the model re-initialization; (iiii) the model re-calibration. These four ways, however, show strong restrictions when applied on a regional scale. In particular, the direct use of a driving variable is generally difficult because the temporal resolution of remote sensing data does not match the crop models requirement. The availability of crop canopy characteristics is the key factor in the application of the other methods in regional scale yield forecasting.
The objective of this paper is to develop a practical method of crop yield estimation can be promoted in regional scale. This methodology is based on the relationship between the AGB & NDVI which retrieval from remote sensing data. In this stage, the data in situ observation should be compared with the data retrieved from remote sensing. Xinxiang is selected as the tested area of accuracy validation for its high wheat quantity and quality food production.
2. DATA AND METHODS
In the period of wheat re-greening to maturity in 2008-2010a, the measurement of LAI & AGB were conducted, the sampling interval is 10 days. The measure site is located in the annual crop observation area. There are 4 sampling spots in each observation, and 10 strains in each spot, 40 strains in total. The ways of measurement of LAI & AGB strictly followed the agricultural meteorological observation criterion. The data of integrate NDVI (10 days) was download via the website of http://free.vgt.vito.be/. The style of data is HDF, named V1KRNS10__yyyymmdd_NDVI__SE-Asia. The spectrum data of NDVI from Mar. to May is retrieved with ENVI4.7.
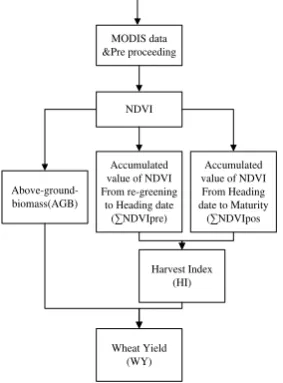
MODIS data &Pre proceeding
NDVI
Above-ground-biomass(AGB)
Harvest Index (HI)
Wheat Yield (WY) Accumulated value of NDVI From re-greening
to Heading date (∑NDVIpre)
Accumulated value of NDVI From Heading date to Maturity (∑NDVIpos
Figure 1. Flow chart of wheat yield estimation
3. RESULTS ANALYSIS
3.1 Estimation of Above Ground Biomass(AGB)
The NDVI was retrieved in test area with ENVI4.7, and the relationshhip of Above Ground Biomass with NDVI was found. As we know, the winter wheat growth rate is faster and faster after the stage of re-greening, so both of the AGB and NDVI showing faster growth rate before the stage of Heading-date. After then, the NDVI is decreased gradually, but the Biomass is continue increased, and the linear relationship between AGB & NDVI is not significant. So, The method of accumulation of NDVI data has been adoped in research, and the relationship is significant between AGB & NDVI. The formula is established as below:
429 . 26 116 . 91 618 .
58 2
x x
Y (1)
There, Y is Above Ground Biomass(AGB), x is
∑
NDVI.Figure 2. the sketch of relationship between AGB & ∑NDVI
3.2 Estimation of Harvest Index(HI)
The estimation of Above Ground Biomass(AGB) during the growing season is insufficient for crop yield forecasting, it is just a dry mass to wheat, only the harvest index(HI) can explained the transporation efficiency during the grain filling stage[21],[22],[23]. There are many factors affecting HI that influence the crop yield at the end. Among them, water and temperature may be the key limiting factors in the period of re-greenging to maturity[24]. The much more limite factors to the efficiency of stored assimilate translocation to kernels is stress plant[25]. So the water status in the period of grain filling is much more important for yield forecasting. It is pity that the crop sumulation models can’t estimating these parameters accurate when applied to the region scale[26].
With the developing of remote sensing, the imformation above mentioned can be obtained by the retrieval of monitoring data, especially the NDVI is widely used in the arid and semi-arid areas which used as an indicator of vegetation water status. When the water stress happened, it is often leads to leaf yellowing and wilting, and the NDVI decreased accordingly. The integrates effect of water stress over a periods are different for the variety of environments and vegetation cover. The results has been confirmed by the studies performed in different regions[27],[28],[29],[30] and on a global scale[31]. The crop yield is mostly correlated to the NDVI values just prior to harvest, but in the period of grain filling, the FAPAR’s contribution to the biomass is little. on the contrary, the water stress could explained the NDVI change and yield reductions in last[32]. Considering the aboved informations, the NDVI in the period of grain filling is recognized as one parameters which related to the yield formation, the Above Ground Biomass(AGB) was simulated by the available NDVI values, and final Harvest Index(HI) can be calculated from the NDVI. The negative environmental effects on the efficiency of nutrient transfer (e.g. water stress and temperature stress) was considered to affect the ISPRS Annals of the Photogrammetry, Remote Sensing and Spatial Information Sciences, Volume I-7, 2012
XXII ISPRS Congress, 25 August – 01 September 2012, Melbourne, Australia
optimal Harvest Index(HIMAX). The final Harvest Index(HI) was expressed as below:
e Post RANGE
MAX NDVI
NDVI NDVI HI
HI HI
Pr
1 2
Where, HINDVI is the actual final Harvest Index(HI), HIMAX is the optimal HI (the default value is 0.48), HIRANGE the change interval of HI (here choose as 0.18), ∑NDVIPost is the accumulated NDVI value from the stage of heading-date to maturity, and ∑NDVIPre is the accumulated NDVI value from the stage of re-greening to heading-date.
In this paper, the NDVI in points is the base of Harvest Index(HI) calculating. For the different heading-date from 2008-2010a, the Harvest Index(HI) was estimated(see Table 1).
Annual 2008 2009 2010
HINDVI 0.4418 0.3000 0.3927
Table 1. The Harvest Index(HI) of wheat in 2008-2010a
3.3 Final estimation of wheat yield
Using the computed AGB and HINDVI above, final Wheat Yield (WY) was calculated as:
NDVI HI AGB
WY 3
4. CASES STUDIES AND VALIDATION
4.1 The analysis of AGB retrieval effect
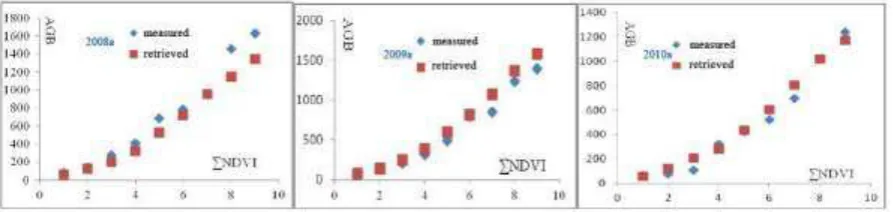
On the base of NDVI retrieved from remote sensing data, and take the advantage of relationship between AGB & ∑NDVI, the Above Ground Biomass(AGB) was calculated.(see Table 2, Fig.3)
Time
*F- 10days/
Mar.
**M- 10days/
Mar.
***L- 10days/
Mar.
F- 10days/
Apr.
M- 10days/
Apr.
L- 10days/
Apr.
F- 10days/
May
M- 10days/
May
L- 10days/
May
2008 Measured 81.6 140.6 279.8 412.4 687.6 785.0 950.0 1459.7 1628.2 Retrieved 59.3 129.0 199.7 327.8 529.9 718.3 960.8 1152.7 1346.4
2009 Measured 82.5 126.6 207.9 312.5 491.0 798.4 852.0 1234.0 1397.9 Retrieved 70.6 138.3 241.6 385.1 596.0 815.2 1072.3 1364.2 1581.3
2010 Measured 68.0 76.2 107.7 320.0 423.3 520.5 694.9 1015.0 1240.7 Retrieved 56.3 120.0 210.3 283.1 436.8 601.9 808.3 1015.8 1173.3
Table 2. The comparison of AGB in situ observation and retrieved from remote sensing in 2008-2010a
(*F-10days is the First 10 days of month, **M-10days is the Middle 10 days of month, ***L-10days is the Last 10 days of month)
Figure 3. The sketch of AGB in situ observation and retrieved from remote sensing in 2008-2010a
From the results of comparison between AGB in situ observation & retrieved from remote sensing, the difference is found being existed. But the accuracy is satisfied for crop dynamic monitoring, so the AGB retrieved from NDVI shows a potential capacity in practice.
4.2 The analysis of Wheat Yield(WY) estimating
With the utilization of remote sensing data in 2008-2010a, the wheat yield(WY) was calculated, and is compared with the actual wheat yield (see table 3) .
The results showed that accuracy of wheat yield estimating model, based on NDVI, is satisfied, and can be promote in actual practice.
At the same time, the little higher difference was found in 2009. The analysis of the meteorological data in 2009 can explain this
Annual 2008 2009 2010
Actual Wheat Yield(kg/ha) 607.0 523.0 479.4 Estimating results(kg/ha) 594.9 474.4 460.8 Difference (%) -2.0 -9.3 -3.9
Table 3. The results of wheat yield estimating in 2008-2010a
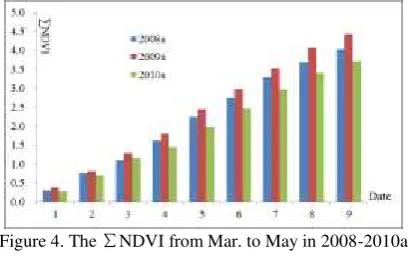
phenomenon. The temperature in Feb. 2009 is higher than normal years; especially in the middle 10-days of Feb. the average temperature was double higher than normal years. The wheat re-greening date was much earlier, and NDVI value was too higher. The retrieval results showed that the value of
∑NDVI from re-greening to maturity in 2009 is 0.4 larger than 2008a, and 0.7 larger than 2010a. The larger ∑NDVI value lead to the AGB retrieved value was slightly larger accordingly. At ISPRS Annals of the Photogrammetry, Remote Sensing and Spatial Information Sciences, Volume I-7, 2012
XXII ISPRS Congress, 25 August – 01 September 2012, Melbourne, Australia
the same time, the larger ∑NDVI, after the heading-date, made the HI value was much lower than usual. So the difference is larger in final yield estimating with the influence of weather condition(See Figure 4).
Figure 4. The ∑NDVI from Mar. to May in 2008-2010a
5. CONCLUSION AND DISCUSSION
The research was conducted based on the remote sensing data which integrates the all major environmental factors. In other words, remote sensing data, with available spatial and temporal resolutions, can directly estimate the actual affection. The NDVI, which being related to crop production processes directly, are one of the best driving factors in crop simulation. The most important in research is the accuracy of AGB & HI retrieved from NDVI. For the model established is based on the data of point in situ observations, the estimating error should be existed when apply to regional scale. The AGB retrieved results would not so accurate when the observation site representation is not so good, especially in the areas with various soil textures. Under the normal weather condition, the crop yield estimating result, by the way of AGB & HI estimating from remote sensing, is satisfied. Unfortunately, NDVI value would be too larger than usual when wheat re-greening date too earlier or over grown happened, it will lead to the difference rise in final yield estimating.
In order to improve retrieved precision, it is needed to increase the observe site for model validation, and the model amendment is required according to the status of crop in the year.
6. REFERENCES
[1] Sinclair, T.R., Seligman, N.G., 1996. Crop modeling: from infancy to maturity. Agron. J. 88, 698–704.
[2] Bolle, H.J., Eckardt, M.,Koslowsky, D., Maselli, F.,Melia-Miralles, J., Menenti, M., Olesen, F.S., Petkov, L., Rasool, S.I., Van de Griend, A. (Eds.), 2006.
[3] Sinclair, T.R., Seligman, N.G., 1996. Crop modeling: from infancy to maturity. Agron. J. 88, 698–704.
[4] Asare, D.K., Sammis, T.W., Assadian, H., Fowler, J.F., 1992. Evaluating three cotton simulation models under irrigation regimes. Agric. Water Manage. 22, 391–407.
[5] Jones, C., Kiniry, J., 1986. Ceres-N Maize: a simulation model of maize growth and development. Texas A&M University Press, College Station, Temple, TX.
[6] Supit, L., Hooijer, A.A., Van Diepen, C.A., 1994. System Description of the WOFOST 6.0 Crop Simulation Model Implemented in CGMS, vol.1. JRC European Commission. [7] Stockle, C.O., Donatelli, M., Nelson, R., 2003. CROPSYST, a
cropping systems simulation model. Eur. J. Agron. 18, 289–307. [8] Clevers, J.G.P.W., Vonder, O.W., Jongschaap, R.E.E., Desprats, J.,
King, C., Pr´evot, L., Ruguier, N., 2002. Using SPOT data for calibrating a wheat growth model under mediterranean conditions. Agronomie 22, 687–694.
[9] Baret, F., Guyot, G., 1991. Potentials and limits of vegetation indices for LAI and APAR assessment. Remote Sens. Environ. 46, 213–222. [10] Rossini, P., Benedetti, R., 1993. On the use of NDVI profiles as a
tool for agricultural statistics: the case study of wheat yield estimate
and forecast in Emilia Romagna. Remote Sens. Environ. 45, 311– 326.
[11] Hamar, D., Ferencz, C., Lichtenberg, J., Tarcsai, G., Frencz-Arkos, I., 1996. Yield estimation for corn and wheat in the Hungarian Great Plain using Landsat MSS data. Int. J. Remote Sens. 17, 1689–1699. [12] Maselli, F., Rembold, F., 2001. Analysis of GAC NDVI data for
cropland identification and yield forecasting in Mediterranean African countries. Photogramm. Eng. Remote Sens. 67, 593–602. [13] Qiaoli Zheng, Guo-qing, Shaofen Duan, et al., 2008, Estimation of
ZHAO LAI and Aboveground Dry Biomass in Maize Based on Canopy Spectral Reflectance. Acta Agriculturae Boreali-Sinica. 23(1), 219-222.
[14] Xingjie Ji, Yongqiang Yu, Wen Zhang, et al., 2010. The Harvest Index Model of Winter Wheat in China Based on Meteorological Data. Scientia Agricultura Sinica. 43(20), 4158-4168.
[15] DU Xin, Bingfang Wu, Jihua Meng, et al., 2010. Feasibility Analysis for Acquiring Crop Harvest Index (HI) with Remote Sensing. Chinese Journal of Agrometeorology. 31(3), 453-457.
[16] Zhaoye Liu, Jingchuan Yu, Jiukai Yang., 2006. Study on the Relationship between Biological Yield, Harvest Index and Economic Yield in Wheat [J]. Chinese Agricultural Science Bulletin. 22(2), 182-184.
[17] Moulin, S., Bondeau, A., Dele’colle, R., 1998. Combining agricultural crop models and satellite observations from field to regional scales. Int. J. Remote Sens. 19, 1021–1036.
[18] Maas, S.J., 1988. Use of remotely-sensed information in agricultural crop growth models. Ecol. Model. 41, 247–268.
[19] Delecolle, R., Maas, S.J., Guerif, M., Baret, F., 1992. Remote sensing and crop production models: present trends. ISPRS J. Photogramm. Remote Sens. 47, 145–161.
[20] Moulin, S., Bondeau, A., Dele’colle, R., 1998. Combining agricultural crop models and satellite observations from field to regional scales. Int. J. Remote Sens. 19, 1021–1036.
[21] Kobata, T., Palta, J.A., Turner, N.C., 1992. Rate of development of post-anthesis water deficits and grain filling of spring wheat. Crop Sci. 32, 1238–1242.
[22] Nicholas, N.E., Turner, N.C., 1992. Use of chemical desiccants and senescing agents to select wheat lines maintaining stable grain size during post-anthesis drought. Field Crops Res. 31, 155–171. [23] Plaut, Z., Butow, B.J., Blumenthal, C.S., Wrigley, C.W., 2004.
Transport of dry matter into developing wheat kernels and its contribution to grain yield under post-anthesis water deficit and elevated temperature. Field Crops Res. 86, 185–198.
[24] Araus, J.L., Villegas, D., Aparicio, N., Garc`ıa del Moral, L.F., El Hani, S., Rharrabti,Y., Ferrio, J.P., Royo, C., 2003. Environmental factors determining carbon isotope discrimination and yield in durum wheat under Mediterranean Conditions. Crop Sci. 43, 170–180. [25] Plaut, Z., Butow, B.J., Blumenthal, C.S., Wrigley, C.W., 2004.
Transport of dry matter into developing wheat kernels and its contribution to grain yield under post-anthesis water deficit and elevated temperature. Field Crops Res. 86, 185–198.
[26] Clevers, J.G.P.W., Vonder, O.W., Jongschaap, R.E.E., Desprats, J., King, C., Pr´evot, L., Ruguier, N., 2002. Using SPOT data for calibrating a wheat growth model under mediterranean conditions. Agronomie 22, 687–694.
[27] Kogan, F.N., 1990. Remote sensing of weather impacts on vegetation in nonhomogeneous areas. Int. J. Remote Sens. 11, 1405–1419. [28] Davenport, M.L., Nicholson, S.E., 1993. On the relation between
rainfall and the normalized difference vegetation index for diverse vegetation types in East Africa. Int. J. Remote Sens. 14, 2369–2389. [29] Walsh, S.J., 1987. Comparison of NOAA-AVHRR data to
meteorologic drought indices. Photogramm. Eng. Rem. Sens. 53, 1069–1074.
[30] Cannizzaro, G., Maselli, F., Caroti, L., Bottai, L., 2002. Use of NOAA-AVHRR NDVI data for climatic characterization of Mediterranean areas. In: Geeson, N.A., Brandt, G.J., Thornes, J.B. (Eds.), Mediterranean Desertification: A Mosaic of Processes and Responses. JonhWiley and Sons Ltd., The Atrium, Southern Gate, Chichester, West Sussex PO19 8SQ, England, pp. 47–54.
[31] Ichii, L., Kawabata, A., Yamaguchi, Y., 2002. Global correlation analysis for NDVI and climatic variables and NDVI trends: 1982– 1990. Int. J. Remote Sens. 23, 3873–3878.
[32] Maselli, F., Rembold, F., 2001. Analysis of GAC NDVI data for cropland identification and yield forecasting in Mediterranean African countries. Photogramm. Eng. Remote Sens. 67, 593–602. ISPRS Annals of the Photogrammetry, Remote Sensing and Spatial Information Sciences, Volume I-7, 2012
XXII ISPRS Congress, 25 August – 01 September 2012, Melbourne, Australia