A. Description of the Data 1. The result of Pre-Test score of the Experiment and Control Class - Chapter IV (MD)
Teks penuh
Gambar
Dokumen terkait
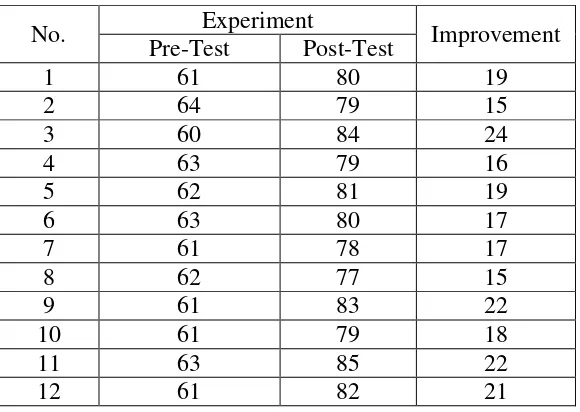
The research focused on the experiment to know whether there was significance effect of applying pre- questioning technique to improve students’ reading
Because Fvalue(22.781) was higher than Ftable (4.54), it could be interpreted that the alternative hypothesis stating that teaching writing used peer correction and
Therefore teaching using authentic material as media gave significant effect on English vocabulary mastery of the eighth grade students MTs Darul Amin palangka
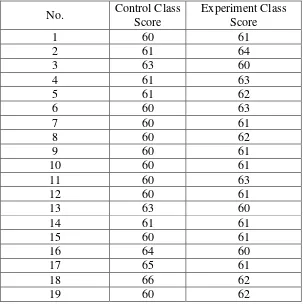
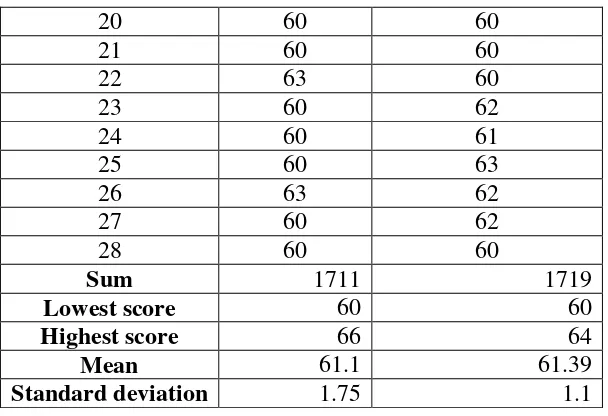
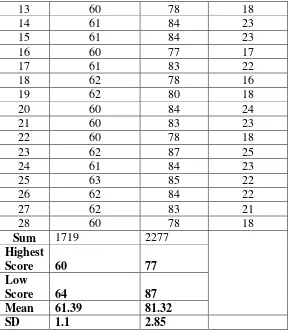
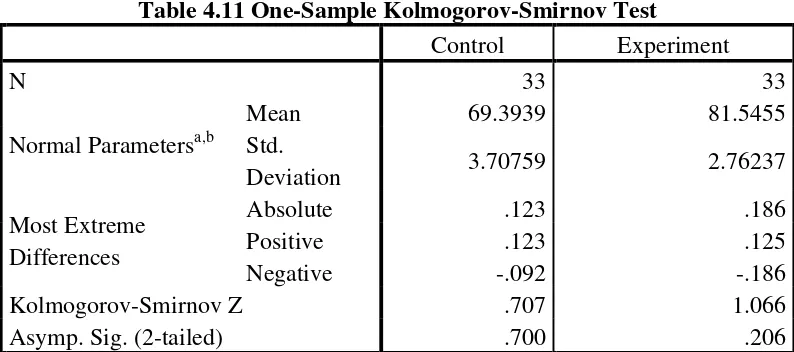
To determine the frequency of score, percent of score, valid percent and cumulative percent calculated using SPSS 16 (see appendix 7). The distribution of students’ pre
It can be seen from the figure above, the students’ pre -test score in control class. There were two students who got score 62. There were five students who got score 65.
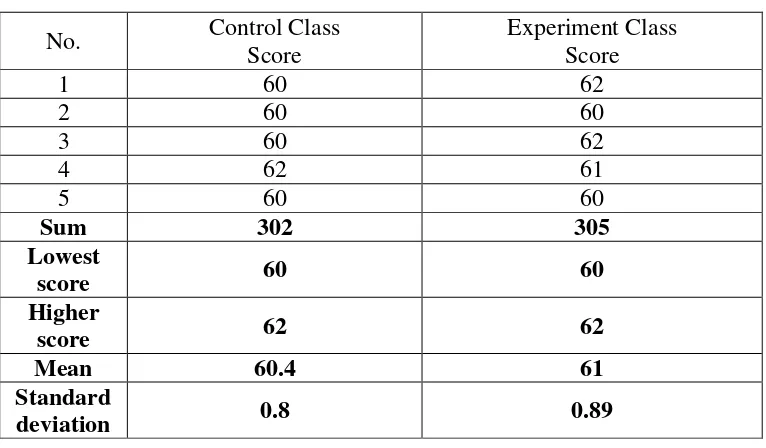
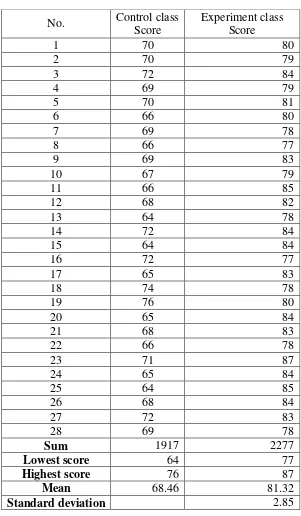
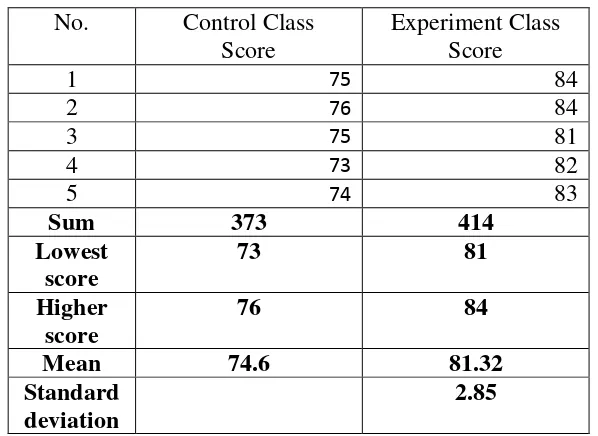
The Table for Calculating mean, Standard deviation, and standard error of Pretest Score...
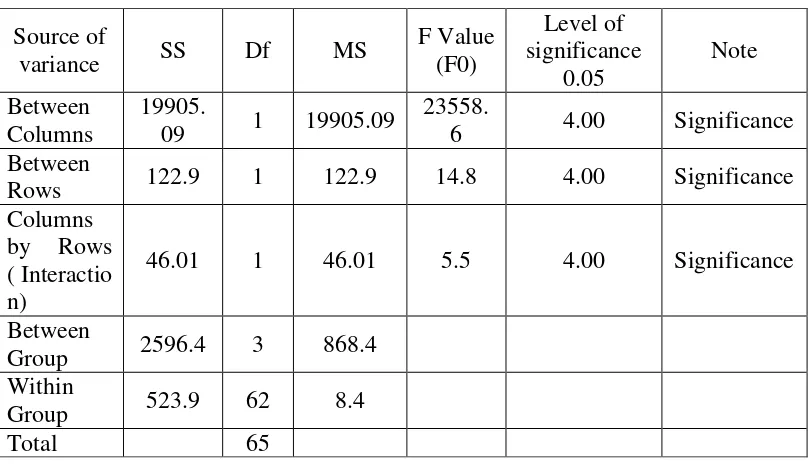
From the table above, the results show that there is significance difference between the mean scores of experimental and control class and it is noticed that the training addressed to
The difference ability of students in writing an expository paragraph which were taught by using Learning Logs Strategy and which were taught without Learning Logs Strategy Based
