Conference paper
Teks penuh
Gambar
Dokumen terkait
From the experiment results, we concluded that the correction method the Type B-3, which is the method based on the assumption that the magnitude of chromatic aberrations can be
The correction matrix (figure 5) for the camera was determined on the basis of images of the integrating sphere (FFC_UK).. The images of the LED backlight were corrected us- ing
Since the self-localization of the mobile device is based on GPS, gyro sensor, acceleration meter and magnetic field sensor (called as position and orientation system (POS) in
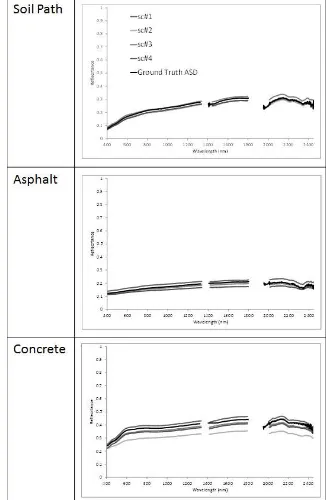
After the SE correction the resulting DN values are transformed to reflectance values to ease further analysis. Additionally, the environmental conditions may change
The dust storm detecting and tracking component combines three earth scientific models, which are Santa Barbara DISORT Atmospheric Radiative Transfer (SBDART) model
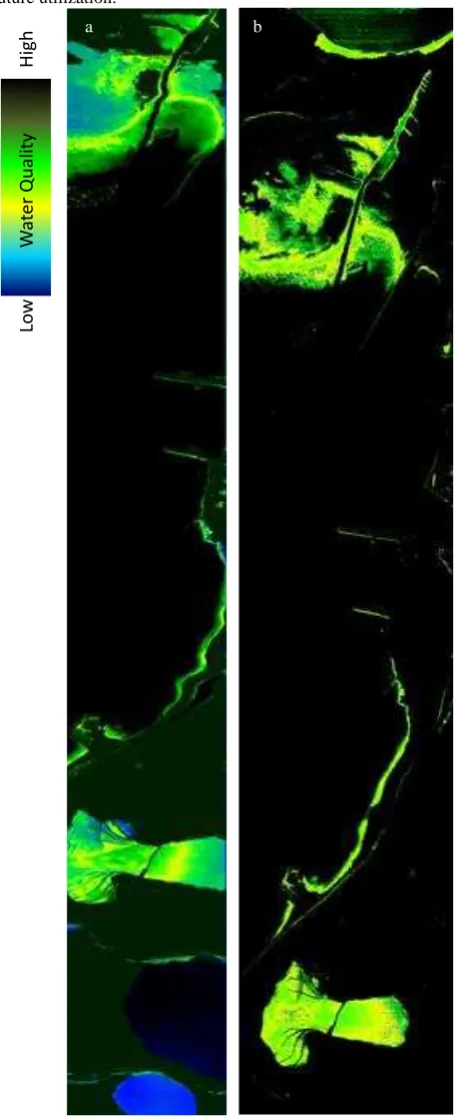
The present paper discuss the application of MCC technique applied on sequential suspended sediment concentration (SSC) maps obtained from Ocean Colour Monitor (OCM)
The superimposition of geo-referenced plot maps on the present (2014) river course helped to identify the plots occupying island area and water area. The following Figure 7 shows
The tropospheric phase delay component has been estimated using tropospheric models in conjunction with surface temperature and pressure data from MODIS
