A STUDY OF FOOD ACCESS, FOOD
HYGIENE, ENVIRONMENTAL
SANITATION, AND COPING
Ari Istiany
Eko Siswono
Winati Wigna
Dadang Sukandar
Katrin Roosita
A STUDY OF FOOD ACCESS, FOOD
HYGIENE, ENVIRONMENTAL
SANITATION, AND COPING
Ari Istiany Eko Siswono Winati Wigna Dadang Sukandar Katrin Roosita
Copyright © 2013 Ari Istiany, Eko Siswono, Winati Wigna, Dadang Sukandar and Katrin Roosita
Editor : Yuki HE Frandy
Layout design : Noval Tensai Cover design : Sani Etyarsah
Published by PT Penerbit IPB Press Kampus IPB Taman Kencana Bogor
First edition : September 2013 National Library of Indonesia : Cataloging in Publication
Prohibited to quote or reproduce in whole or in part the contents of this book without permission of PT Penerbit IPB Press
SUMMARY
In Jakarta many slum areas were found. Approximately 200,000 people live on only 20 hectares of land inhabited by about 150,000 homes that are diicult to control. It is therefore natural for the people to be haunted by a sense of fear, among others, the existence of infectious diseases such as diarrhea and malnutrition caused by poor eating habit in the household. Some indicators that can be used to determine whether an area is classiied as a slum or not are by looking at: the density level of the area, ownership of land and buildings as well as the quality of existing facilities and infrastructure in the region.
he objectives of the study were: (1) analyzing the socio-economic characteristics of the households including age, sex, family size, education, employment, income and home ownership; (2) analyzing the children’s school enrollment and working children; (3) analyzing the knowledge, attitude and behavior of the housewives about nutrition and health; (4) analyzing household eating habits use the food frequency; (5) analyzing safety of food consumed by the households; (6) analyzing the nutritional status of infants, toddlers and pregnant women by anthropometric measurements; (7) analyzing the morbidity of the whole family (father, mother and child) as diarrhea, Acute Respiratory Infections (ARI), and skin diseases; (8) analyzing healthy-life behavior including the use of clean water, rubbish disposal, and sewage and; (9) analyzing the coping mechanisms to support the household food suiciency.
Sampling was applied in this research where the slum areas (slum areas along the rail way and along the riverbank) stand as stratum and households stand as sampling unit, the total sample size was n=300.
Data to be collected consist of primary and secondary data. he primary data include: (1) data on social aspects (formal education, occupation, household ownership, asset); (2) data on income and expenditure; (3) data on food consumption (food frequency, food habits, and food recall); (4) hygiene, food safety and environmental sanitation; (5) healthy life styles; (6) anthropometric data; (7) morbidity; (8) knowledge, attitude, practice of nutrition and; (9) coping mechanism for food insecurity. he secondary data are the information related to population, sanitation, rubbish disposal, water sources in the slum area. he data was collected by enumerators. hey are student in their eighth semester and graduates in the related ields. Some datawere collected by a recalling technique, which could be a weakness of this study because the respondents’ remembering ability may be very limited to recall all things. However, this method is the most practically-administered one in an on-ield survey.
he data were checked irst for editing before the entry. he ile structure was arranged by using Microsoft excel. Elementary statistics such as mean, standard deviation, minimum, maximum and proportion were estimated or calculated. Some conclusions were as follows: 1. Family characteristics at riverbank and railway side were relatively
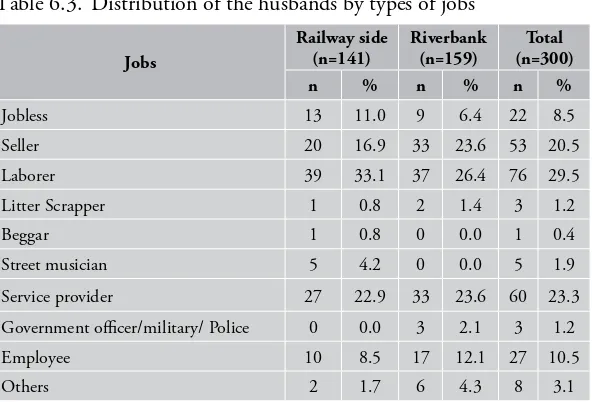
similar. Wives and husbands were in their productive age and had low education level. Most husbands worked as labor, merchant and service provider. Most wives didn’t work, although some worked to help their husbands by trading. Based on number of family members, most families in the slum area were middle size and big families with family members more than four.
2. Most of house ownership status were personal owned with narrow house condition. Average house loor width at the railway side was 30.8 m2 and at the riverbank was 33.4 m2. Railway side had higher
vii
SUMMARY
two main rooms, bedroom and kitchen with inadequate condition because children and parents sleep together and some house didn’t have window.
3. Based on average income level, respondents were in non-poor category because the income was above the poverty line of DKI Jakarta province (IDR 355 480/capita/month) and World Bank (IDR 540 000/capita/month). Expenditure percentage were balanced between food and non-food expenses. he highest food expenses were for side dishes, rice and snacks. While the highest non-food expenses were for transportation, house rent, debt repayments, water bill, phone credit , recreation and saving/money gathering.
4. School children (7-15 years old) who were not schooling anymore were more in railway side (22.6%) than riverbank (2.7 %). Children aged 16-18 years who were not schooling anymore were even higher (>50%) in both slum areas.
5. Households at railway side and riverbank had relatively adequate nutrition knowledge and practice. Whilst, good nutrition attitude were commonly found among wives who lived at riverbank than railway side.
6. Rice was the main staple food and consumed most frequently, other staple food oftenly consumed was noodle. Expensive protein source food like beef, chicken or fresh ish were rarely consumed. Nuts and lentils most frequently consumed were tempeh and tofu, which were consumed almost everyday. Average frequency of fruit consumption was less than once a week. Frequency of snacks consumption at both slum areas was relatively high, and fried snacks were the most frequent.
8. Analysis of clean water in both slum areas showed it wasn’t safe. Although analysis of water from the well at railway side and riverbank showed that it was physically and chemically safe, microbiology analysis showed that the water was not safe for consumption. Analysis of snacks showed rhodamine B was found in 1 out of 6 samples of crackers usually consumed by the community in the slum area. Meanwhile, heavy metal analysis of several vegetables showed they were not safe for consumption. 9. Communities living in this slum area were facing double burden
nutritional problem. he prevalence of underweight, wasting and stunting among underive children were 25.6%, 28.9% and 28.2%, respectively whereas the prevalence of obese underive children was also high (18.8%). Overnutrition problem not only happened in underive children, but also in wives as their average BMI were in the obese category. Nonetheless, all pregnant and lactating respondents had good nutritional status as their MUAC percentile was >85%.
10. Slum areas had high morbidity rate. Most common disease sufered by respondents’ family members in the last two weeks was ARI such as cough and inluenza, while diarrhea and skin disease were rare. Physical access to get treatment was not an issue because there were a lot of health care spread evenly in the area. Community health center was the most visited health care. 11. Less than a half respondent families were members of health fund
ix
SUMMARY
12. Personal hygiene was good, consisted of several habits such as brushing teeth, washing hands, utilizing clean water, availability of bathroom and toilet. Nevertheless, there was still some people who didn’t practice good hygiene like throwing trash to the Ciliwung river.
13. Stress underwent frequently by both slum areas was chronic stress. Economic factors as the main cause of household stress in both slum areas were unmet needs to sustain family expenses and unsatisied with the family income. Planful problem solving was used as coping strategy to solve the problem. Coping strategies done to fulill family needs/expenxes were wives also worked, looking for extra work and borrowing money from family or non family especially to purchase basic needs. Trade/pawn gold, electronic and non-electronic stuf were only done by a few respondents. Coping strategies related to food expenses were varied starting from reducing amount of side dishes and staple food bought, reducing children snacks, reducing tea/cofee/sugar consumption, reducing meal frequency, bringing food to the workplace and leaving food for the day after.
From the above indings, the researchers recommended:
1. Bad environment sanitation problem in the slum area is diicult to be solved because of residence density. Slum area arrangement needs to be done by local government by reallocating residence, such as providing inexpensive lats which is afordable by the community.
2. High drop out rate among 16-18 years old children usually related to education cost. herefore, scholarship and free education which were the featured education program in Jakarta must be supervised continously so implementation at community level will run smoothly.
3. Nutritional problems that still dominant in slum areas need to be anticipated by optimizing nutritional and health service program especially through Integrated Service Post (posyandu). If service in Integrated Service Post improve, mother and child participation will increase and this will improve children nutritional status. 4. In terms of food safety, supervision to the food seller is necessary
ACKNOWLEDGEMENT
LIST OF CONTENT
Page
SUMMARY ...v
ACKNOWLEDGEMENT ...xi
LIST OF CONTENT ...xiii
LIST OF TABLES ...xvii
LIST OF FIGURES ... xxi
LIST OF APPENDICES ...xxiii
1. INTRODUCTION ...1
1.1. Background ...1
1.2. Goals and Objectives ...6
2. LITERATURE REVIEW ...9
2.1. Characteristics of Slum Areas ...9
2.2. School Participation ...11
2.3. Food Consumption ...13
2.4. Nutritional Knowledge ...14
2.5. Food Safety ...15
2.6. Nutritional Status ...16
2.7. Morbidity ...18
2.8. Clean and Healthy Life Behavior ...19
2.9. Coping ...21
4. METHOD ...29
4.1. Research Design, Location and Time ...29
4.2. Sampling ...30
4.3. Data Collection ...32
4.4. Data Analysis and Management ...35
4.5. Research Limitations ...35
4.6. Relevance of Research ...36
5. SOCIAL MAPS OF THE RESEARCH AREAS ...39
5.1. Research Areas ...39
5.2. Life of the Slum People ...41
6. SOCIO-DEMOGRAPHY AND
FAMILY ECONOMY ...43
6.1. Characteristics of Socio-demography ...43
6.2. Economic Characteristics ...49
7. EDUCATION PARTICIPATION...61
8. KNOWLEDGE, ATTITUDE AND
BEHAVIOR TOWARDS NUTRITION
AND HEALTH ...65
9. FOOD CONSUMPTION PRACTICES ...77
9.1. Frequency of Food Consumption ...77
9.2. Consumption and Food Consumption Level...83
10. FOOD SAFETY ...89
11. NUTRITITONAL STATUS ...97
11.1. Nutritional Status of the Mother ...97
11.2. Nutritional Status of Children under Five ...98
12. MORBIDITY ...103
xv
LIST OF CONTENT
14. COPING MECHANISMS ...121
15. CONCLUSIONS AND
RECOMMENDATIONS ...135
15.1. Conclusions ...135
15.2. Recommendations ...138
16. BIBLIOGRAPHY ...139
LIST OF TABLES
Page
Table 2.1. Variables of slum ...9
Table 2.2. Clasiication of slum ...11
Table 4.1. Sample allocation by research location ...32
Table 4.2. Methods of measurement and collection of primary data ...33
Table 6.1. Distribution of the respondents by the household size ...44
Table 6.2. Social characteristics of the household members ...45
Table 6.3. Distribution of the husbands by types of jobs ...46
Table 6.4. Distribution of wives by types of jobs ...49
Table 6.5. Distribution of the households by house ownership status ...50
Table 6.6. House size, land width, and the number of bedrooms ...52
Table 6.7. Distribution of households by house windows owned ...53
Table 6.8. Distribution of the households by types of their house loor ...54
Table 6.9. Distribution of the households by types of their house roofs ...54
Table 6.10. Distribution of non-electronic assets in the households ...55
Table 6.11. Distribution of the numbers of electronic gadgets owned by the households ...56
Table 6.12. Statistics of household incomes and expenditures ...57
Table 6.13. he average expenditure of the households (IDR/capita/month) ...57
Table 7.1. Distribution of school-aged children
by educational status ...62
Table 7.2. Distribution of the school-aged (7-to-15-year-old) children who did not attend any school by jobs ...63
Table 7.3. Distribution of the school-aged (16-to-18-year-old) children who did not attend any school by jobs ...63
Table 7.4. he average distance and time to reach the school ...64
Table 7.5. Distribution of the school-aged children by means of transportation to school ...64
Table 8.1. Distribution of the wives by scores of nutritional and health knowledge ...66
Table 8.2. Distribution of the wives answering the questions on the nutritional and health knowledge correctly ...68
Table 8.3. Distribution of the wives by scores of the nutritional attitude ...70
Table 8.4. Distribution of the wives by their responses to statements on nutritional and health attitude ...71
Table 8.5. Distribution of the wives by their scores of nutritional and health practices ...73
Table 8.6. Distribution of the wives by good nutritional-health practices...74
Table 9.1. Frequency of cereal consumption (times/week) ...77
Table 9.2. Frequency of animal food consumption (times/week) ...79
Table 9.3. Frequency of nut and bean consumption (times/week) ...79
Table 9.4. Frequency of leafy vegetable consumption (times/week) ...80
Table 9.5. Frequency of fruit vegetable consumption (times/week) ...80
Table 9.6. Frequency of fruit consumption (times/week) ...81
Table 9.7. Frequency of street-food consumption (times/week) ...82
Table 9.8. Frequency of tea and cofee consumption (times/weeks) ...83
xix
LIST OF TABLES
Table 9.10. Consumption of energy and nutrients per capita per day ...84
Table 9.11. Adequacy levels of energy and nutrients (%) ...85
Table 9.12. Distribution of the households by their energy adequacy level...86
Table 9.13. Distribution of the households by protein adequacy level ...87
Table 10.1. Results of the clean water analyses ...90
Table 10.2. Results of the formalin and borax content analyses ...91
Table 10.3. Results of the dye analyses in chips ...94
Table 10.4. Results of the analysis of heavy metals in fresh vegetables (mg/kg) ...95
Table 11.1. Nutritional status of the mother ...98
Table 11.2. Distribution of the under-ive children by BW/A-based nutritional status ...99
Table 11.3. Distribution of the children under ive by BH/A-based nutritional status ...100
Table 11.4. Distribution of the under-ive children by BW/BH-based nutritional status ...100
Table 12.1. Distribution of the household by their health status ...104
Table 12.2. Distribution of kinds of Diseases the household members sufered within the last two weeks ...105
Table 12.3. Distribution of the duration (days) of having the illnesses the household members sufered within the last two weeks ...107
Table 12.4. Distribution of medical centers for the households within the last two weeks ...108
Table 12.5. Distribution of the chronic diseases that the household members have ever sufered...109
Table 13.1. Distribution of the respondents by healthy life behavior ...111
Table 13.2. Distribution of the respondents by clean life behavior ...114
Table 13.4. Distribution of the respondents by sources
of water for taking a bath and brushing teeth...117 Table 13.5. Distribution of the respondents by sources of water
for washing food materials, cooking utensils and clothes ...119 Table 14.1. Distribution of the respondents
by economic stresses they felt ...123
Table 14.2. Distribution of the respondents by coping strategies
for fulillment of household needs ...126 Table 14.3. Distribution of the respondents by coping strategies
in food expenditures ...127
Table 14.4. Distribution of the respondents by coping strategies
for non-food expenditures (cleanliness and health) ...131 Table 14.5. Distribution of the respondents by coping strategies
in non-food expenditure (educational expenditure) ...131 Table 14.6. Distribution of the respondents by coping strategies
LIST OF FIGURES
Page
LIST OF APPENDICES
Page
Appendix 1. Photos of socio economy at railway side ...153 Appendix 2. Photos of socio economy at riverbank ...154
Appendix 3. Photos of sanitation and hygiene at railway side ...155 Appendix 4. Photos of sanitation and hygiene at riverbank ...156 Appendix 5. Photos of food consumption practices at railway side ...157
1. INTRODUCTION
1.1. Background
When reviewing the poverty problems that are often found in urban areas, we ind how diicult it is to manage a city such as Jakarta. It is not a simple thing because not only the problems of infrastructure development are essential but also the population problems with all of the consequences, especially, dealing with the urbanization that is diicult to control. Urbanization as a social phenomenon proved to have created pockets of slum areas because the people generally only think pragmatically, that is, they want to change the family economy without considering the feasibility of family life such as fulilling the need of adequate housing.
A slum is an area with high population density in a town mostly inhabited by the poor. Slums can be found in many big cities in the world. Slums are generally linked with poverty and high unemployment. Slums can also be a source of social problems, namely, crime, drugs and booze. In many poor countries, slum areas also become the center of health problems because the conditions are not hygienic.
In many slums, especially in poor countries, people live in very dense areas so the areas are very diicult to be passed by vehicles such as ambulances and ireighting cars. In addition, the lack of waste disposal services results in the waste piles.
Some indicators that can be used to determine whether an area is classiied as a slum or not are by looking at: the density level of the area, ownership of land and buildings as well as the quality of existing facilities and infrastructure in the region.
However, the slum condition can not be generalized from one area to another area because slum is speciic and highly dependent on the cause of being run-down. It is not always the case that densely-sparsely populated areas, or areas with a majority of seasonal residents / illegal dwellers are in the category of slums. herefore, an assessment of the level of squalor should consist of a combination of several indicators of existing slums. he health and home comfort of children who live in slum areas will be disrupted because of the government negligence, that is, not paying attention to environmental hygiene for the people. A research in Kampala, Uganda found that 15% of the slum population used a public pit latrine; 75% used shared-toilets; and 10% had private or non-shared sanitation facilities (Katukiza et al. 2010).hose who stay in the slum areas are generally from the countryside and come to urban areas with the aim of improving their household economy; and this is commonly known as urbanism.
In Jakarta, areas near the market, station (rails), terminals, and even the riverbank become the main destination for them to stay temporarily, although they have to bear the risk of lood from year to year. However, they feel that earning their living in the city of Jakarta is easier to get money. Sooner or later these areas become permanent residential slums coupled with other social insecurities. As it happens along the banks of Ciliwung River, from year to year the slum dwelling tends to increasingly reduce the width of the river. As a result, the area around the river has become prone to lood because of the disruption of the river low.
3
1. INTRODUCTION
city arrangement not a simple thing because not only infrastructure development problems become the main concern/issue but also the population problems, particularly, the urbanization which is diicult to control. his led to the City of Jakarta, according to recent data, to become the largest slum areas in Southeast Asia because of the urbanization. he phenomenon of urbanization is much happening in other countries in the world. According to UN Habitat, or the UN Human Settlements Programme, overall, the world now has an additional 55 million citizens of the slums than in 2000. Half of the increase was due to the population growth in slum housing, one-fourth due to urbanization and the other one-one-fourth due to the people who live in the suburbs whose homes were eroded by urbanization (http://www.bbc.co. uk/indonesia/dunia). Rana et al. (2009) found that the number of slums signiicantly increased in Bangladesh over the last three decades along with the expansion of cities and towns. Rapid urbanization, caused largely by heavy inlux of migrants from rural areas, has exerted severe pressure on urban housing and public services in the Metropolitan City of Khulna with which the expansion of infrastructure and basic urban services could not cope. his situation coupled with the destitute economic condition of poor migrants increased slums, resulting in hazardous environmental condition.
slum areas in Dhaka, Bangladesh. In addition, a child from the richest household in the slums is more likely to sufer from diarrhea than a child from the poorest family in rural Kenya (Mugisha, 2006).
A number of 1604 slum households in Dhaka, Bangladesh were surveyed. A total of 65% boys and 75% girls enrolled in primary schools. Most were in public or NGO schools; while the wealthier minority was in private schools. Parental income, parental education and location were good predictors of decisions where to educate children.
Social, economic and cultural changes today, in one hand, have provided encouraging results and succeeded in improving the welfare of society. However, at the same time, these changes have not entirely brought beneicial impacts for the household life, especially for those who live in a complete lack such as households residing in slum areas, for example, the needs of their children’s education, the needs associated with coping mechanisms to support the adequacy of their household and other needs such as food safety and nutritional status, including needs related to the health of mothers during childbirth (morbidity).
5
1. INTRODUCTION
analyzing the urban and rural poverty in the national, provincial and regency/ municipality levels, using basic needs approach where the data are taken from the National Socioeconomic Survey (SUSENAS).
Analyzing more deeply the problems of poverty, for example, poverty in urban areas, is an interesting thing to explore, as it will be investigated in this study. he study on urban poverty associated with the slum area has complicated problems either viewed from the root of the problems or from the perspective of policies to overcome them. hus, the expected results of this study can describe accurately the actual situation in the ield. To further examine the problems of poverty that can be viewed from various aspects, is needed more in-depth assessment with a qualitative approach without neglecting the facts that are quantitative, as it will be done in this study.
In fact, Social Minister Salim Asegaf Al’jufrie in a Coordination Meeting of the Coordinating Ministry for People’s Welfare in Jakarta, explained that the criteria of the houses unit for habitation, among others, are the house loor is soil and the roofs are leaves. He further said that people who lived in houses unit for habitation were still a lot but the ability of the Ministry of Social Afairs to rehabilitate rundown homes was less than 10,000 units per year (http://bataviase.co.id/ node/519961).
According to the Ministry of Housing Suharso Monoarfa, one of the Millennium Development Goals (MDGs) that must be achieved in 2015 is the slums decrease 30 percent. But in fact, the slum areas during 2004-2009 increased from 54,000 hectares to 57,800 hectares. Housing and settlement development program in 2011, according to Suharso, is prioritized to the development of a simple rented lat, facilities and stimulation of self-help housing development, infrastructure and public facilities, as well as the arrangement of the slums. MDGs also aim to address these conditions and standards for water and sanitation as well as pertinent health outcomes. Upgrades in slum household water and sanitation systems have not yet been rigorously evaluated to demonstrate whether there is a direct link to improved health outcomes.
Based on the background mentioned above, we propose to conduct a more in-depth research with the assumption, that there has not been a research that analyzes the aspects of access to food, food security, and coping mechanisms of the households in the slum area in Jakarta.
1.2. Goals and Objectives
1. Analyzing the socio-economic characteristics of the households including age, sex, family size, education, employment, income and home ownership.
7
1. INTRODUCTION
3. Analyzing the knowledge, attitude and behavior of the housewives about nutrition and health.
4. Analyzing household eating habits use the food frequency. 5. Analyzing safety of food consumed by the households.
6. Analyzing the nutritional status of infants, toddlers and pregnant women by anthropometric measurements.
7. Analyzing the morbidity of the whole family (father, mother and child) as diarrhea, Acute Respiratory Infections (ARI), and skin diseases.
8. Analyzing healthy-life behavior including the use of clean water, garbage disposal, and sewage.
2. LITERATURE REVIEW
2.1. Characteristics of Slum Areas
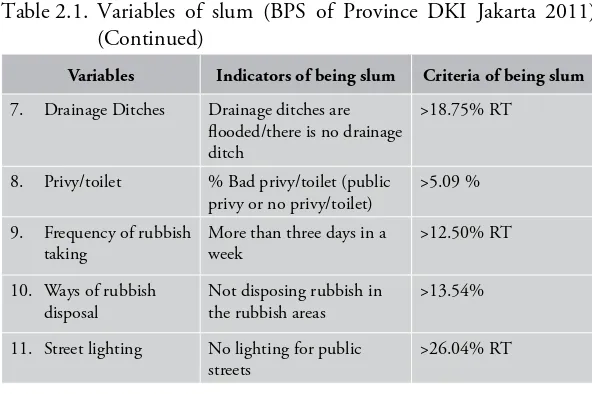
[image:34.397.60.353.286.541.2]According to UU (Law) No 1 Year 2011 of housing and settlement areas, a slum settlement is a settlement which is not reasonably comfortable to live due to disorder buildings, a high density level of the buildings, and the quality of the facilities and infrastructure which do not meet the standard. A slum housing is a housing which undergoes a quality degradation of the functions of housing as a place to stay. he following are variables for determining slum areas.
Table 2.1. Variables of slum (BPS of Province DKI Jakarta 2011)
Variables Indicators of being slum Criteria of being slum
1. Population density he population density above the average of the population density (x + ½ SD)
> 1700 people per ha
2. Spatial Planning of Buildings
he spatial planning of the buildings is not in order/ disordered
>37.50% RT
3. Building construction
% poor buildings >8 percents
4. Building Ventilation % ventilation of the building in poor condition
8.69 percents
5. Building density he building density above the average of the building density (x + ½ SD)
>354 buildings per ha
6. Road he road surface is not asphalted/ cemented, or the asphalted/cemented road surface is damaged
Variables Indicators of being slum Criteria of being slum
7. Drainage Ditches Drainage ditches are looded/there is no drainage ditch
>18.75% RT
8. Privy/toilet % Bad privy/toilet (public privy or no privy/toilet)
>5.09 %
9. Frequency of rubbish taking
More than three days in a week
>12.50% RT
10. Ways of rubbish disposal
Not disposing rubbish in the rubbish areas
>13.54%
11. Street lighting No lighting for public streets
>26.04% RT
Notes:
1) RT is an area which covers several households 2) RW is an area which covers some RTs 3) BPS is Indonesian Central Board of Statistics
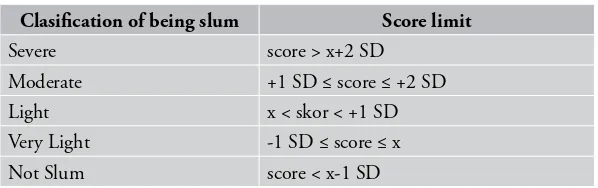
[image:35.397.42.338.84.281.2]Slum areas emerge as a result of the imbalance between the need of settlement and the population growth, where people keep on increasing, whereas, the width of the area remains the same, not increased. he slum areas are usually occupied by people whose socioeconomic condition is relatively low. hey can aford to stay in a reasonably comfortable location. he slum areas, in addition to disrupting the beauty and city order, result in the low health degree in general. he following is the classiication of slum RW in 2011 according to BPS of DKI Jakarta Province.
11
[image:36.397.57.356.98.192.2]2. LITERATURE REVIEW
Table 2.2. Clasiication of slum (BPS of DKI Jakarta Province 2011)
Clasiication of being slum Score limit
Severe score > x+2 SD
Moderate +1 SD ≤ score ≤ +2 SD
Light x < skor < +1 SD Very Light -1 SD ≤ score ≤ x
Not Slum score < x-1 SD
In general, the areas of slum settlements can be classiied into seven typologies, namely, isherman slum settlements, slum settlements around the business centers, slum settlements in the central city, slum settlements in the suburbs, slum settlements in the areas of the rise and fall of the tide, slum settlements in the areas full of disasters, and slum areas in the riverbank (Heryati 2008). In order to create a beauty and city order as well as to improve the health degree of the people, in the plan of the city layout a serious attention need to be given to components of cleanliness and environmental health, particularly in the slum areas. here are three aspects which make environment turn to be slum, that is:
a. Weaknesses of the human resources: the low education level and the lack of the people awareness of the importance of health make them unable to plan their settlements in order to be healthy. b. Economic factors: people living in the slum pockets generally do
not possess any regular income.
c. Land ownership for residing: many people dwelling in slum settlements occupy lands which are not their own (such as occupying government lands).
2.2. School Participation
education up to a junior high level (SMP/MTs). UUD 1945 dan Undang-Undang Nomor 20/2003 of National Education System also requires the government to provide the basic education service free of charge. In line with the program and law, Strategic Plan of the National Education 2005-2009 (Rencana Strategis - RENSTRA pendidikan nasional 2005-2009) and Education for All/EFA (Rencana Kerja Pendidikan Untuk Semua) have been matched (Bappenas, 2010).
For poor people, education fees often become a big burden that this makes their children unable to go to school. Poverty was the main factor of the low igure of basic education participation, where around 70% of students who did not attend a school were due to a inancial disability (Bappenas, 2010).
13
2. LITERATURE REVIEW
2.3. Food Consumption
According to Riyadi (2006), one or a group of people’s food consumption is inluenced by a variety of factors. here are four major factors that afect one’s daily food consumption, that is, food production for the household needs, inancial expenditure for household foods, nutritional knowledge and availability of foods. Food consumption is the quantity of single or various kinds of food consumed by one or a group of people to fulill physiological, psychological and sociological needs. In regards to physiological needs, food consumption is an efort to fulill a desire for food (because of being hungry) or to fulill nutrients required by the body. In regards to the psychological needs, food consumption is to fulill emotional desires or appetite, while for the sociological needs, it is to maintain the relationship among people in the family and society (Sediaoetama, 1996).
Based on the type of data, food consumption can be measured through two ways, that is, quantitative and qualitative methods. Qualitative methods are usually used to know food frequency. Data which can be obtained from the consumption frequency is frequency by kinds of foodstufs and to elicit information on food habits as well as ways of getting the foodstufs. Qualitative methods of food consumption measurement are, among others, food frequency, dietary history, telephone, and food list. Whereas, quantitative methods are meant to know the amount of food and calculated by using Daftar Komposisi Bahan Makanan (Food Compositions Table) or other tables of references. Quantitative methods used to measure consumption, among others, are a-24 hour food recall, estimated food records, food weighing, food account, inventory method, and household food records (Gibson, 1990).
expert in nutrition, or other people who understand about food and nutrition. his method is good enough to be implemented in surveys towards groups of people. he advantages of this method are easy to be implemented and the respondents are not required to be literate because those who provide the model of food, and record are the interviewer (Arisman, 2002).
2.4. Nutritional Knowledge
Knowledge is a result of understanding and this occurs after people hear, observe, touch, taste or feel an object, where most of the knowledge is obtained by people through their eyes and ears. Knowledge or cognition is a dominant matter that is absolutely important for shaping a behavior or action. Actions which are based on knowledge will be more permanent than those which are not (Notoadmojo 1993). he degree of one’s nutritional knowledge inluences his/her attitude and behavior in selecting foods, which will ultimately afect his/her nutritional status. It is expected the higher one’s nutritional knowledge the better his/her nutritional status (Khomsan et al. 2007).
According to Khomsan (2000), the assessment of nutritional knowledge can be done by an instrument which uses a multiple choice form. his instrument can be in a form of question or incomplete statement followed by several options for each item. Nutritional knowledge is divided into three categories, namely:
Good nutritional knowledge: score > 80% Moderate nutritional knowledge: score 60 - 80% Less nutritional knowledge: score < 60%
15
2. LITERATURE REVIEW
may happen to things, situation, person, group, values and all things around the people (Muljono 2000).
Practice is one’s response to a stimulus. A response or reaction can be passive (knowledge, perception, attitude) and can be active (real action or practice). Anything which is obtained in a form of knowledge, which is responded by one in a form of attitude, is relected in practice (action) as a component of behavior.
2.5. Food Safety
According to Joint FAO/WHO Expert Committee of Food Safety
food safety is any conditions and eforts which are required during production, processing, storage, distribution, and preparation of foods to ensure that the foods are safe, free from diseases, wholesome, and good for human consumption.
Uncertainty of food safety is an enemy of consumers’ racial behavior and business investment in a food system. Food safety becomes very crucial nowadays due to two factors: (1) food is the main path of transmission of diseases agents (bacteria, virus and other germs), food is connected with development, because this determines individual and community health, national productivity, as well as it has export potentials and generates revenues (Sulaeman & Syarief, 2007).
he use of borax and formalin is damaging health of the people. In Indonesia, several laws which prohibit the use of borax and formalin as food preservatives are Peraturan Menteri Kesehatan No. 722/Menkes/Per/ IX/1988, Peraturan Menteri Kesehatan No. 1168/Menkes/Per/X/1999, UU No. 7/1996 about Food dan UU No. 8/1999 about Consumer Protection.
Borax or in market well known as pijer, is usually added during food processing to improve rubberiness of the food, as well as to create a delicious taste and solidity, particularly, of foods containing starch (Saparinto & Hidayati 2006). When consumers consume foods containing borax, this will not directly result in bad efects to the consumers’ body; however, the small amount of borax will be absorbed by the consumers’ body cumulatively. When the dosage is high enough, the borax in the body will show some signs and symptoms, such as, being dizzy, vomiting, having diarrhea and having stomach cramps. For children and babies, if the dosage of borax they consume reaches 5 g or more, this may cause death. Among adults, death will happen if the dosage they consume reaches 10 to 20 g or more (Winarno & Rahayu, 1994).
Formalin is a trade mark of solution of formaldehida of 36-40% in water. he use of formaldehida in food may cause toxication in the human body with the following signs and symptoms: diiculty to swallow, queasy, acute stomachache and vomiting, having diarrhea containing blood, depression of the nervous system, or blood problems (Winarno & Rahayu, 1994).
2.6. Nutritional Status
Nutritional status is an expression of a balanced state in certain variables or an expression of nutriture in some variables. Nutritional status is an ultimate result from the balance between the nutrient input and the nutrients required by the body (the nutrient output) (Supariasa
17
2. LITERATURE REVIEW
Direct assessment of nutritional status can be grouped into four kinds, that is, anthropometry, clinics, biochemistry, and biophysics. In general, anthropometry is the size of human body. Anthropometry has been widely used to measure the nutritional status of a community. A variety of antropometric measurements consist of body height, body height, upper arm circumference, and fat under the skin. Viewed from the nutritional side, nutritional anthropometry is related with various kinds of measurement of body dimension and body composition of diferent ages and nutritional levels. Anthropometry is used to see the balance between protein and energy intakes. he imbalance of this can be seen from the pattern of physical growth and the proportion of body tissue, such as, fat, muscles, and amount of water in the body (Supariasa et al. 2001).
he body weight for age (W/A) is considered to be uninformative if it is not followed by an information of body height for age (H/A). he age factor is of paramount importance for determining one’s nutritional status. Inaccuracy in determining one’s age will make the interpretation of nutritional status become wrong. he result of accurate measurement of body height and body weight will be meaningless if the measurement of the age is inaccurate (Riyadi, 2003).
he deicit of the body height for age (H/A) shows accumulative nutritional inadequacy and health in a long period. Body weight for age (W/A) is inluenced by children’ body height and their body weight. A W/H index can provide a description of a body weight proportion relative to the body height. An index of W/H is a good indicator to state one’s nutritional status because W/H can provide a description of the body weight proportion relative to the body height so this index can be used as an indicator of thinness (Riyadi, 2003).
and anthropometry index. he determination of prevalence through z-score is more accurate than through the percentage of median, which provides greatly varied results, either by age group or each index. Scores of children’s nutritional status can be grouped into four categories, namely, good, moderate, low, and poor (Gibson 1993).
he nutritional status according to the body weight fot age (W/A) tends to relect the present nutritional status. he body weight illustrates the body mass (muscles and fat), that is very sensitive to a sudden change, for example, sufering from infectious diseases, decrease in appetite for food or in the amount of food consumed. On the other hand, the index of body height for age (H/A) illustrates the past nutritional status. his is because the body height illustrates the skeletal growth, which is in normal condition, is in line with the age increase (Riyadi, 2003).
2.7. Morbidity
Morbidity and nutritional status are variables which relects a health status. he morbidity includes the prevalence of contagious and non-contagious diseases. he health degree or health status is the degree of individual, group or community degree which measured by the mortality rate, life expectation, nutritional status, and morbidity rate. Health is a complicated matter so that it is impossible to measure all factors that afects it directly or indirectly, and therefore, it is needed an instrument which is able to provide indications that relect health condition. Health indicators can be used to assess health status, to monitor the improvement of health condition and as an equipment to evaluate health programs (Balitbangkes, 2008).
19
2. LITERATURE REVIEW
are determinant ones which very signiicantly afect the degree of community health (Sukarni 1994).
Factors afecting health are disease sparks, human beings, and environment. he imbalance among the three factors may cause health problems that lead to the decrease of one’s health degree. Disease sparks may come from inside or outside of the body. he stamina of the human body will afect one’s vulnerability to diseases. Environment is everything which is present around human beings and can afect their life (Supariasa et al. 2001).
Infectious diseases are those which are caused by microorganism, such as, bacteria, viruses, fungi, protozoa, worms etc. (Shulman et al. 1994). he infectious diseases take place due to the presence of an agent which penetrates into the vulnerable human body (host). he spark of an agent is a combination among the time and the environmental condition which inluence the life perpetuity of the agent, the penetration area, and the presence of other reservoirs from the agent. Mobility and interpersonal contact among population and the period of previous immunity with the same agent or belonging to the same household inluence the number of people vulnerable to diseases (Atmodjo & Rustiawan, 1996).
2.8. Clean and Healthy Life Behavior
Child-birth which is assisted by medical staf (doctors, midwives, and other paramedic staf) use a safe, clean and sterile equipment so this prevents infections and other health problems. Smokers consist of active and passive ones. Both of them are equally dangerous, that is, they may cause health problems, such as hair-fall, eye problems, and a chronic lung disease, tooth damage, stroke, skin cancer, infertility, impotent, cervix cancer and miscarriage (Depkes, 2007). he purpose of immunization is to make children immune to diseases so this can reduce the morbidity and mortality rate as well as reduce disability due to certain diseases (Hidayat, 2004).
Body weight is a health indicator important for everyone. herefore, it is necessary to check one’s body weight regularly and to ind out whether the body weight is ideal, less or over. An ideal body weight shows a good or normal nutritional status (Soekirman, 2000).
Having breakfast is important to do prior to conducting some physical activities in the morning. Firstly, the beneits are having breakfast can provide carbohydrate which is ready to be used to improve the blood sugar level. With a normal blood sugar, enthusiasm and concentration for working can be better so this positively afects the improvement of productivity. Secondly, basically having breakfast will provide an important contribution of some nutrients required by the body, such as, protein, fat, vitamin, and mineral. he availability of these nutrients is important for making the physiological process in the body function well (Khomsan, 2003).
he program of health inance for poor community is important to stimulate the improvement of the public health level. he extension of coverage and improvement of public health service quality must be done simultaneously and followed by some eforts to trigger community participation to conduct a healthy life behavior (Balitbangkes, 2008).
21
2. LITERATURE REVIEW
mouth from food left in it so its fermentation does not last so long that it can cause any plaque. Accordingly, brushing teeth can prevent tooth damage (PDGI, 2011).
Doing an exercise is a physical activity that can be performed regularly for various reasons, among others, for health, physical itness, recreation, education, and achievement (Irianto, 2007). Everyone needs to consume a variety of food in an adequate amount. Various kinds of food will provide great advantages towards one’s health. Each food material in a balanced menu composition will complete one another. Food from various serves can guarantee the fulillment of adequate energy sources, building nutrients and regulating nutrients for one’s nutritional needs (Khomsan & Anwar, 2008).
In addition to 10 indicators mentioned above, the thing that also needs to be considered in the implementation of clean and healthy life behavior is environmental cleanliness which include the availability of privy/toilet, sources of clean water, location for rubbish, drainage for wastewater or sewage, enough room-air or enough ventilation, and not all loor areas are earth (Dinkes, 2006).
2.9. Coping
A critical condition or under stress for a long time may cause a stress among individuals. Keith (2009) states several factors that afect one’s stress level, namely, 1) submissive to whatever the condition is; (2) experiences in handling a stress; (3) individual characteristics; (4) perception towards stress; (5) coping strategy; and (6) social supports. Synder (2001) explains that coping is a process of thinking, feeling, or doing something as fulillment of psychological satisfaction.
can (1) estimate a threat or opportunity in his/her own environment; (2) evaluate the demands and resources or supporting powers in the environment, as well as ability to organize the elements; and (3) utilize a strategy to reduce a negative consequence that may come up in a situation that is full of stresses. When facing causal factors of stresses, one utilizes a coping strategy to reduce a stress that may emerge (Lazarus & Folkman, 1984).
To face a stress, a household is necessary to improve an efective coping strategy. he household’s efective coping strategy and process function as a mechanism so that the household’s functions can be reached. Without an efective coping strategy, economic functions, socialization, household maintenance cannot be achieved optimally (Friedman, 1998). Because of that, household coping is an important process that makes the household able to reach the household’s own functions optimally. Lazarus and Folkman (1984) propose two kinds of coping, namely, emotion focused coping dan problem-focused coping.
Information on coping strategies shows that economic crisis has made poor households withdraw their saving, mortgage their belongings or assets, extend their working hours, or relying incomes on other community members (community-based income-sharing traditions) so that they are free from a worse condition (Soekirman, 2000).
According to Martianto et al. (2006), households’ coping strategy
3. CONCEPTUAL FRAMEWORK
he development of settlements in urban areas can not be separated from the rapid rate of population growth either due to natural population growth factors or the process of urbanization. he population growth and limited land in urban areas led to the development of small row houses that are sold and rented to the outsiders. he houses in small plots were then developed into a dense and slum area called a slum area (Gusmaini, 2010).
As the largest city in Indonesia, Jakarta is also not free from the problem of slum settlement. he locations of slum settlement that tend to spread make it diicult to manage, so almost every administrative town in Jakarta has a slum. Data for 2000 mention slum areas in Indonesia reached an area of 47 thousand hectares and increased to 57 thousand hectares in 2009. According to the BPS 2008, there were 26.9 million housing units in Indonesia which were unit to stay, either the semi-permanent or permanent ones. he number of the homes that were not served by clean water was as many as 9.7 million while the homes that did not get any electricity as many as 3.9 million units and which were not provided any toilets/latrines as many as 10.5 million units (Fahmiarto, 2010). According to Lall et al. (2008), in most developing country cities, residents live in slums have poor-quality dwellings and limited access to basic public services and amenities.
health requirements, the houses are generally built on state land or property of others, grow unplanned and are generally located at strategic locations in urban centers.
In many developing countries, including Indonesia a slum is also a center of health problems because the conditions are not hygienic. Prominent features of slums located in a narrow alley, is a high density of the building, indicated by the distance between buildings that are relatively close (adjacent and opposite) with the construction of permanent buildings. he impacts of a high-density building are the condition of ventilation becomes worse due to lack of air circulation, its drainage becomes narrow and shallow because of limited land, as a result of the settlement during the rainy season is very potential for experiencing lood; the poorly-designed layout and narrow streets lead to circulation movement to be undirected, as well as the environmental sanitation (waste and wastewater) becomes poor (Suparlan, 1984).
he most frequent diagnoses were consequently virosis, acute respiratory infections, and bronchitis of people in slums as showed by study in Nairobi, Kenya (Gulis et al. 2004). In one study, among 262 children <5 years of age, 95 subjects (36%) were colonized with
Streptococcus pneumonia (Reis et al. 2008).
25
3. CONCEPTUAL FRAMEWORK
Poverty is in fact the root of the problem of nutrition. However, it is becoming worse with a lack of knowledge of nutrition and lack of eforts in applying that knowledge in everyday life (Khomsan et al., 2009). One way to improve health is by consuming food and beverages which are safe and have a balanced nutrition. Safe food in this case is not contaminated food, does not contain microorganisms or bacteria and hazardous chemicals, have been processed by the correct procedures so that the physical and nutritional substances are not broken and do not conlict with public health. Some causes of food safety problem is the use of raw materials and water which are polluted due to the processing and presentation environment that is not clean (dirty air, near the garbage disposal), dirty workers, equipment or containers that are not clean and cross-contamination between foods that have been cooked with raw materials.
Nutritional status is deined as health status produced by a balance between the needs and nutrient intakes. Nutritional status can be used as a measure of success in the fulillment of nutrition for children as indicated by body weight and height. Harper et al., (1985) states that poverty and malnutrition are important factors in the malnutrition problem. Another important cause of nutritional disturbance is the lack of nutritional knowledge or ability to apply information in daily life. he inappropriate status of nutrition, either less or more, can cause nutritional problems. he problem of nutrition is a public health problem, which is afected by several factors such as food consumption, infectious diseases, the level of family income, family size, mother’s education level, level of mother’s knowledge about nutrition, health care, cultural abstinence from food, and parenting (Sutiari & Widarsa, 2010).
to utilize the medium of exchange in order to improve the ability in getting the food to ensure the perpetuity of oneself and the members of the household (Sen, 1982).
27
3.
CONCEPTU
AL FRAMEW
[image:52.397.50.538.58.317.2]ORK
4. METHOD
4.1. Research Design, Location and Time
his research is of a retrospective and cross sectional design. he retrospective design is intended to collect the data of income, expense, food consumption, and morbidity. he food consumption was identiied by recalling the frequency of food consumption in the past. his food frequency recall indicate the people’s habit of food consumption. Data of income, expense, food consumption, and morbidity was collected by referring to the previous speciic time frame. he time frame was formulated in the questionnaires. he time frame for data of income and expense is the last previous month; food consumption (collected by food habits/food frequency questionnaires) is the last previous year because some foods are consumed very rarely such as beef, milk, lamb etc. ; the time frame for daily food consumption is the last previous 24 hours; and the time frame for morbidity is the last two weeks. he cross-sectional design is meant to collect data on education, household ownership, asset, hygiene, food safety, enviromental sanitation and coping mechanism for food insecurity, the anthropometric data of household members, knowledge, attitude and practice of nutrition, and morbidity. his is done by recording and measuring variables during the enumerators’ visits to sample households.
hese observations and case studies will present a realistic picture of the local inhabitant’s relevant concepts, perceptions, institutions, and values which used in their life as well as of the ways in which these interrelate. It is not pretended, however, that these case studies will be a representative sample from which reliable quantitative data can be obtained concerning all the inhabitants in the slum areas. Nevertheless, in order to answer the research questions formulated above, facts and igures, which are representative of these slum areas, are needed. Most of these data are collected by means of comprehensive survey carried out by skilled enumerators. he anthropological team gratefully use these facts and igures. It is expected that the case studies and observation add relevant information to data obtained through the survey. In this way, the reliability of part of the survey may be checked and the interpretation of their results be facilitated.
he research was onducted in slum areas of Jakarta and last for 12 months, starting from preparation to writing a inal research report.
4.2. Sampling
31
4. METHOD
he size n was derived through simple random sampling by the following formula (Cochran, 1982):
where:
n = sample size
N = size of the household population
s2 = variance of incomes of the households (Rp/capita/
month)
tα/2(v) = value of t-student random variable, so that P(|t|>tα/2(v))=α; v= degree of freedom of t d = accuracy between the average parameters and sample
of income of the households in slum areas, so that |
x
-µ| < dx
= average income of sample of the households in theslum areas
µ = average income of population of the households in the slum areas
95 % or P( |
x
-µ|<d)=1-α=0.95 or α=0.05. With v assumed to bebig, then t0.025(v)=1.96. With an assumption that the population size of households in slum area is big or N=∼, so n can be calculated as follows:
Sample allocation is presented in Table 4.1 below. Table 4.1. Sample allocation by research location
ith
Stratum Location (Stratum)
Stratum Size (Ni)
Sample Size (ni)
1 Along rail way in Senen Sub-District 339 141 2 Along the riverbank in Tebet Sub-District 423 159
Total 762 300
With the sample size n=300, it can mean that the maximum diference between the average income of the sample (from households) and of its population is Rp 11700 with the probability of 95 %. his is based on the assumption that sampling is made by a simple random technique without replacement.
4.3. Data Collection
Data to be collected consist of primary and secondary data. he primary data include:
1. Data on social aspects (formal education, occupation, household ownership, asset)
2. Data on income and expenditure
33
4. METHOD
4. Hygiene, food safety and environmental sanitation 5. Healthy life styles
6. Anthropometric data 7. Morbidity
8. Knowledge, attitude, practice of nutrition 9. Coping mechanism for food insecurity
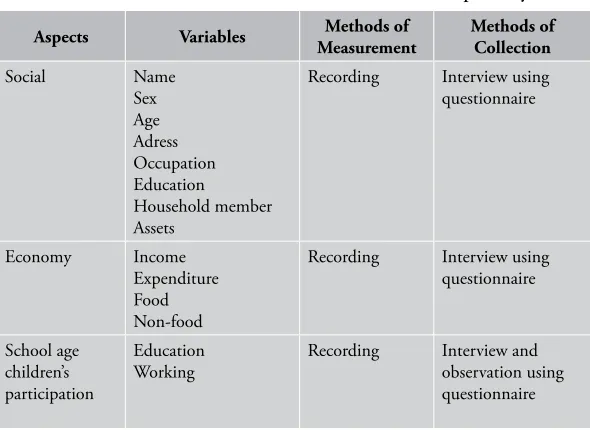
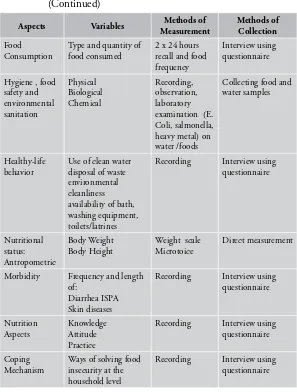
[image:58.397.59.354.317.532.2]he methods of measurement and collection for primary data are listed in Table1 below. he secondary data are the information related to population, sanitation, garbage disposal, water sources in the slum area. he data was collected by ive enumerators. hey are student in their eighth semester and graduates in the related ields. hey were selected through interviews. Before collecting data, the enumerators are trained and informed of the research materials that include objectives, scope, methods of illing in questionnaires and interview techniques. Table 4.2. Methods of measurement and collection of primary data
Aspects Variables Methods of
Measurement
Methods of Collection
Social Name Sex Age Adress Occupation Education Household member Assets
Recording Interview using questionnaire
Economy Income Expenditure Food Non-food
Recording Interview using questionnaire School age children’s participation Education Working
Aspects Variables Methods of Measurement Methods of Collection Food Consumption
Type and quantity of food consumed
2 x 24 hours recall and food frequency
Interview using questionnaire
Hygiene , food safety and environmental sanitation Physical Biological Chemical Recording, observation, laboratory examination (E. Coli, salmonella, heavy metal) on water /foods
Collecting food and water samples
Healthy-life behavior
Use of clean water disposal of waste environmental cleanliness availability of bath, washing equipment, toilets/latrines
Recording Interview using questionnaire Nutritional status: Antropometric Body Weight Body Height
Weight scale Microtoice
Direct measurement
Morbidity Frequency and length of:
Diarrhea ISPA Skin diseases
Recording Interview using questionnaire Nutrition Aspects Knowledge Attitude Practice
Recording Interview using questionnaire
Coping Mechanism
Ways of solving food insecurity at the household level
[image:59.397.43.340.99.491.2]Recording Interview using questionnaire
35
4. METHOD
he data were collected by using questionnaires. For this purpose, a questionnaire was designed and tried out irst before use. he feedback from the try-out was used to improve the questionnaire as to make it more operational.
After the data were collected, they were directly checked. For incomplete or incorrect data, the enumerators had to have them completed or corrected. he researchers as the supervisors were responsible for the task.
4.4. Data Analysis and Management
he preparation before the data entry involved coding variables and creating the structure of iles. he data were checked irst for editing before the entry. he ile structure was arranged by using Microsoft excel. he data were put into a ile structure, and then they were edited by comparing them with the data in the questionnaire. For any diference , the data were edited or corrected.
After the data in the ile were edited, the next steps were generating variables, merging sheets, sorting and merging iles as needed so that the data were ready for an analysis. Elementary statistics such as mean, standard deviation, minimum, maximum and proportion were estimated and presented in the forms of tables and diagrams.
4.5. Research Limitations
4.6. Relevance Of Research
Slum areas is a neglected part of urban development. his is indicated by social demographic conditions in slum areas such as high population density, environmental conditions which are not suitable for habitation and do not meet the requirements, lack of educational, health facilities, and of socio-cultural infrastructure. he growth of slums occurred because urbanization cannot be stopped.
Settlement will not stop as the source of the problem in the history of human life. he more expanding slum areas in a region, especially in Jakarta, exacerbate a number of problems faced by the people living in these locations and the local government. Unit dwellings such as houses that are too crowded, the buildings which are not permanent, limited clean water, and dirty environment are the causes of high risk of contracting various diseases such as diarrhea, upper respiratory tract infections (ARI), and skin diseases. he results of a research conducted in the slum area in Bali showed 80% admitted not having any latrines and defecating in a river.
A poor health status coupled with the low purchasing power of food due to poverty further aggravates the condition of the nutritional status of families, particularly vulnerable groups such as infants, toddlers and pregnant women. Riskesdas data (2010) showed that about 35% of children were stunted and 17% were malnourished.
37
4. METHOD
5. SOCIAL MAPS OF THE
RESEARCH AREAS
5.1. Research Areas
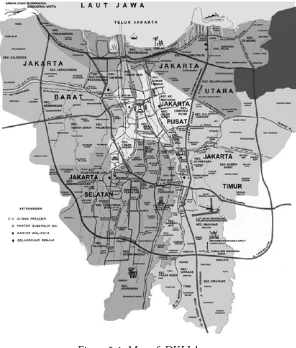
Province DKI Jakarta is the capital city of Indonesia, which is located in 6⁰ 12’ South Latitude and 106⁰ 48’ East Longitude. his area is a lowland of 7-meter height above the sea level. DKI Jakarta is divided into ive areas of administrative cities and one administrative regency, namely, Administrative Cities of Jakarta Pusat with the size of 47.90 km2, Jakarta Utara with the size of 142.20 km2, Jakarta Barat with
the size of 126.15 km2, Jakarta Selatan with the size of 145.73 km2, and
Jakarta Timur with the size of 187.73 km2, as well as Administrative
Regency Kepulauan Seribu with the size of 11.81 km2. In the north
Figure 5.1. Map of DKI Jakarta
he number of people of Jakarta Province in the year 2011 was 9,729,500 with the growth rate of 1.7% and the density was 13,325 people/km2. Based on a survey of RW Kumuh (Slum RW) in 2011,
41
5. SOCIAL MAPS OF THE RESEARCH AREAS
he slum areas along the Ciliwung riverbank were in Sub-district Matraman and Sub- district Tebet in Manggarai area, Jakarta Timur. he slum areas along the railway were in Sub-district Senen in Kramat Sentiong area in Jakarta Pusat. Both of the slum areas were very densely-populated areas.
5.2. Life of the Slum People
From a glance description we could say that both areas under study, either the area along the railway side or the area along the riverbank belonged to the poor areas. In general the poverty patterns of both areas were relatively the same. A slight diference which could be observed was that the area in the railway side seemed to be poorer than that in the riverbank.
Poverty as stated by Suparlan (1994) is a condition of being lack of wealth or precious things sufered by one or a group of people. he consequence of being lack of wealth or the precious things is that one or a group of people feel unable to inance the life necessity as it should be. he inability was found not only at the level of cultural needs (tradition, ceremonies, moral and ethics), or at the level of the fulillment of social needs (education, communication and interaction with fellows, but also at the level of fulilling their basic needs, such as, food, drink, clothes, housing, health, etc.
At the community level, physical poverty was described by houses and settlement which were slum, small-sized, dense and clustered, sanitary facilities which were inadequate, and the low level of organization outside the nuclear family and the extended family. Besides that, the people in the slum areas were inefective in taking participation and integrating themselves in the community institutions that this leads to being afraid, high suspicion, apathies, and disintegration.
level, poverty was indicated by outstanding characteristics, such as, low education, strongly feeling useless, being unable, high dependence and feeling inferior.
6. SOCIO-DEMOGRAPHY AND FAMILY ECONOMY
6.1. Characteristics of Socio-demography
A slum settlement is a settlement which is densely-populated, whose socio-economic condition is generally low, in which a number of houses are jammed together, and whose size is under standard. Few environmental infrastructures existed in a slum settlement or did not meet technical and health requirements, were commonly built in the lands owned by the government or others, grew unplanned and generally existed in a strategic location in the city centers (Dinas Tata Kota--Department of City Management DKI Jakarta 1997).
he causes of a slum settlement emergence were a high growth of the city, which was not accompanied by an adequate income rate and the slowness of the city government in planning and building the infrastructure, especially roads, in a growing area of a new settlement. In line with the increasing demand of housing, the people independently split the land and build a settlement without an adequate site plan. As a result, the shape and layout of land lots were not in order and not completed with a basic infrastructure of a settlement (Sadyohutomo, 2008).
Table 6.1. Distribution of the respondents by the household size
Variables
Railway side (n=141)
Riverbank (n= 159)
Total (n=300)
n % n % n %
Small (< 4 persons) 36 25.2 63 39.4 99 32.8 Medium (4-6 persons) 35 24.8 47 29.8 86 28.8 Big (6-10 persons) 58 40.9 46 28.8 104 34.6 Very Big (>10 persons) 13 9.1 3 2.1 11 3.8
Total 141 100.0 159 100.0 300 100.0
45
[image:70.397.59.355.101.257.2]6. SOCIO-DEMOGRAPHY AND FAMILY ECONOMY
Table 6.2. Social characteristics of the household members
Variables Railway side
(n=141)
Riverbank (n=159)
Total (n=300)
Age (years)
- Husbands 43.6 ± 12.6 45.6 ± 11.6 44.7 ± 12.1 - Wives 42.1 ± 12.7 42.8 ± 12.1 42.5 ± 12.4 Length of Education
(years)
- Husbands 8.8 ± 3.5 8.3 ± 3.9 8.5 ± 3.7 - Wives 7.3 ± 3.5 6.9 ± 4.3 7.1 ± 3.9 Total household
members per house 5.8 ± 2.7 4.7 ± 2.6 5.2 ± 2.7
Education 0f the husbands was generally higher than the wives (8.5 years vs 7.1 years), but their education level was in fact still low