Nitrogen balances for households in the mid-hills of Nepal
C.J. Pilbeam
a,∗, B.P. Tripathi
b, D.P. Sherchan
c, P.J. Gregory
a, J. Gaunt
daDepartment of Soil Science, The University of Reading, Whiteknights, P.O. Box 233, Reading, RG6 6DW, UK bARS-Lumle, P.O. Box 1, Pokhara, Nepal
cFormerly ARS-Pakhribas, Dhankuta, Nepal dIACR-Rothamsted, Harpenden, Herts, AL5 2JQ, UK
Received 24 February 1999; received in revised form 24 September 1999; accepted 27 October 1999
Abstract
Sustainable production requires balanced resource use and it is the management decisions at a household level that determine nutrient fluxes and the economic viability of enterprises. Traditionally, the agricultural systems of the mid-hills of Nepal have relied on the close integration of forestry, livestock husbandry and crop production but increasing population and other social changes are straining these systems. This paper uses diverse sources to determine a N balance for a hypothetical household and to assess the sustainability of current farming systems with respect to N. For a hypothetical household holding 1 ha of land with two-thirds of it rainfed hillside (bari-land) and one-third irrigated lowland (khet-land), the system is currently in
balance with inputs across the boundary of about 26 kg N a−1(mainly in fertilizer) and losses, excluding gases, of about 60 kg
N a−1(mainly in crop removal). Tree fodder and grasses are a major source of N (80 kg N a−1) to the household. A major
pathway for the flow of N within the system is via the forage fed to livestock, and the subsequent application of manure to crops. Typically, manure and compost supply 100 kg N to crops (four times that supplied by fertilizer) and produce crops with a N content in grains of 36 kg N. The N losses via soil erosion are shown to be small but the losses via leaching and gases are largely unquantified. It is concluded that the use of tree fodder and forage from forest areas and grasses from terrace risers as animal feed ensures a net movement of N from non-agricultural land to agricultural land. The magnitude of this movement is not known, because the quantities of vegetation gathered from inside and outside the household boundaries are not known. © 2000 Elsevier Science B.V. All rights reserved.
Keywords:Farming systems; N budget; Nepal
1. Introduction
The middle hills of Nepal, lying between 1000 and 1600 m, cover 4.44 million ha (Carson, 1992) of which approximately one quarter is cropped (1.23 million ha; LRMP, 1986a). Nationally, 70% of the cropped area is as rain-fed terraces (bari land), while irrigated
∗Corresponding author. Tel.:+44-118-9316557; fax:+44-118-9316660.
E-mail address:[email protected] (C.J. Pilbeam)
land (khet) constitutes the remainder (LRMP, 1986a). There is little deviation from this distribution within the five development regions in Nepal. In 1991, more than 50% of the population of Nepal, which was then 18.5 million, lived in the hill and mountain areas (CBS, 1991), with an average density of 89 people km−2. Agricultural productivity of the middle hills is, there-fore, of vital interest to many Nepalese.
Traditionally, crop production, livestock husbandry and forestry are integrated closely in the agricultural systems of the mid-hills (Carson, 1992; Kiff et al.,
1995). The grazing of animals in the forest, the col-lection of forage from the forest to feed housed ani-mals, and the use of forest litter for animal bedding, mean that there is a net movement of nutrients from the forest to the cropped areas via livestock produc-tion (Turton et al., 1995). In addiproduc-tion to the use of ma-nures and composts, soil fertility of the cropped areas is maintained by a variety of other techniques, for ex-ample diverting nutrient-rich flood waters on to khet land, tethering animals on cropped land, and growing legumes either as green manures or in rotation. Crop yields in the traditional systems are low and insuffi-cient to support a burgeoning population. Intensifying agricultural production increases productivity, which is necessary, but simultaneously results in more open nutrient cycles (Jodha, 1990) thereby increasing the susceptibility of the system to larger nutrient losses and, perhaps, reducing its long-term sustainability.
A nutrient balance quantifies the input of a particu-lar nutrient to an area of land and subtracts from this the output of the same nutrient from the same area of land (Stoorvogel et al., 1993). The balance may be positive, if inputs exceed outputs, or negative, if outputs exceed inputs, and is a quantifiable indicator of sustainability (Smaling et al., 1996). Nutrient bal-ances not only indicate sustainability but, by chang-ing the inputs and outputs, also allow the outcome of different future scenarios to be compared (Stoorvo-gel et al., 1993). While these scenarios are generally compared on the basis of the particular nutrient, their socio-economic impact can also be evaluated if rele-vant economic data are available (de Jager and Smal-ing, 1997). Nutrient balances can be constructed at a range of scales, for example supra-national (Stoorvo-gel et al., 1993) or district (Smaling et al., 1993) but it is at the household level that nutrient fluxes are most directly affected by management decisions (Smaling et al., 1996). Furthermore, the concept of sustainabil-ity combines balanced resource use with economic vi-ability, and it is at the level of the household that the biological, social and economic considerations are in-tegrated.
This paper aims to determine a N balance for a hypothetical household in the mid-hills of Nepal and thereby highlight gaps in the quantitative knowledge of N flow. Using the quantitative cycle, sustainability was assessed with respect to N of the current farming systems in the hills of Nepal, along with the impact of
perturbations to the system caused by either a change in the supply of N to or from parts of the system, or an increase in the efficiency of N use (Pandey, 1996).
2. Defining a typical household in the mid-hills
Survey data (Turton et al., 1995) show that house-holds in the mid-hills of Nepal vary considerably in terms of their size, cropping pattern, livestock num-bers and access to trees, as a consequence of physical and social factors. Regional differences in the charac-teristics of households are also evident, although the variation found within a region is probably as great as the differences between regions (Tollervey, pers. commun., 1998). In fact this assertion is supported by the results of an unpublished socio-economic survey comparing 256 households stratified by food self-sufficiency in two village development commit-tees (VDCs) in the western region with 256 house-holds in two VDCs in the eastern region of Nepal (Mathema, pers. commun., 1999). For this reason, discrepancies in household characteristics between regions will be ignored and, by amalgamating data from diverse sources, a hypothetical household in the mid-hills will be defined. Although from diverse sources much of the data originates from either Agri-cultural Research Station (ARS) Lumle in Kaski District in the western region, or ARS-Pakhribas in Dhankuta district in the eastern region.
In a survey published in 1986, approximately 1 ha was owned per household (LRMP, 1986b). Thapa (1989) observed an average farm size of 0.5–1.0 ha, which had fallen to <0.5 ha in surveys reported in
et al., 1995), although wealthier households own relatively more khet and less bari land than poorer ones. It is common for khet and bari land for a single household to be widely dispersed. Sharma (1996a) reported that, on average, land holdings were divided into 3.9 different pieces of land. This was a reduction from the values between 4 and 9 reported earlier by LRMP (1986b). It is assumed that the hypothetical household owns four pieces of land.
Currently, there is an average of two crops per year grown on bari land. Production on bari land during the monsoon season is dominated by maize (LRMP, 1986a) which yields from 1.4 (Gurung and Shrestha, 1996) to 2.6 Mg ha−1 (Vaidya and Gurung, 1995) in the eastern and western hills, respectively. Finger mil-let (Eleusine coracana), which is either relayed or grown sequentially with maize yields 1.16 Mg ha−1 on average (Katuwal and Tiwari, 1997). In general, fewer crops are grown on khet land (an average of 1.5–2.0 crops per year, but dependent upon altitude), where production is dominated by rice, which yields 2 Mg ha−1on average (Sherchan et al., 1999). Rice is commonly grown in rotation with partially irrigated wheat (Triticumsp.), which yields 2–3 Mg ha−1on av-erage (Subedi, 1994; Tiwari et al., 1997). All of the average yields reported here are derived from exper-imental plots associated with either ARS-Lumle or ARS-Pakhribas. It is assumed that the grain yields from the hypothetical household are the average of those presented in the preceding text. Assuming a har-vest index of between 0.4 and 0.45 for the major cereal crops grown in the mid-hills of Nepal, approximate straw yields range from 1.4 Mg ha−1for finger millet to 3.5 Mg ha−1for wheat, with 2.5 Mg ha−1of maize and rice straw.
More than half of the animals in Nepal are found in the mid-hills with 3.3 livestock units (LSUs) per household, comprising one bullock (or ox), one buffalo, two cows, two goats and poultry (Sharma, 1996b). The actual numbers and species of animals per household vary by region, but most households own cattle, buffalo, goats and poultry. Larger estimates of livestock numbers per household (two buffalo, two cows, two oxen, four goats/sheep and six chicken, and equivalent to 5.2 LSU) were made by Gurung et al. (1989) in the Koshi hills of eastern Nepal, while the averages (2.39 cattle, 1.42 buffalo, 2.32 goats/sheep and 0.23 pigs, or 3.8 LSU) produced by Joshi and
Panday (1991) are less than the 5.8 and 4.3 livestock units per farm found by Thapa (1994) and Turton et al. (1995), respectively. Thorne (pers. commun., 1997) observed that numbers of LSU per household in E. Nepal varied from 2.5 to 8. Synthesizing all of these values it is concluded that a hypothetical house-hold might, therefore, have 4.4 LSU, comprising (in order of decreasing size) two buffalo, two oxen, one cow, three goats and some chickens.
Trees provide timber and fuel for the household and fodder for livestock. The numbers of trees per household vary widely, but have generally increased on bari and non-cultivated land in recent years (Carter and Gilmour, 1989), particularly among wealthier farmers who possess more land. Estimates of the numbers of trees per farm range from as low as 16.8 (Hopkins, 1983) to 300–400 (Fonzen and Oberholzer, 1984), although 36–160 (Wyatt-Smith, 1982) and 50–80 (Thapa, 1994) are perhaps more likely values. The latter values have been chosen to represent the hypothetical household. 170 tree species are used for fodder, but only 30 are used extensively (Shrestha and Tiwari, 1992). Estimates of fodder production from trees on farms are generally between 60 and 90 kg fodder per tree per year (Hopkins, 1983), although a more detailed study of annual production of individ-ual trees in different forests in the Central Himalaya yield estimates of 4–90 kg fodder (leaf and twig) per tree per year (Rana et al., 1989) depending on species and forest type. This compares well with the estimates by Wyatt-Smith (1982) of 20–86 kg fodder per tree per year. Less than one third of the fodder require-ments for animals come from trees (LRMP, 1986c; Subba et al., 1994), and as little as 15% of the total digestible nutrients come from fodder trees (Shrestha and Tiwari, 1992). According to Thapa et al. (1990), “although fodder trees and forest fodder provide a nutritive supplement, the bulk of fodder during the riod of scarcity is provided by crop residues”. The pe-riod of scarcity occurs immediately prior to the onset of the monsoon season. Reference to the significance of the forest and trees for fodder is regularly made (Carson, 1992; Turton et al., 1995), but the preceding analysis suggests that its importance is perhaps over-stated.
Table 1
A summary of characteristics selected from the available literature to define a hypothetical household in the mid-hills of Nepal and subsequently used for calculating the N budget
Characteristic Attributed values
Total land area (ha) 1.0
Pieces of land 4
Bari : kheta 2 : 1
Trees 50–80
No. of Animals
Buffalo 2
Bullock (Ox) 2
Cows 1
Goat 3
Chicken 6
Crops (kg ha−1) Average grain yieldb
Maize (Zea maysL.) 2000 (3000) Finger millet (Eleusine coracana) 1160 (1740) Rice (Oryza sativaL.) 2000 (3000) Wheat (Triticum aestivumL.) 2500 (3750)
aBari land is rainfed, while khet land is irrigated.
bAverage straw yield (kg ha−1) in parenthesis assuming an
harvest index of 0.4.
3. Estimating a nitrogen balance
3.1. N produced in faecal material
According to Rasali et al. (1996) annual rates of production of manure per animal are 4.7 Mg for cows, 5.5 Mg for buffalo, 0.3 Mg for goat and sheep, and 0.2 Mg for pigs. Annual amounts of manure produced per household vary and are especially dependent on the numbers of large ruminants kept. Nevertheless, using the above rates of manure production and the number of animals designated for a hypothetical household, then a hypothetical household might produce 26 Mg FYM per year. This falls within the range of 1–31 Mg FYM per household per year measured by Vaidya
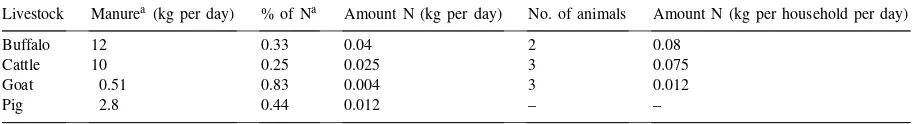
Table 2
Amount of N produced in manure per day per livestock type in a hypothetical household in Nepal
Livestock Manurea(kg per day) % of Na Amount N (kg per day) No. of animals Amount N (kg per household per day)
Buffalo 12 0.33 0.04 2 0.08
Cattle 10 0.25 0.025 3 0.075
Goat 0.51 0.83 0.004 3 0.012
Pig 2.8 0.44 0.012 – –
aSource: Khadka and Chand (1987).
(1988), but is greater than the estimate of 20 Mg FYM per household per year derived from the figures of Khadka and Chand (1987). While it is likely that both Rasali et al. (1996); Khadka and Chand (1987) doc-ument fresh weights rather than dry weights, a possi-ble explanation for the greater values of Rasali et al. (1996) may be that they report values for manure (fae-cal material plus bedding) while Khadka and Chand (1987) report values for faecal output only. Khadka and Chand (1987) measured the daily faecal output (kg fresh weight) for different livestock species in Nepal (Table 2), and assumed a N concentration on a wet basis (Table 2). The total N output in manure for a household depends on the numbers of each species kept by a particular household. Using representative values for numbers of animals per household (Table 1) and the quantity and quality values for faecal output of Khadka and Chand (1987), the daily output of N in manure from a hypothetical household is<0.2 kg N,
or 61 kg N per year (Table 2).
3.2. N inputs through fertilizer and manure to cropping system
Table 3
Calculation of the total manure N application for a hypothetical household. (See text and Table 1 for details)
Crop Area Amount FYM (Mg ha−1) Amount FYM (Mg area−1) % of N Amount N (kg N area−1)
Maize 0.66 10 6.6 1 66
Wheat 0.33 10 3.3 1 33
Rice 0.33 10 3.3 1 33
when full. In the hypothetical household it is assumed that maize, rice and wheat crops each receive FYM at a rate of 10 Mg ha−1. According to Pandey (1996), FYM has an average N concentration on a dry weight basis of 1% (±0.5%), a value confirmed in some stud-ies by Subedi et al. (1996), so between 25 and 100 kg N are applied as manure per ha per year. In a hypo-thetical household, crops occupy<1 ha, and so it is
possible for the annual household production of ma-nure to match the crop requirements. For example, if 66% of a 1 ha farm is bari land sown to maize and the remainder is khet growing wheat, the total application of N is 99 kg N ha−1a−1, which is within the limits of manure application calculated above (Table 3). How-ever, it should be noted that manure is also increas-ingly applied to rice, perhaps at the expense of maize, and this may alter the N requirement of the household. Recommended application rates of N fertilizer for improved varieties of rice and maize are 100 and 120 kg N ha−1 respectively, and 80 kg N ha−1 for wheat (LARC, 1997). Finger millet is grown on residual soil fertility. On average hill-farmers apply less; 12.8 kg N ha−1 (NAPP, 1995), depending espe-cially on location, farmer perception of soil fertility, economic status of the farmer and land type. On av-erage, between 10 and 25 kg N ha−1 are applied to maize grown on bari land, while 10–15 kg N ha−1are
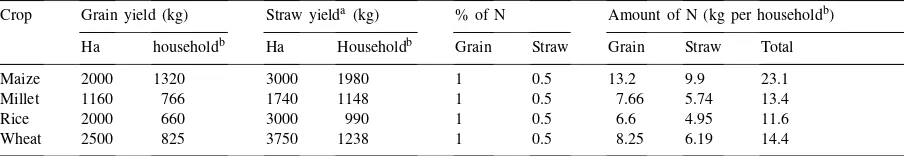
Table 4
Grain and straw yields (kg ha−1) and amounts of N (kg N ha−1) in grain and straw of crops commonly grown in the mid-hills of Nepal,
and found in a hypothetical household defined in Table 1
Crop Grain yield (kg) Straw yielda (kg) % of N Amount of N (kg per householdb)
Ha householdb Ha Householdb Grain Straw Grain Straw Total
Maize 2000 1320 3000 1980 1 0.5 13.2 9.9 23.1
Millet 1160 766 1740 1148 1 0.5 7.66 5.74 13.4
Rice 2000 660 3000 990 1 0.5 6.6 4.95 11.6
Wheat 2500 825 3750 1238 1 0.5 8.25 6.19 14.4
aAssuming a constant harvest index of 0.4. bAssuming a 2 : 1 ratio bari : khet land.
applied to both rice and wheat grown on khet land (Sherchan, pers. commun., 1998). For a hypotheti-cal household therefore, a total of 26 kg N ha−1 are applied to land in a year.
3.3. N offtake in crops
The proportion of N in the grain and straw of a cereal crop at harvest is generally consistent between years and locations. Grain has approximately 1–1.5% N, while straw has 0.5–1.0% N. This consistency en-ables the calculation of the approximate amount of N removed in the crop. For example, the total amount of N removed in a single year from a maize-finger millet rotation on 0.66 ha of bari land is approximately 37 kg N (21 kg N in grain and 16 kg N in straw; Table 4). If the remaining 0.33 ha of land owned by the household is sown to a rice-wheat rotation, then the annual total N removed from khet land is calculated to be 26 kg N (15 kg N removed in grain and 11 kg N removed in straw; Table 4).
3.4. N input to livestock
Neopane et al. (1990) estimate that 25 kg fresh ma-terial is fed to a buffalo per day, although Delobel (1986) estimated between 8–36 kg fresh weight per day depending on season and lactation. In a survey of farmers in eastern Nepal, Thorne (unpublished data, 1997) estimated that buffalo, cow, ox and goat were fed 30, 21, 12.5 and 3 kg fresh material per day, re-spectively, during the monsoon period (assumed to be 155 days), and about less than half of this amount per day during the dry post-monsoon period (assumed to be 210 days), assuming a liveweight of 450 kg for buf-falo, 225 kg for cows and oxen and 25 kg for goats. Crop residues (dry and green), grass and tree fodder account for more than 90% of the large ruminant feed, and approximately 70% of goat feed, with broadleaved weeds accounting for much of the rest (Thorne, un-published data, 1997). The relative importance of these three feed types varies with animal species. Tree fod-der accounts for 10–15% of large ruminant feed, but >30% of goat feed, while crop residues (dry and green) account for 35–45% of large ruminant feed but<10%
Table 5
Average amounts of dry matter (kg a−1) and N fed per annum (kg N a−1) from different feed-stuffs to different numbers of livestock
from different livestock classes used to calculate the total annual N requirement (kg N a−1) from different animal feeds for a hypothetical
household in the mid-hills of Nepal
Feed type Livestock class DM feda N intake No. of Total N required
(animal per year) (animal per year) livestock (household per year)
Dry crop buffalo 800 3.6 2 7.2
Residue cattle 600 6.1 1 6.1
ox 442 4.6 2 9.2
goat 10 <0.1 3 0.3
total: 22.8
Tree fodder buffalo 362 6.5 2 13
cattle 229 5.2 1 5.2
ox 84 1.8 2 3.6
goat 78 1.7 3 5.1
total: 26.9
Grass buffalo 1135 10 2 20
cattle 829 12.6 1 12.6
ox 463 7.2 2 14.4
goat 96 1.6 3 4.8
total: 51.8
Green Crop buffalo 271 16.5 2 33.2
Residue cattle 184 3.1 1 3.1
ox 144 2.5 2 5
goat 6 <0.1 3 0.3
total: 41.6
aAssuming 155 days for monsoon period and 210 days for dry period.
goat feed. Grass accounts for 30–45% of feed require-ments irrespective of livestock class.
The percentage crude protein content of tree fodder was found to be 9–14% (Subba and Tamang, 1990) or 18% (Shrestha and Tiwari, 1992), or approximately 1.5–3.0% N assuming a N to crude protein conversion factor of 6.25. Consequently, each buffalo, cow, ox and goat is annually fed approximately 6.5, 5, 1.8 and 1.7 kg N, respectively, in tree fodder (Table 5; Thorne, unpublished data, 1997). Annual values of N fed as grass to the same livestock classes are 10, 12.6, 7.2 and 1.6 kg N, respectively. Totals of 27 and 52 kg N are required as tree fodder and grass, respectively, per household per year. (Table 5). Little N is fed as dry crop residue, approximately 3.6, 6, 4.6 and<0.1 kg N
ca. 40% of N intake by buffalo) but their significance as a source of N for cows, oxen and goats is less (ca. 10–15% of N intake).
The total annual N requirement for animal fodder is approximately 167 kg N per household. 143 kg N is provided in dry and green crop residues, grass and tree fodder. Broadleaved weeds, N-rich vegetable matter and concentrates provide the remainder. Ap-proximately 10% of food offered to large ruminants (buffalo, ox and cow) is refused, whereas 30% is refused by goats (Thorne, unpublished data, 1997). Slightly more is refused in the dry season than in the monsoon (Thorne, unpublished data, 1997). Conse-quently, 23 kg N per household of the total annual N requirement is refused, and perhaps enters the com-post heap directly without passing through the animal.
3.5. N inputs to soil
Nitrate concentration in rain is generally <0.5
mg l−1(Collins and Jenkins, 1996) and has changed little over time; measurements in snow and ice from glaciers give similar concentrations (Nijampurkar et al., 1993). Ammonium concentrations in rainfall are low, on average <0.5 mg−l (Collins and
Jenk-ins, 1996). Assuming an annual rainfall of 1500 mm,
<15 kg N ha−1 will be deposited in rain, half as
ni-trate and half as ammonium. A similar amount may be added through wet and dry deposition, although it has not been measured in Nepal.
Mineralization of organic N is dependent particu-larly on the N and C contents of the soil, and soil temperature and moisture content. These latter envi-ronmental factors change markedly between the mon-soon and dry seasons. Net mineralization of soil N may be estimated from the yield of unfertilized crops (Subedi, 1993, 1994; Sherchan et al., 1999), assum-ing a harvest index (0.4) and a % N content similar to that described above (3.2 and Table 3) and subtract-ing a value (ca. 25 kg N ha−1) for N deposited in rain and dust (above) gives a value for mineralization of 50–75 kg N ha−1a−1.
Nitrogen may also be added to soils on khet land through irrigation water. Analyses of stream water for four catchments in the Likhu khola watershed show skewed distributions of both nitrate and ammonium concentrations (Collins and Jenkins, 1996). Although extreme values of ammonium and nitrate were 1.25
and 2.0 mg l−1, respectively, the mean values were approximately 0.1 mg l−1for both nutrients. Unfortu-nately, the volume of water used to irrigate khet land has not been measured in Nepal. Organic N may also be found in irrigation water, but its concentration is not known.
3.6. N losses from soil
High rainfall (>1000 mm) within a few months in the mid-hills of Nepal probably results in N be-ing leached especially from bari land. Nitrate may also be leached when khet soils are flooded prior to rice transplantation if nitrate accumulates in the soil profile after the harvest of the preceding wheat crop. Buresh et al. (1989) estimated that 95% of nitrate accumulated during a dry season crop was lost upon flooding of the soil. Nitrate may also be leached during rice cultivation where puddling prior to transplantation does not create a completely im-permeable layer. Singh et al. (1991) reported that ca. 13% of urea fertilizer was lost due to leaching in coarse textured soils. Actual amounts of N leached have not been quantified, although model predictions for 4 catchments in the Likhu Khola watershed sug-gest losses of 5.8–18.5 kg N ha−1a−1 (Jenkins et al., 1995), approximately equal to that added in rainfall.
Runoff occurs on bari land and was estimated to be between 5 and 10% of total rainfall for cultivated erosion plots on bari land in the Likhu Khola in 1993 (Gardner et al., 1995), although exceptionally it may be between 20 and 30%. Assuming a rainfall of 1500 mm and a concentration of 0.1 mg l−1 for both ammonium and nitrate in the runoff, then the loss of N in solution will be<0.5 kg N ha−1, which accords
with the runoff data from Gaskin (pers. commun. 1997), although Collins and Jenkins (1996) state that concentrations of N in stream water increases during the monsoon due to runoff from highly fertilized bari land.
Gaseous losses of N by denitrification or volatiliza-tion from khet and bari land have not been measured in Nepal, although preliminary data on losses of 15N-labelled fertilizer from bari land (Pilbeam, 1997
and 1998; unpublished) suggest that they may be significant.
and concluded that annual losses broadly fell into two groups, those <5 and those >15 Mg ha−1a−1,
although different methodologies make comparisons difficult. Larger losses are particularly common on the red soils of central and eastern Nepal. Losses are af-fected by rainfall intensity, ground cover, cultivation and previous rainfall, and so vary considerably during the monsoon season. Analyses for the percentage total N in 340 soil samples from bari land in the western development region of Nepal averaged 0.27% (Tur-ton et al., 1995) so that 13.5 kg N ha−1 will be lost when 5 Mg soil ha−1are eroded. This equates to 9 kg N ha−1a−1from the bari land of a hypothetical house-hold. The N concentration of agricultural soils in the Jhikhu Khola watershed (0.12%; Schreier et al., 1994) was lower than that mentioned above, and so losses in eroded material would be commensurately lower.
3.7. Constructing the balance
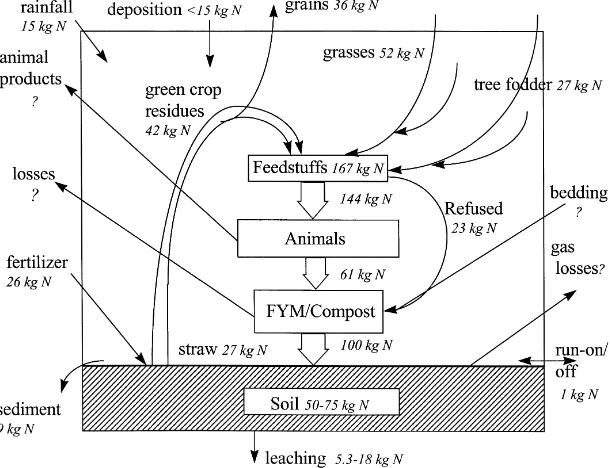
A N balance for a hypotheical household in the mid-hills of Nepal is shown in Fig. 1. There is remark-ably good agreement between the data from diverse sources. Total losses of N in eroded material from bari
Fig. 1. A flow diagram of N for a hypothetical household in the mid-hills of Nepal, showing the amounts of N flowing through different pathways. Unknown quantities are represented by? (See text for details).
land (9 kg N ha−1), and runoff (<0.5 kg N ha−1) and leaching (12 kg N ha−1) from both bari and khet land are quantitatively similar (ca. 21 kg N ha−1) either to inputs in rainfall plus deposition (25 kg N ha−1), or to inputs of fertilizer N (26 kg N ha−1). These losses of N are both small amounts relative to the amount of N re-moved in grain and straw (63 kg N ha−1). The amount of N removed in grain (36 kg N ha−1) is greater than that added as fertilizer, but less than the amount of N mineralized from soil organic matter (50–75 kg N ha−1). The N off-take in straw (27 kg N ha−1) is comparable to the amount of N fed to livestock as dry crop residue (23 kg N ha−1). Amounts of N fed to livestock are inevitably greater than those produced as manure because some is retained as animal prod-ucts, and not all is excreted. Further discrepancies are introduced by the loss of ammonia from the rumen, or from the urine and faeces prior to measurements.
4. Impact of perturbations to the system
examine the effect of changes to the system. Possible scenarios are as follows:
1. The number of large ruminants kept by a household is declining (Kiff et al., 1995) as a specific conse-quence of a reduction in grazing areas and labour shortages. This means not only that less manure will be produced, but also that less forage will be required. For example, if in the hypothetical house-hold either the cow or both oxen were removed, then annual manure production would fall by either 3.7 or 7.3 Mg per year, respectively. These reduc-tions are equivalent to a reduction in N of 9 and 18 kg N per household per year, (9 or 18% of the annual requirement of N from manure). The impact on total feed requirement is much less. The total N requirement of feed is reduced from 167 kg N per household to 138 or 133 kg N if the cow or both of the oxen are removed, respectively.
2. An increase in the application of fertilizer is predicted (NAPP, 1995). Evidence (Pilbeam, un-published) suggests that applications of fertilizer increase the amount of nitrate-N leached from beneath the rooting zone of crops grown on bari land. This leached N is not the recently applied fertilizer, but N derived from the re-mineralization of organic N, which is not taken up by the crop. Clearly, the timing and size of each application is critical if N losses are to be minimized and the efficiency of N use is to be maximized. There is some indication in rice-systems that top-dressed N is used more efficiently than basally-applied N (Subedi et al., 1995). A more efficient use of fertilizer N may mean either that less manure is required or that the storage of nutrients increases. 3. Erosion control mechanisms may be introduced.
Since losses of N through soil erosion are small, these control mechanisms would appear to have little impact on the N budget.
4. According to the few studies that have measured it, the loss of N from FYM may be significant. Im-provements in the management of manure, either during storage, or in its application and incorpora-tion (Subedi et al., 1996) may increase the N con-centration of the manure. If the N in manure in the hypothetical household were increased from 0.3% N for buffalo, cow and ox to 0.5% N, then annual production of N in manure would increase from 61 to 103 kg N. Labour shortages may prevent the
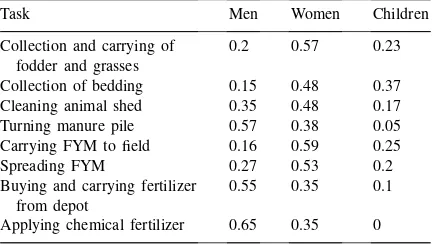
re-Table 6
Normalized contribution of men, women and children to tasks relating to the management of soil fertility in 13 villages in the mid-hills of Nepala
Task Men Women Children
Collection and carrying of 0.2 0.57 0.23 fodder and grasses
Collection of bedding 0.15 0.48 0.37 Cleaning animal shed 0.35 0.48 0.17 Turning manure pile 0.57 0.38 0.05 Carrying FYM to field 0.16 0.59 0.25
Spreading FYM 0.27 0.53 0.2
Buying and carrying fertilizer 0.55 0.35 0.1 from depot
Applying chemical fertilizer 0.65 0.35 0
aSource: Turton et al., 1995.
alization of these large potential benefits. Such in-creases in manure application may mean that less fertilizer is required or that soil fertility increases. 5. Traditionally children have played a significant role
in supporting the women in the collection of animal feed and leaf litter for bedding, and in the carry-ing of manure to the field (Table 6). As more chil-dren attend school, the burden of these tasks will increase for the women. This has a number of im-plications not only for the health of the women and their quality of life, but also for the soil fertility of land, especially that furthest from the household, which is likely to decline if less labour is avail-able for the transportation of manure. If less labour is available for collecting forage and bedding this may ensure that vegetation resources are depleted less rapidly, it may also mean that less bedding is used. Consequently, it is possible that less of the N excreted will be trapped by the bedding mate-rial and incorporated into the manure heap. Thus, more N may be lost gaseously or through leaching beneath the animal stalls.
decrease from 26 to 24.6 kg N, while N inputs in manure decrease from 132 to 110 kg N, which is a saving of approximately 2 Mg manure per year, assuming a N concentration in manure of 1% on a dry weight basis. The balance of N recovery is obviously dominated by maize and finger millet as the proportion of bari-land increases from 2 : 1 to 9 : 1, but the overall recovery of N in crops de-creases by<5 kg N, from 62.5 to 57.7 kg N. The
overall recovery of N in grain for the household decreases from 35.7 to 32.9 kg N, and the recovery of N in straw decreases from 26.8 to 24.8 kg N.
5. Conclusions
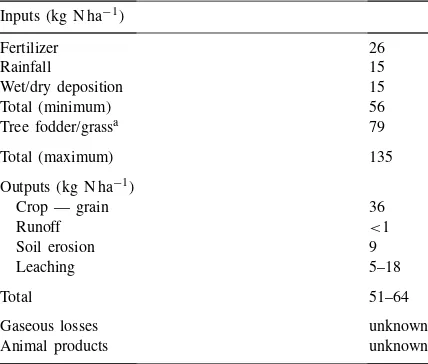
Table 7 summarizes the movements of N across the notional boundaries of a hypothetical household in the mid-hills of Nepal. These are represented by the box in Fig. 1. Excluding N lost as gas, approximately 60 kg N ha−1 is removed from the land owned by a single household, while 56 kg N ha−1are added as fertilizer or rainfall and deposition. Using tree fodder and forage from forest areas and grasses from terrace risers as animal feed ensures that through the manure produced
Table 7
Summary from Fig. 1 of the amounts of N (kg N) moving across the boundaries of a hypothetical household in the mid-hills of Nepal
Inputs (kg N ha−1)
Fertilizer 26
Rainfall 15
Wet/dry deposition 15
Total (minimum) 56
Tree fodder/grassa 79
Total (maximum) 135
Outputs (kg N ha−1)
Crop — grain 36
Runoff <1
Soil erosion 9
Leaching 5–18
Total 51–64
Gaseous losses unknown
Animal products unknown
aProportion from non-agricultural land external to household
boundaries is not known.
there is a net movement of N from non-agricultural land to agricultural land. Schreier et al. (1994) noted that the nutrient content of soils from agricultural land was greater than that of soil under forest. Total N from grass and tree fodder consumed by livestock is approximately 80 kg N. It is not known exactly how much of this comes from vegetation gathered from outside of the boundaries of the household. However, it seems likely that the proportion will decline as the number of fodder trees per household increases, and the number of livestock, particularly large ruminants, decreases.
A major pathway for the flow of N within the sys-tem is through forages fed to livestock and the appli-cation of manure they produce to crops. Apart from the unpublished data of Thorne, there is little quanti-tative data on the composition of livestock feed which is wide ranging. Moreover, little quantitative data ex-ist on the nutrient content of this feed, apart from lab-oratory studies on the chemical composition of some species of fodder trees, notably Ficus. Furthermore, there are few data on the production of manure by different livestock species and its nutrient composi-tion, and while some studies (Subedi et al., 1996) have examined the changes in nutrient composition in re-sponse to storage and handling management practices, there has been no rigorous examination of this. There are no detailed measurements of the amount of N re-moved in animal products (milk, meat and wool). It may be possible that the N content of these exported products matches the N imported in vegetation for fodder. Other significant N flows are those leaving the soil (leaching, volatilization, denitrification, erosion and runoff) but these are poorly quantified, although they are likely to be relatively small. A greater under-standing of these pathways of N loss, and the rela-tive contribution of inputs of fertilizer and manure to them, may enable the development of improved nutri-ent managemnutri-ent practices.
imports N from sources external to itself. At this higher scale (the village or catchment) the system may not be in balance, and because higher levels influence those beneath them, agricultural production at the household level may not be sustainable in the long-term. Never-theless, this N balance does provide a framework for assessing the impact of future changes in agricultural practices and in socio-economic conditions on the sus-tainability of agricultural production in the mid-hills of Nepal.
Acknowledgements
This publication is an output from Project R6757 funded by the UK Department for International De-velopment (DFID) for the benefit of developing coun-tries. The views expressed are not necessarily those of DFID. We thank Dr. P.J. Thorne for making his data available to us.
References
Buresh, R.J., Woodhead, T., Shepherd, K.D., Flordelis, E.V., Cabangon, R.C., 1989. Nitrate accumulation and loss in a mungbean rice cropping system. Soil Sci. Soc. Am. J. 53, 477– 482.
Carson, B., 1992. The land, the farmer and the future: a soil fertility management strategy for Nepal. ICIMOD Occasional Paper No. 21. ICIMOD, Kathmandu, Nepal.
Carter, A.S., Gilmour, D.A., 1989. Increase in tree cover on private farm land in central Nepal. Mountain Res. Develop. 9, 381–391. CBS, 1991. Population Census 1991. Central Bureau of Statistics,
HMG, Nepal.
Collins, R., Jenkins, A., 1996. The impact of agricultural land use on stream chemistry in the middle hills of the Himalayas, Nepal. J. Hydrol. 185, 71–86.
Delobel, T.C., 1986. Farm monitoring at Pumdi Bhumdi, Kaski district Nepal. In: First farming systems working group meeting, 11–13 August 1986, Pokhara, Nepal. HMG Ministry of Agriculture, Department of Agriculture, Farming Systems Research and Development Division, pp. 234–254.
Fonzen, P.F., Oberholzer, E., 1984. Use of multi-purpose trees in hill farming systems in western Nepal. Agrofor. Syst. 2, 187– 197.
Gardner, R., Thapa, K., Tripathi, R., 1995. Soil erosion from overland flow on hillslopes. In: Land Use, Soil Conservation and Water Resource Management in the Nepal Middle Hills, Vol. 1, Chap. 11. ODA/RGS/1H Project, Institute of Hydrology, Wallingford, UK.
Gurung, H.B., Gatenby, R.M., Neopane, S.P., Shrestha, N.P., Chemrong, P.B., 1989. Number of animals on farms in the Koshi
hills. PAC Technical Paper No. 109. Pakhribas Agricultural Centre, Dhankuta, Nepal.
Gurung, G.B., Neupane, R.K., 1991. An estimate of use of farmyard manure (FYM)/compost in field crops in the Koshi hills. PAC Technical Paper No. 23. Pakhribas Agricultural Centre, Dhankuta, Nepal.
Gurung, B.D., Shrestha, M., 1996. Maize varietal research report, 1993. PAC Working Paper No. 124. Pakhribas Agricultural Centre, Dhankuta, Nepal.
Hopkins, N., 1983. The fodder situation in the hills of eastern Nepal. APROSC Occasional Paper No. 2. APROSC, Kathmandu, Nepal.
de Jager, A., Smaling, E.M.A., 1997. New approaches to research and development in Africa: the case of integrated nutrient management. In: Gregory, P.J., Pilbeam, C.J., Walker, S.H. (Eds.), Integrated Nutrient Management on Farmer’s Fields: Approaches That Work. The Department of Soil Science, The University of Reading, Occasional Publication Number 1. The University of Reading, Reading, UK, pp. 55–67.
Jenkins, A., Collins, R., Eatherall, A., Thapa, K., Tripati, R.C., 1995. Modelling nitrogen leaching and soil acidification. In: Land Use, Soil Conservation and Water Resource Management in the Nepal Middle Hills. Vol. 1, Chap. 6. ODA/RGS/1H Project, Institute of Hydrology, Wallingford, UK.
Jodha, N.S., 1990. Mountain agriculture: search for sustainability. ICIMOD, MFS Series No. 2. ICIMOD, Kathmandu, Nepal. Joshi, N.P., Panday, S.B., 1991. Available feed resources and their
contribution in the performance of livestock and poultry in Nepal. In: Central Animal Nutrition division, Khumaltar, Nepal, Annual Technical Report (1990/1991), pp. 73-98.
Katuwal, R.B., Tiwari, T.P., 1997. Millet research report summer 1993. PAC Working Paper No. 128. Pakhribas Agricultural Centre, Dhankuta, Nepal.
Khadka, R.J., Chand, S.P., 1987. The organic materials: a valuable source of soil nutrients in the eastern hills of Nepal. PAC Working Paper No. 12 (Old Series). Pakhribas Agricultural Centre, Dhankuta, Nepal.
Kiff, E., Turton, C., Tuladhar, J.K., Baker, R., 1995. A review of literature relating to soil fertility in the hills of Nepal. NRI/LARC project, Chatham Maritime, UK.
LARC, 1997. Manures and fertilizer recommendations for the western hills of Nepal for different crops. Agricultural Directory 1997/1998. Lumle Agricultural Research Centre, Pokhara, Nepal.
LRMP, 1986a. Land resource mapping project: land utilization report. Kenting Earth Sciences Ltd., Canada.
LRMP, 1986b. Land resource mapping project: Economics report. Kenting Earth Sciences Ltd., Canada.
LRMP, 1986c. Land resource mapping project: Agriculture/ Forestry report. Kenting Earth Sciences Ltd., Canada. NAPP, 1995. Nepal Agriculture Perspective Plan. Main Document.
APROSC, Kathmandu, Nepal and John Mellor Associates Inc., Washington DC.
Nijampurkar, V.N., Sarin, M.M., Rao, D.K., 1993. Chemical composition of snow and ice from Chhota Shigri glacier, Central Himalaya. J. Hydrol. 151, 19–34.
Pandey, S.P., 1996. Sustainable management of soils in rain-fed cropping systems in the mid-hills of Nepal: soil fertility and nutrient management. APROSC, Kathmandu, Nepal. Rana, B.S., Singh, S.P., Singh, R.P., 1989. Biomass and net primary
productivity in central Himalayan forests along an altitudinal gradient. For. Ecol. Manage. 27, 199–218.
Rasali, D.P., Suwal, M.R.S., Vaidya, A.K., Joshi, K.D., 1996. Contribution of livestock to soil fertility management systems in the western mountains of Nepal. In: Joshi, K.D., Vaidya, A.K., Tripathi, B.P., Pound, B. (Eds.), Formulating a strategy for soil fertility research in the hills of Nepal. Lumle Agricultural Research Centre, Pokhara, Nepal and Natural Resources, Institute, Chatham Maritime, UK, pp. 43–50.
Schreier, H., Shah, P.B., Lavkulich, L.M., Brown, S.P., 1994. Maintaining soil fertility under increasing land use pressure in the middle mountains of Nepal. Soil Use Manage. 10, 137– 142.
Sharma, B.P., 1996a. Sustainable management of soils in rainfed cropping systems in the mid-hills of Nepal: main report. APROSC, Kathmandu, Nepal.
Sharma, B.P., 1996b. Sustainable management of soils in rainfed cropping systems in the mid-hills of Nepal: role of livestock, fodder and tree crops. APROSC, Kathmandu, Nepal. Sherchan, D.P., Pilbeam, C.J., Gregory, P.J., 1999. Response of
wheat-rice and maize/millet systems to fertilizer and manure applications in the mid-hills of Nepal. Experimental Agric. 35, 1–13.
Shrestha, R.K., Tiwari, B.N., 1992. Nutritional value and tannin content of some common fodder tree species of the western hills of Nepal. In: Proceedings of the Fourth Meeting of The Working Group on Fodder Trees, Forest Fodder and Leaf Litter. Forest Research Division, Kathmandu, Nepal, pp. 1–5. Singh, B., Singh, V., Khind, C.S., Meelu, O.P., 1991. Leaching
losses of urea-N applied to permeable soils under lowland rice. Fertilizer Res. 28, 179–184.
Smaling, E.M.A., Stoorvogel, J.J., Windmeijer, P.N., 1993. Calculating soil nutrient balances in Africa at different scales II. District scale. Fertilizer Res. 35, 237–250.
Smaling, E.M.A., Fresco, L.O., de Jager, A., 1996. Classifying, monitoring and improving soil nutrient stocks and flows in African agriculture. Ambio 25, 492–496.
Stoorvogel, J.J., Smaling, E.M.A., Janssen, B.H., 1993. Calculating soil nutrient balances in Africa at different scales II. Supra-national scale. Fertilizer Res. 35, 227–235.
Subba, D.B., Tamang, P.M., 1990. Seasonal variation in the chemical composition of the leaves of ficus species fodder trees. In: Proceedings of the Third Meeting of The Working Group on Fodder Trees, Forest Fodder and Leaf Litter. Forest Research and Information Centre, Kathmandu, Nepal, pp. 20–24. Subba, D.B., Tamang, P.M., Rai, L.B., Tamang, B.B., 1994. Notes
on farmers’ knowledge and perception about tree fodders in the eastern hills of Nepal. Vet. Rev. 9, 24–27.
Subedi, K.D., 1993. Search of indigenous green manuring species for rice in the western hills of Nepal. LARC Review Paper No. 93/2. Lumle Agricultural Research Centre, Pokhara, Nepal. Subedi, K.D., 1994. Determination of an optimum combination
of organic and inorganic fertilizer for rainfed wheat and barley 1993/94. LARC Working Paper 94/42. Lumle Agricultural Research Centre, Pokhara, Nepal.
Subedi, K.D., Rana, R.B., Gurung, T.B., Gc, Y.D., 1995. Assessment of major yield limiting factors of normal season rice and soil fertility research on rice under low hill intensive cropping systems. LARC Seminar Paper No. 95/9. Lumle Agricultural Research Centre, Pokhara, Nepal.
Subedi, K.D., Subedi, M., Sthapit, B.R., 1996. Research highlights on composting, compost utilization and in-situ manuring in the western hills of Nepal. In: Joshi, K.D., Vaidya, A.K., Tripathi, B.P., Pound, B. (Eds.), Formulating a strategy for soil fertility research in the hills of Nepal. Lumle Agricultural Research Centre, Pokhara, Nepal and Natural Resources, Institute, Chatham Maritime, UK, pp. 70–78.
Thapa, B., 1989. Farming systems in the middle hills of Nepal. PAC Technical Paper No. 114. Pakhribas Agricultural Centre, Dhankuta, Nepal.
Thapa, B., 1994. Farmers’ ecological knowledge about the management and use of farmland tree fodder resources in the mid-hills of eastern Nepal, Ph.D. Thesis. University of Wales, Bangor.
Thapa, B., Joshi, L., Sherpa, S.L., Wallace, D., 1990. Fodder research and development activities at Pakhribas Agricultural Centre. In: Proceedings of the Third Meeting of the Working Group on Fodder Trees, Forest Fodder and Leaf Litter. Forest Research and Information Centre, Kathmandu, Nepal, pp. 4–10. Tiwari, T.P., Khadka, R.J., Gurung, B.D., 1997. Wheat Research Report 1992/93. PAC Working Paper No. 177. Pakhribas Agricultural Centre, Dhankuta, Nepal.
Tuladhar, J.K., 1995. Fertility status of farmers’ field soil within the extension command area of Lumle Agricultural Research Centre. LARC Working Paper No. 95/47. Lumle Agricultural Research Centre, Pokhara, Nepal.
Turton, C., Vaidya, A., Tuladhar, J.K., Joshi, K.D., 1995. Towards sustainable soil fertility management in the hills of Nepal. NRI/LARC Project, Chatham Maritime, UK.
Vaidya, S.N., 1988. A general report on compost survey conducted at four farming systems research sites. In: Proceedings of the Third Farming Systems Working Group Meeting, Kathmandu, Nepal, 20–22 June 1988. National Agricultural Research and Services Centre, Farming Systems Research and Development, Division, Khumaltar, Nepal, pp. 110–118.
Vaidya, A.K., Gurung, H.B., 1995. Yield estimation and farm management study of wheat in the extension command area (1991/92–1992/93). LARC Working Paper No. 95/23. Lumle Agricultural Research Centre, Pokhara, Kaski, Nepal. Wyatt-Smith, J., 1982. The agricultural systems in the hills of