MANGROVE FOREST COVER EXTRACTION OF THE COASTAL AREAS OF NEGROS
OCCIDENTAL, WESTERN VISAYAS, PHILIPPINES USING LIDAR DATA
A.V. Pada a, J. Silapan b, M. A. Cabanlit a, F. Campomanes a, J. J Garcia a a
University of the Phlippines Cebu Phil-LiDAR 2, Gorordo Avenue, Lahug, Cebu City – (avspada, mcabanlit, enzo.campomanesv, jjsg78)@gmail.com
b
University of the Phlippines Cebu, Gorordo Avenue, Lahug, Cebu City – [email protected]
Commission I, WG I/2
KEY WORDS: Feature Extraction, SVM, Image Processing, Coastal Resources, LIDAR
ABSTRACT:
Mangroves have a lot of economic and ecological advantages which include coastal protection, habitat for wildlife, fisheries and forestry products. Determination of the extent of mangrove patches in the coastal areas of the Philippines is therefore important especially in resource conservation, protection and management. This starts with a well-defined and accurate map. LiDARwas used in the mangrove extraction in the different coastal areas of Negros Occidental in Western Visayas, Philippines. Total coastal study area is 1,082.55 km² for the 14 municipalities/ cities processed. Derivatives that were used in the extraction include, DSM, DTM, Hillshade, Intensity, Number of Returns and PCA. The RGB bands of the Orthographic photographs taken at the same time with the LiDAR data were also used as one of the layers during the processing. NDVI, GRVI and Hillshade using Canny Edge Layer were derived as well to produce an enhanced segmentation. Training and Validation points were collected through field validation and visual inspection using Stratified Random Sampling. The points were then used to feed the Support Vector Machine (SVM) based on tall structures. Only four classes were used, namely, Built-up, Mangroves, Other Trees and Sugarcane. Buffering and contextual editing were incorporated to reclassify the extracted mangroves. Overall accuracy assessment is at 98.73% (KIA of 98.24%) while overall accuracy assessment for Mangroves only is at 98.00%. Using this workflow, mangroves can already be extracted in a large-scale level with acceptable overall accuracy assessments.
1. INTRODUCTION
Mangrove forests are generally found in the coastal waters of tropical and subtropical countries between approximately 30⁰ N and 30⁰ S latitude (Giri et.al., 2011). These productive ecosystems are found in the intertidal zones and are very resilient to harsh environments such as drastic change in temperature, amount of rainfall, salinity and pH, among others. Because of their proliferation in estuarine waters wherein they are sometimes completely submerged in water or where there are saltwater and freshwater sources, they have developed adaptive mechanisms to help them survive in these harsh and sometimes constantly changing environments, such as salt- excreting leaves, presence of pneumatophores (exposed roots for exchange of gases), and production of viviparous propagules (Duke, 1992).
The mangrove forest also produces a number of commercial products, with the trees that have been traditionally used for food, timber, fuel and medicine (Alongi, 2002). Mangroves provide many ecosystem services. It is used as habitat for a variety of faunal organisms like birds, fish, crustaceans, shellfish, reptiles and mammals as well as juveniles of many commercial fish and invertebrates which utilize mangroves as nurseries. (Manson et al. 2005).
However, despite evidence of mangrove’s importance to the coastal environment, including fisheries, deforestation and pollution continues to be a major threat. Conversion and harvest of mangroves eliminates most, if not all, directly marketable products that mangroves provide (Van Beukering, 1997). Because of a combination of natural and anthropogenic factors that has changed the forest cover of mangroves over the years, it
is then imperative to create maps which is an initial step to better manage, conserve and preserve this coastal resource.
However, well-defined and comprehensive maps of mangroves are not available in the municipal/ city or even the provincial level. Maps available in said areas are also not updated. This may be because of a shortage of GIS and Remote Sensing experts in said fields in the area or shortage of funds to hire these experts. Since maps are scarce in the area, this creates a gap in the planning stage for development in Local Government Units (LGUs), National Government Agencies (NGAs), Non- government Organizations (NGOs) and People’s Organizations (POs) that deal with this important coastal resource.
This study thus aims to test a workflow adapted from a study by Peralta et.al. in 2015 and in which mangroves can be correctly extracted from other coastal features but with modifications. Determination of the extent of the mangrove forest cover will be dependent on datasets according to municipal/ city level. This will utilize LiDAR (Light Detection and Ranging) data through Support Vector Machines (SVM), a type of machine learning classification based on the concept of decision planes that define decision boundaries and is usually defined by a separating hyperplane (Vapnik, 1997). LiDAR is a remote sensing technology that measures distance by illuminating a target with a laser and analyzing the reflected light. SVM will be applied to separate mangroves from other tall structures in the coast, especially other flora. However, mangroves that are short in height will not be extracted using this workflow. This includes mangrove species that are shrubs/ferns or mangrove trees that are still juveniles and propagules/ seedlings.
2. MATERIALS AND METHODS
2.1 Sample Site
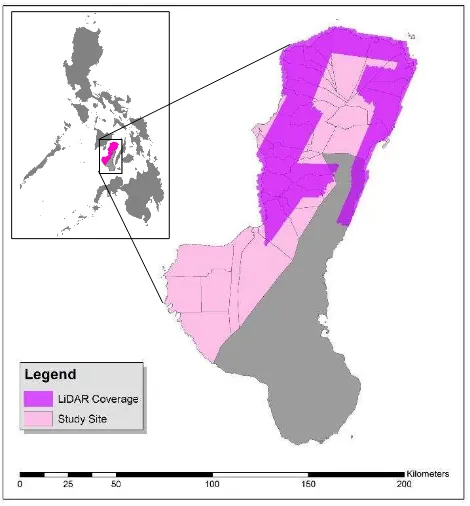
The University of the Philippines Cebu (UP Cebu) Phil-LiDAR 2 is one of the 15 daughter projects of the DOST- funded research work under the Grant-in-Aid Program entitled “Phil -LiDAR 2 Nationwide Detailed Resources Assessment using LiDAR”. Said State University is in-charge of Region VI (Western Visayas). Consequently, the researchers have chosen the municipality of Enrique B. Magalona (E.B. Magalona) (see Figure 1), a third class municipality in Negros Occidental, Western Visayas, Philippines (Provincial Government of Negros Occidental Official website, 2015) as the preliminary study area in which the workflow was applied. This is based on its relative abundance of mangroves according to secondary data. Figure 1 shows the LiDAR data availability to the project. Once the workflow was established, the same method was then used to extract mangrove forests found in the remaining municipalities and cities in Negros Occidental. A total of 14 municipalities/ cities were included in the feature extraction of mangrove forest cover. Some municipalities/cities included in the study may be comprised of two flight blocks which results in a total of 17 outputs for 14 municipalities.
Figure 1. Shows Negros Occidental with its LiDAR data coverage
2.2 Conceptual Basis
Expected tall objects such as man-made structures or trees can be theoretically differentiated from each other using a combination of the orthographic photographs (orthophotos) and different LiDAR data derivatives. This is based on the concept that the RGB bands and laser returns differ from one object to another. If the combination of these parameters can be optimized and segmentation is accurate, then structures can be correctly classified using training and validation points from field data. Also, since mangroves thrive in a specific range of conditions such as climate, temperature, salinity, pH and rainfall
among others, areas where they can be extracted can be narrowed down.
2.3 Pre-processing
LiDAR data used in this study has been pre-processed by the UP Training Center for Applied Geodesy and Photogrammetry (UP-TCAGP) under the Disaster Risk and Exposure Assessment for Mitigation (DREAM) Program (UP-TCAGP, 2013).
2.4 Main Processing
2.4.1 Sampling: Points were collected using stratified random sampling. The total area was divided into square grids. Using a random number generator, training and validation points were collected via field validation and supplemented with points collected via visual interpretation with the orthophoto and CHM as reference. As seen in Figure 2, 241 training points were collected for the E.B. Magalona dataset. This was used in determining the initial classification while 51 points were collected as validation points to be used in accuracy assessment. Points were collected on tall structures only because the study focuses only on tall structures. These were the structures with a mean CHM of equal or greater than 1. Four classes were then determined namely, built-up, other trees, grand or harvestable sugarcane, and Mangroves.
2.4.2 Software Used and Layers Derived: Data processing in mangrove extraction was done using LiDAR data derivatives, namely CHM (canopy height model), DSM (digital surface model), DTM (digital terrain model), hillshade, intensity, number of returns and a 3 band raster resulting from principal component analysis (PCA). Orthophotos which were taken together with the LiDAR data were also used as one of the layers for processing in eCognition using its RGB bands. The derivatives and the orthophotos were clipped using a 3-km buffer from the shore and a 500 meter buffer from the centerline of the rivers. This constituted the total study area with possible mangrove forests. Total study area was 1,082.55 square kilometres.
2.4.3 Decision Tree: From the LiDAR derivatives, areas with number of returns greater than or equal to 0 were considered as areas with data while areas with number of returns less than 0 were considered as no data. These are the areas with no laser pulse returns such as deep water bodies like rivers, streams and oceans. Areas with data were then separated into land and water using DTM. DTM values which are lesser or equal to 62.5 were classified as water while Mean DTM values greater than 62.5 were classified as Land. Other land features such as fishponds, saltbeds and marshland were re-classified as water since taking into consideration the mean sea level (MSL), these areas were submerged during high tide. Values used for refining land features into water features included mean intensity which is lesser than or equal to 13.57 and CHM which is lesser or equal to 0.04. The thresholds used were based on visual inspection of the different LiDAR derivatives present.
These newly reclassified areas helped in the identification of possible Mangrove areas since most abandoned fishponds or saltbeds are optimum venues for growth of wildlings and/or propagules that are carried by the tide or reforestation effort sites for the Department of Environment and Natural Resources (DENR) and other national government agencies (NGAs) or non-government organizations (NGOs) in the Philippines (Primavera, 2012).
Remaining features for land was then divided into tall and short structures using values for mean CHM. Land features with a mean CHM which is greater or equal to 1 are further classified into tall Structures while land features with a Mean CHM of less than 1 are classified into short structures. short structures were further classified into soil or silt using mean intensity greater than 13.57 while short vegetation such as grassland or agricultural crops (e.g. rice, vegetables or newly planted sugarcane) are those that have a mean intensity of lesser than or equal 13.57. Other tall structures such as built-up, sugarcane and other trees are the additional classes used during SVM as seen in Figure 2.
Figure 2. Shows the Decision Tree used in the extraction of Mangroves in this study
2.4.4 Image Processing
2.4.4.1 Segmentation: Proper segmentation is crucial in Object-Based Image Analysis (OBIA) since final classification is largely dependent on spatial properties like scale, size and form. Normalized difference vegetation index (NDVI), green-red vegetation index (GRVI) and hillshade using canny edge layer were then derived to be used in segmentation to produce a better result. During segmentation, parameters that were used were 15 for scale, 0.3 for shape and 0.8 for compactness. A sample of the segmented and classified image is seen in Figure 3.
Figure 3. Shows the orthophoto after segmentation
2.4.4.2 Support Vector Machine Classification (SVM): SVM was used to determine the different classification based on collected training and validation samples. Features used in training the samples are shown in Table 1.
Measure Layer
Mean and Standard Deviation Red Green Blue CHM DSM DTM GRVI HS (hillshade) Intensity
Number of returns Band 1 of PCA output Band 2 of PCA output Band 3 of PCA output
GLCM Homogeneity GLCM Entropy GLCM Ang. 2nd moment GLCM Standard deviation
Red Green GRVI Intensity CHM
Features used in training the samples for the SVM is mainly based on the mean and standard deviation values of the derivatives used as well as their textures.
An SVM utilizing a radial basis function (RBF) kernel function was trained with a C or cost parameter of 1000 and gamma of 0. This is to lower bias and ensure that the cost of misclassification is penalized more.
3. RESULTS AND DISCUSSION
3.1 Resulting Map
Once Mangroves were extracted, they were inspected if they were correctly classified. This was done through buffering and contextual editing. Final mangrove candidates with a mean DTM value of lesser than 63.3 were removed to mask out objects classified as mangroves which are already located in high elevations or in steep slopes. These were reclassified as other trees. Contextual editing was done using neighbourhood metrics to correctly classify additional features. Lastly, another overall accuracy assessment was done after contextual editing. Map with the final classification is seen in Figure 5.
Figure 5. The final classified image of Victorias City, Negros Occidental. Final classes include Water, No Data, Short Vegetation, Fallow, Sugarcane (SC3), Other Trees (OTr),
Built-up (Bu) and Mangroves (Mgr)
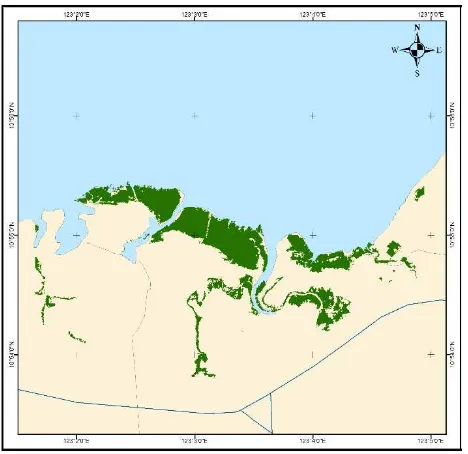
During editing, orthophotos and exported shapefiles were viewed to check for accuracy. Manual classification was done to reclassify dead mangroves as water since they are classified as built-up. Also, manual classification was done in the edges of mangroves patches that were classified as built-up due to shadows affecting the classification. The same was done in the borders of the data where heavy triangulation is common. The resulting map of the mangrove extraction in one of the processed coastal area of the municipalities/ cities of Negros Occidental is seen in Figure 6.
Figure 6. Shows the Mangrove Map of Victorias City
Another feature which increased the error is the absence of Orthophotos in some areas. This is because one of the weights and training feature of SVM includes the R, G and B bands of the orthophoto. This limited the extraction of the Mangroves since segmentation proved to be poor in these areas. These erroneously classified objects were again manually classified.
However, manual classification was done at a minimum since there was no orthophoto for verification or no field validation was done for that specific object, it was hard to edit the misclassified objects and only visual inspection was used.
3.2 Accuracy Assessment
An example of the confusion matrix using datasets for EB Magalona is seen in Figure . Overall accuracy assessment directly after SVM is at 92.10% with a Kappa Index of Agreement (KIA) of 89.30% as shown below in Table 1. However, Producer Accuracy for Mangroves is only at 87.80% while User Accuracy is at 92.70%. This is because, out of the 37,297 mangrove objects, only 32,757 objects were correctly classified. On the other hand, 4,540 objects were misclassified as Other Trees. After contextual editing, only 1,428 of these objects were misclassified as shown in Table 2. Overall accuracy assessment is at 97.06% with a KIA of 95.98%.
Table 1. Shows accuracy assessment directly after SVM
Table 2. Shows accuracy assessment after contextual editing
3.3 Testing of Workflow to other Municipality/ City
Other municipalities and cities were also tested using the same workflow and algorithm. They were processed based on the flight data blocks from UP-TCAGP. This is the reason why
Confusion Matrix
User/ Reference Bu SC3 Mgr OTr Sum
Bu 21395 0 0 0 21395
SC3 0 20513 0 0 20513
Mgr 0 1192 35869 326 37387
OTr 0 0 1428 19685 21113
unclassified 0 0 0 0 0
Sum 21395 21705 37297 20011
Accuracy
Producer 1 0.945 0.961 0.9837
User 1 1 0.959 0.9324
Hellden 1 0.972 0.96 0.9574
Short 1 0.945 0.924 0.918
KIA Per Class 1 0.931 0.939 0.9793
Total Overall Accuracy
0.9706597
KIA 0.9598197
Confusion Matrix
User/ Reference Bu SC3 Mgr OTr Sum
Bu 20003 0 0 0 20003
SC3 0 20513 0 0 20513
Mgr 628 1192 32757 772 35349
OTr 764 0 4540 19239 24543
unclassified 0 0 0 0 0
Sum 21395 21705 37297 20011
Accuracy
Producer 0.935 0.945 0.878 0.9614
User 1 1 0.927 0.7839
Hellden 0.966 0.972 0.902 0.8636
Short 0.935 0.945 0.821 0.76
KIA Per Class 0.919 0.931 0.812 0.949
Total Overall Accuracy
0.921
KIA 0.893
some municipalities or cities in this study was processed twice and 1.60% for accuracy and KIA, while accuracy for mangroves alone is at 98.00% with a standard deviation of 2.31%.
Lower overall accuracies in other municipality or city blocks may be attributed to the absence of orthophotos in some areas of the data. However, these areas were still processed without the use of its RGB bands. According to a study by Huang and Chen in 2007, aerial images coupled with LiDAR data or double-threshold strategy in image processing, improves the overall accuracy from 93.1% to 95.90%.
Figure 7. Shows graph of mangrove overall accuracy assessment for Victorias City, E.B. Magalona, Cadiz City
and Manapla
Figure 8. Shows graph of mangrove overall accuracy assessment for Sagay City, Silay City, Talisay City,
Calatrava, and Escalante City
Figure 9. Shows graph of mangrove overall accuracy assessment for Toboso, Pontevedra, San Carlos City, San
Enrique, and Bacolod City
The graphs of the different overall accuracy assessments, kappa coefficients and accuracy for mangroves only are seen in Figures 7 to 9. Results indicate that the workflow used in this study is already comparable with other reported classification accuracies of mangroves using traditional data and techniques, which ranged from 75% to 90% for producer’s and user’s accuracy according to a paper by Heumann in 2011, although according to the author, many applied studies do not include detailed accuracy assessments. A study by Newton et al., in 2009 said that exclusion of accuracy assessments in other studies is due to a disconnect between remote sensing and other disciplines.
This study only extracts mangrove trees in the coastal area of a municipality or city. A workflow or algorithm which extracts mangrove species that are ferns (eg Acrostichum speciosum) or mangrove seedlings will be beneficial in the LGU’s mapping. This is because newly reforested areas or areas where these species are dominant will not be included in the total mangrove area. Further studies also include experimenting on other LiDAR derivatives to improve classification and segmentation. Lastly, studies may be conducted to determine the minimum percentage of orthophoto used in processing that can still achieve high accuracies in extracting mangroves.
4. CONCLUSION
Mangroves can be extracted from tall coastal structures using SVM at an overall accuracy of 96.59% with a KIA of 94.98%. Accuracy assessment for Mangroves only is at 93.54%. Contextual editing of the classified objects further raises the overall accuracy assessment to 98.73% with a KIA of 98.24%. Final accuracy assessment for Mangroves only is at 98.00%. Consequently, using this workflow, mangroves can already be extracted in a large-scale or municipal or city level with acceptable overall accuracy assessments.
ACKNOWLEDGEMENTS
The researchers would like to thank the Department of Science and Technology (DOST) as the funding agency and the Philippine Council for Industry, Energy and Emerging Technology Research and Development (DOST-PCIEERD) as the monitoring agency. This research would not have been possible if not for the invaluable contribution of the rest of the UP Cebu Phil- LiDAR 2 Team and the 5 program components from UP Diliman: PARMap, CoastMap, REMap, PHD and
Toboso Pontevedra San Carlos San Enrique Bacolod Accuracy KIA Accuracy for Mgr Only
heartfelt-gratitude to the administrators, faculty and staff of UP Cebu.
REFERENCES
Alongi, D.M., (2002) Present state and future of the world’s mangrove forests. Environmental Conservation 29:331-349
Duke, N.C., 1992. Mangrove floristics and biogeography. In: Robertson, A.I. and Alongi, D.M. (eds.), Tropical Mangrove Ecosystems, Coastal Estuarine Studies. Washington, D.C.: American Geophysical Union, pp. 63–100.
Giri, C.; Ochieng, E.; Tieszen, L.L.; Zhu, Z.; Singh, A.; Loveland, T.;Masek, J., and Duke, N., 2011. Status and distribution of mangrove forests of the world using Earth observation satellite data. Global Ecology and Biogeography, 20(1), pp. 1.
Heumann, B.W., 2011. Satellite Remote Sensing of Mangrove Forests: Recent advances and future opportunities. Progress in Physical Geography. 35(I), p. 90.
Manson, F.J., Loneragan, N.R., Skilleter, G.A. and Phinn, S.R., (2005) An evaluation of the evidence for linkages between mangroves and fisheries: a synthesis of the literature and identification of research directions. Oceanography and Marine Biology: An Annual Review 43:485-515
Municipality of E.B. Magalona, 2015. Retrieved August 22, 2015 from http://www.negros-occ.gov.ph/about-negros-
occidental/cities-and-municipalities/municipalities/municipality-of-e-b-magalona.
Peralta, R.V., Jalbuena, R.L., Cruz, C.A., Tamondong, A.M. (2015, 18-31 July). Development of an Object-based Classification Technique for Extraction of Aquaculture Features using LiDAR and Worldview-2 Satellite Image Data. Paper presented at the 13th South East Asian Survey Congress: Expanding the Geospatial Future, Singapore. Retrieved August 29, 2015 from www.seasc2015.org
Primavera, J.H, Savaris, J.P., Bajoyo, B.E., Coching, J.D., Curnick, D.J., Golbeque, R.L., Guzman, A.T., Henderin, J.Q., Joven, R.V., Loma, R.A., Koldewey, H.J., 2012. Manual on Community-based Mangrove Rehabilitation. Mangrove Manual Series No.1. pp. 22-23
Report on LiDAR Data Acquisition and Data Processing in the Cagayan de Oro and Iponan Floodplain, Disaster Risk and Exposure Assessment for Mitigation (DREAM), DOST-Grant-In-Aid Program, pp. 47
Van Beukering, P. and Spaninks, F., 1997. Economic Valuation of Mangrove Ecosystems: Potential and Limitations. CREED Working Paper No 14. pp. 32-33
Vapnik, V., S.E. Golowich and Smola, A. 1997 Support Vector Method for Function Approximation, Regression Estimation, and Signal Processing. Advances in Neural Information Processing Systems 9. pp. 155-161
APPENDIX A
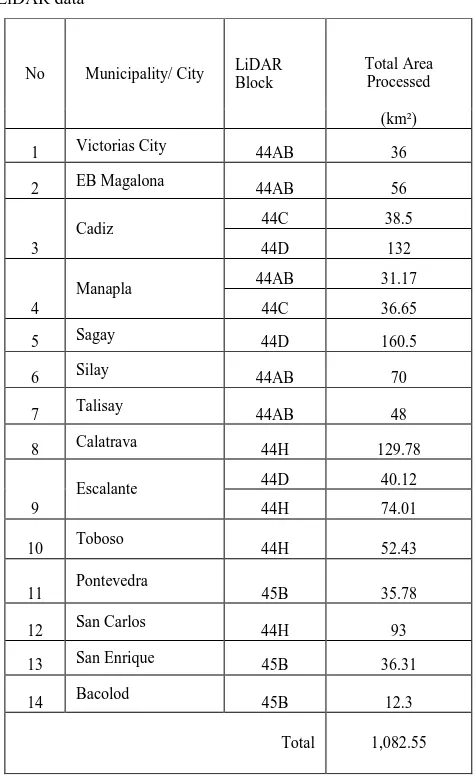
Table 3. Comparative Summary of the Accuracy Assessments of the coastal municipalities/ cities of Negros Occidental with LiDAR data
No Municipality/ City LiDAR Block Total Area Processed
(km²)
1 Victorias City 44AB 36
2 EB Magalona 44AB 56
3
Cadiz 44C 38.5
44D 132
4
Manapla 44AB 31.17
44C 36.65
5 Sagay 44D 160.5
6 Silay 44AB 70
7 Talisay 44AB 48
8 Calatrava 44H 129.78
9
Escalante 44D 40.12
44H 74.01
10 Toboso 44H 52.43
11 Pontevedra 45B 35.78
12 San Carlos 44H 93
13 San Enrique 45B 36.31
14 Bacolod 45B 12.3
Total 1,082.55
APPENDIX B
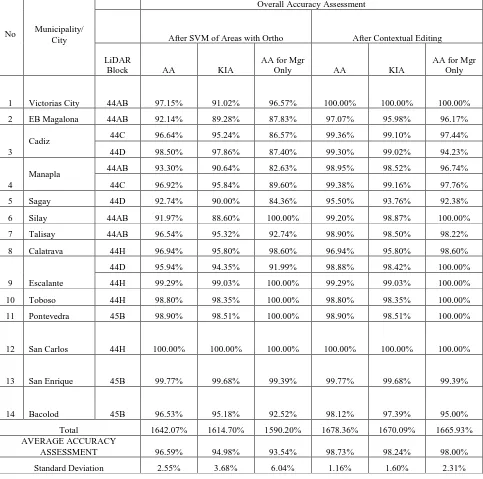
No Municipality/ City
Overall Accuracy Assessment
After SVM of Areas with Ortho After Contextual Editing
LiDAR
Block AA KIA
AA for Mgr
Only AA KIA
AA for Mgr Only
1 Victorias City 44AB 97.15% 91.02% 96.57% 100.00% 100.00% 100.00%
2 EB Magalona 44AB 92.14% 89.28% 87.83% 97.07% 95.98% 96.17%
3
Cadiz 44C 96.64% 95.24% 86.57% 99.36% 99.10% 97.44%
44D 98.50% 97.86% 87.40% 99.30% 99.02% 94.23%
4
Manapla 44AB 93.30% 90.64% 82.63% 98.95% 98.52% 96.74%
44C 96.92% 95.84% 89.60% 99.38% 99.16% 97.76%
5 Sagay 44D 92.74% 90.00% 84.36% 95.50% 93.76% 92.38%
6 Silay 44AB 91.97% 88.60% 100.00% 99.20% 98.87% 100.00%
7 Talisay 44AB 96.54% 95.32% 92.74% 98.90% 98.50% 98.22%
8 Calatrava 44H 96.94% 95.80% 98.60% 96.94% 95.80% 98.60%
9 Escalante
44D 95.94% 94.35% 91.99% 98.88% 98.42% 100.00%
44H 99.29% 99.03% 100.00% 99.29% 99.03% 100.00%
10 Toboso 44H 98.80% 98.35% 100.00% 98.80% 98.35% 100.00%
11 Pontevedra 45B 98.90% 98.51% 100.00% 98.90% 98.51% 100.00%
12 San Carlos 44H 100.00% 100.00% 100.00% 100.00% 100.00% 100.00%
13 San Enrique 45B 99.77% 99.68% 99.39% 99.77% 99.68% 99.39%
14 Bacolod 45B 96.53% 95.18% 92.52% 98.12% 97.39% 95.00%
Total 1642.07% 1614.70% 1590.20% 1678.36% 1670.09% 1665.93%
AVERAGE ACCURACY
ASSESSMENT 96.59% 94.98% 93.54% 98.73% 98.24% 98.00%
Standard Deviation 2.55% 3.68% 6.04% 1.16% 1.60% 2.31%
Table 4 Comparative Summary of the Accuracy Assessments of the coastal municipalities/ cities of Negros Occidental with LiDAR data