POLE-LIKE STREET FURNITURE DECOMPOSTION IN MOBILE LASER SCANNING
DATA
F. Li a, *, S. Oude Elberink a, G. Vosselman a
a Faculty of Geo-Information Science and Earth Observation, University of Twente, Netherlands - (f.li, s.j.oudeelberink, george.vosselman)@utwente.nl
Commission III, WG III/2
KEY WORDS: Street Furniture Decomposition, 2D Point Density, RANSAC, Slice Cutting, Mobile Laser Scanning, Point cloud
ABSTRACT:
Automatic semantic interpretation of street furniture has become a popular topic in recent years. Current studies detect street furniture as connected components of points above the street level. Street furniture classification based on properties of such components suffers from large intra class variability of shapes and cannot deal with mixed classes like traffic signs attached to light poles. In this paper, we focus on the decomposition of point clouds of pole-like street furniture. A novel street furniture decomposition method is proposed, which consists of three steps: (i) acquirement of prior-knowledge, (ii) pole extraction, (iii) components separation. For the pole extraction, a novel global pole extraction approach is proposed to handle 3 different cases of street furniture. In the evaluation of results, which involves the decomposition of 27 different instances of street furniture, we demonstrate that our method decomposes mixed classes street furniture into poles and different components with respect to different functionalities.
* Corresponding author
1. INTRODUCTION
The automatic recognition of street furniture in 3D point clouds has become a hot issue in photogrammetry, computer vision and remote sensing. In the past few years, street furniture recognition can be categorized into urban objects detection (Lehtomäki et al., 2010; Brenner, 2009; El-Halawany and Lichti, 2011) and classification (Pu et al., 2011; Golovinskiy et al., 2009; Weinmann et al., 2014). Both of these two research topics deal with the complexity of 3D urban scenes and point cloud segmentation. They can be used for street furniture inventory and maintenance, automatic driving systems and intelligent transportation systems.
Much research has been carried out on 3D point cloud segmentation. Different techniques for segmentation of smooth planes, the extraction of planar surfaces and the recognition of specific shapes in point clouds are reviewed by Vosselman et al. (2004). Schnabel et al. (2007) propose an automatic algorithm that detects basic shapes in 3D point clouds based on RANSAC and normal estimation. Smoothness constraint and normal vector direction are used to segment point clouds into different parts (Rabbani et al., 2006; Nurunnabi et al., 2012). Vosselman (2013) combines several segmentation and post-processing methods to segment point clouds of urban environments. For coloured point clouds, a graph-based method is presented to segment 3D laser point clouds into different components by using their surface normal (Strom et al., 2010). Dimensionality features of optimized neighbourhood size is used to segment 3D point clouds (Demantke et al., 2011). Golovinskiy and Funkhouser (2009) present a min-cut based method to segment point clouds into components which represent different types of objects. A shape-based method is proposed to segment mobile
laser scanning (MLS) point clouds into a meaningful geometrical abstraction (Yang and Dong, 2013).
Progress has been made on street furniture detection. The method of Brenner (2009) represents an early work on using local scatter matrix and 3D cylinder stack to detect pole-like objects in MLS data. Lehtomäki et al. (2010) propose an algorithm to detect vertical-pole objects by using scan line segmentation. Point cloud is projected to horizontal plane, pole-like street furniture is extracted based on 2D point density (El-Halawany and Lichti, 2013) and vertical point discontinuity (Liberge et al., 2010). Yokoyama et al. (2011) recognize pole-like objects by using smoothing and principle component analysis. The detection rate of this method is 63.9% and the accuracy is 97.4%. Ishikawa et al. (2013) use SVM and extracted features to recognize the road furniture objects with an accuracy of 96.6% in 3D mapping data. Cabo et al. (2014) propose a voxel-based algorithm to detect pole-like street furniture objects in MLS data. A user-assisted method is proposed to detect street furniture such as individual trees and lamp posts (Oude Elberink and Kemboi, 2014).
different categories (Aijazi et al., 2013). Yang et al. (2015) combine this with a hierarchical strategy to classify urban objects in MLS data. Bremer et al. (2013) use a graph-based method with eigenvalues and multi-scale features to separate urban objects into different categories. SVM is used to train geometrical and contextual features to classify urban objects from 3D point clouds (Serna and Marcotegui, 2014). Combining slicing, clustering and region growing, Huang and You (2015) propose an SVM-based method to classify street furniture into 4 categories. By using a library of template point clouds and feature matching, Yu et al. (2015) develop an approach to extract urban road facilities and classify them into different classes. Based on trained features of subsets of street furniture, Fukano and Musuda (2015) propose a supervised machine learning method to classify street furniture into different types.
Current researches mainly focus on segmentation, street furniture detection and classification. However, earlier segmentation can only segment point cloud into small patches, generic detection and classification recognize classes of street furniture rather than describe the composition of street furniture. They do not take the meaning of components into account. For example, mixed classes of street furniture can be labelled based on their functionalities like street sign attached to street light. For this reason, approaches with generic segmentation, detection and classification are restricted. For better understanding of street furniture, decomposition needs to be investigated. This paper combines basic segmentation methods with feature constraints to decompose street furniture into meaningful parts. The result of this paper is that points on individual poles have been grouped into one component, and points are grouped for each attached objects such as traffic signs and traffic lights. The assumption is that street furniture is already detected in a previous step.
The remainder of paper is organized as follows. In Section 2, the framework of our proposed method for street furniture decomposition is explained and detailed information of every stage is given. In Section 3, we describe two mobile laser scanning datasets, test our method and evaluate the accuracy. In Section 4, the advantages and shortages of the proposed method are analysed in accordance to the experimental result. Finally, the conclusion is drawn and suggestions for our future work are outlined.
2. METHODOLOGY
In this paper, street furniture decomposition mainly consists of pole extraction and connected components analysis. Poles are
Pole Extraction (Three methods) Section 2.2
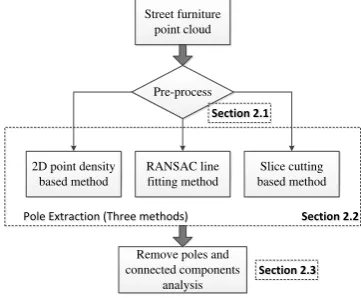
Figure 1. Street furniture decomposition
extracted based on their high point density and line fitting. There is a wide range of thickness, attachments and orientation of poles. For this reason, first the overall structure of the component is analysed in a pre-processing step in order to select the best out of three alternative methods to detect the poles, followed by a connected component algorithm to group points on the attached structures, see Figure 1.
2.1 Pre-processing
The assumption is that before pre-processing the street furniture is already detected in a previous step. The input data is connected components above the street level. In order to make the decision for the selection of the most suitable pole extraction method, at the first stage, street furniture is pre-processed to get pre-knowledge such as the height and the width. To understand the structure of the street furniture, the component is cut into slices. The width and the number of points is computed for every slice. The height, the maximum distance in XY direction and the number of poles can now be determined. The number of poles can be computed by cutting a slice of street furniture and counting the number of its components. When the maximum distance in XY direction is large (the threshold is 6.0m), horizontal poles should be included in the street furniture. Based on this information, the pole extraction method will be decided in the next step.
2.2 Pole Extraction
In general, pole-like street furniture consists of main poles and other components. These poles are the main link to other components. If the main poles of street furniture are removed, other components will be separated into different parts. At this stage, main poles of street furniture are extracted.
Based on properties of street furniture, pole extraction method is selected, as shown in Figure 2.
When there are two or more vertical poles, poles are extracted by 2D point density based method. Another case is that when there are components attached to more than half of the height of the pole, 2D point density based method is utilized.
When there are vertical and horizontal poles, RANSAC line fitting method is used to extract poles.
For the rest of cases, the slice cutting based method is used to extract main poles.
Number of pole > 1?
Many attachments?
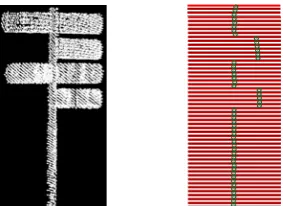
2.2.1 2D Point-Density Based Method: When the pole is vertical, 2D point density of the pole is much higher than other parts when street furniture is projected onto the XY plane, as shown in Figure 3. Based on this property, 2D point density based method is proposed. This method can be described in two steps, as shown in Figure 4.
Figure 3. 2D point density of street sign
Region growing and extract pole from street furniture point
cloud Calculate 2D point density for
point cloud
Figure 4. The work flow of 2D point density based method
To compute 2D point density, the street furniture point cloud is projected onto XY plane. Before computing the number of neighbouring points, the 2D distance for searching neighbouring points has to be defined. The 2D distance for searching neighbouring points is obtained by cutting street furniture point cloud into slices and calculating their widths. After that, the number of neighbouring points is calculated by counting the number of points within this circle (as shown in Figure 5a). The number of 2D neighbouring points around the point is its 2D point density value.
Concretely, in the pre-processing stage, the median width wmedian of all the cutting slices can be calculated. Then street furniture point cloud is projected onto the XY plane. Based on the distance for searching 2D neighbouring points dist_neigh_2d (equal to wmedian), 2D point density point_density is calculated for every point.
After obtaining the point density for the point cloud, region growing is constrained by one attribute of points, 2D point density. By region growing, high 2D point density points are extracted and selected as the points of pole.
Specifically, select the point which has the highest 2D point density value as the seed point. Then compare the 2D point density between the seed point and its neighbouring points. In this paper, nearest neighbouring points are defined by 2D distance. If the 2D point density of the seed point’s neighbouring point is more than 85% of the seed point, this neighbouring point will be categorized as a seed point. This procedure is repeated until all the seed points are found, as shown in Figure 5b. These high 2D point density points are labelled as the pole. After that dist_neigh_2d is used to restrict the region of growing and refine the extracted pole. The extracted pole of a street sign is as shown in Figure 6.
a. Neighbouring points of point p b. Seed growing Figure 5. Region growing
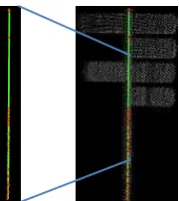
Figure 6. The left one is the original point cloud, the right one is the main pole extracted (green points)
2.2.2 RANSAC Line Fitting Method: When there are not many attachments connected with main poles, pole-like street furniture objects have main poles which can be approximated by lines. Based on this, we propose the RANSAC line fitting method to extract both vertical and horizontal poles, which includes three stages.
Geometric features consist of linear, planar and volumetric features. When the neighbourhood size is large, pole points have high linearity feature value.
In order to extract these points with high linearity values, geometric features are calculated for every point by using eigenvalues. Eigenvalues are computed with every point neighbourhood. In this paper, linear, planar and volumetric features are defined as:
orthogonal system of eigenvectors,
P
G is the geometric feature of the point (Yang et al., 2015)linear points and excluding sign points by Equations 1 and 2. Simultaneously, a large neighbourhood size n_large is used for eliminating short pole points. Here linear points are points with high linearity values. If both points have larger linearity values in both neighbourhood sizes, these points are labelled as linear points. Linear points extraction is shown in Figure 7.
Figure 7. Linear points extraction( the left figure is original point cloud, the right one shows linear points)
As linear points are the main component of these points extracted from the previous step and there are not many lines with these points, RANSAC algorithm can be utilized for extracting lines from these points. With only RANSAC algorithm, some incorrect line extraction can happen. Therefore some other constraints are added. In general, street furniture has long poles. In this paper, the length of poles must be over a threshold length_pole.
After all the linear points are extracted, we use line fitting (RANSAC) and constraint features to fit the pole and find the main pole points. Once the line is found in the point cloud, points around this line are deleted. This step is iterated until no line can be found in the point cloud. An example of extracted lines is shown in Figure 8. The left figure shows points with high linearity, and the right one shows extracted lines.
Figure 8. Extracted lines using RANSAC
In order to extract pole points from street furniture point cloud, a width is proposed to be with the extracted line to capture those points around the line. In this step, distances between the extracted line and its surrounding points are calculated. If the distance is smaller than the width threshold of this line diameter_line, this point will be labelled as a point of the pole. An example of extracted poles is shown in Figure 9. The left figure shows extracted line and the right one shows extracted poles of street furniture.
Figure 9. Extracted poles of street furniture
2.2.3 Slice Cutting Based Method: For both vertical and slanted pole-like street furniture especially thick poles that the two previous methods cannot extract, centre points of these poles can be fitted by straight lines. According to this rule, a four-step method is proposed to decompose pole-like street furniture.
Firstly, in the pre-processing step, the width of every slice of street furniture has been computed. For every slice, its centre point is calculated, as shown in Figure 10. After that, a set of width values W={width1, width1, … , widthn} and centre points
P_CENTRE={P1, P2, … , Pn } can be generated.
Figure 10. Cut street furniture into slices and get their centre points (green points)
For width values W={width1, width1, … , widthn}, there are some large changes between widths because of attached components such as street signs. In this step, these widths with large changes will be detected according to their neighbouring widths and median width value. From the bottom slice of street furniture, the width of every slice should not be much higher than the previous one or the median value. If the change is higher than 0.05m, the width of this slice will be changed to the smaller width value of previous slice. Based on this, width of every slice is smoothed, as shown in Figure 11. The blue bins are the original width of every slice, and the red bins are the width of every slice after refining. The red bins are the buffer widths used to extract pole points with centre line.
Figure 11. The width of every slice before (blue) and after refining (red)
Figure 12. The extracted centre points and the centre line of street furniture
In order to extract poles from street furniture, all the extracted lines are given widths. Specifically, use every slice and its respective refined width in the extracted line to capture those points around the line. In this step, calculate distances between the extracted line and its surrounding points. If the distance is smaller than the width threshold of the respective slice diameter_slice, this point will be labelled as a point of the pole. The extracted pole is shown in Figure 13.
Figure 13. The extracted pole of street furniture
2.3 Connected Component Analysis
After all the pole points are extracted, street furniture is decomposed into poles and components attached to poles. At this stage, extracted poles are removed from street furniture point cloud. Then the connected component analysis is applied to the rest of points. By doing so, street furniture point cloud can be decomposed into the main poles and different components. Since components may be close to each other, the neighbourhood size and the maximum distance for connection analysis should be considered carefully. Considering the distance between scanlines and points distribution on single scanline, the neighbourhood size cannot be too small. Otherwise points on different scanlines cannot be connected. The maximum distance between two scanlines here is 0.05m. For a point, the number of its neighbouring points is 10 within the distance of 0.05m in a single scanline. Here we set the maximum for connected components to 0.15m, and the neighbourhood size to 15. Examples of street furniture decomposition of each pole extraction method are shown in Figure 14. From the left to right, the figure is 2D point density method, RANSAC line fitting method and slice cutting method respectively.
Figure 14. The result of street furniture decomposition
3. EXPERIMENTAL RESULTS
The performance of the proposed method is demonstrated on two mobile laser scanning datasets. The datasets and the outline of experiments are described in Section 3.1 and 3.2 respectively. Results and evaluation are described in Section 3.3.
3.1 Datasets
For the experiment, two datasets were chosen as the test data. The first dataset is captured in a medium sized city by Optech LYNX system which consists of two rotating laser scanners at the back of the moving vehicle. These two laser scanners are in two almost vertical planes, perpendicular to each other and form 45 degrees with the driving direction. The main area of this dataset is the urban area of Enschede which covers about 5 kilometers. In this dataset, there a wide range of pole-like street furniture which can be tested with the proposed algorithm. In the following test, Enschede dataset includes street furniture instances from 2 to 7 and from 9 to 19.
Another one is an open benchmark mobile laser scanning data captured in Paris, by Stereopolis II system which consists of two rotating laser scanners at left and right side of vehicle and one laser scanner at the top of the vehicle (IGN, 2013). The main area of this dataset is the urban area of Pairs, which covers about 5 kilometres. Many different types of pole-like street furniture have been obtained from this dataset for testing (street furniture instance 1, 8 and from 20 to 27).
3.2 Experiments
For the experiments, three groups of parameters are explained for the respective pole extraction method. The first one is 2D point-density based method. There are two important parameters for this method. These two parameters directly affect the number of extracted pole points and its accuracy.
• 2D neighbouring distance and the constraint radius of pole is defined by the median width of the cut slice. It affects point density calculation and pole extraction.
• 2D point density similarity is defined as the 2D point density difference between the seed points and its neighbouring points. Here the similarity threshold of their ratio is 0.85.
In the RANSAC line fitting method, three parameters are significant for decomposition.
• The smaller neighbourhood size is defined by the maximum neighbourhood size of main pole points beginning to have high linearity values. The larger neighbourhood size should be larger than the maximum neighbourhood size of short pole points beginning to have high planarity or volumetric values, and it should be also smaller than the maximum neighbourhood size of main pole points beginning to have high planarity or volumetric values. Here the smaller neighbourhood size is 100, and the large neighbourhood size is 300.
• The distance between extracted line and pole point candidates for pole fitting is defined based on the median value of widths of all cut slices. This parameter directly affects the accuracy of extracted pole. That’s why we calculate this per object.
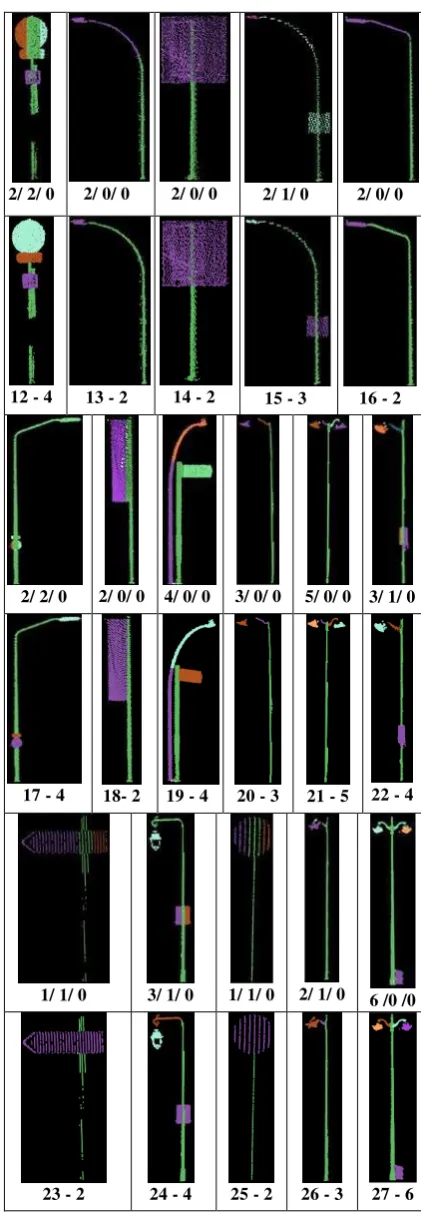
Table 1 The result of street furniture decomposition
Result (correct/ over-/
under- decomposition)
5/ 1/ 2 4/ 1/ 0 4/ 1/ 0
Ground truth (Index- Components)
1 - 8 2 - 5 3 - 5
12/ 2/ 1 4/ 1/ 0 11/ 0/ 1 2/ 1/ 0
4 - 15 5 - 5 6 - 12 7 - 3
4/ 0/ 0 2/ 1/ 0 5/ 0/ 0 7/ 0/ 0
8 - 4 9 - 3 10 - 5 11 - 7
2/ 2/ 0 2/ 0/ 0 2/ 0/ 0 2/ 1/ 0 2/ 0/ 0
12 - 4 13 - 2 14 - 2 15 - 3 16 - 2
2/ 2/ 0 2/ 0/ 0 4/ 0/ 0 3/ 0/ 0 5/ 0/ 0 3/ 1/ 0
17 - 4 18- 2 19 - 4 20 - 3 21 - 5 22 - 4
1/ 1/ 0 3/ 1/ 0 1/ 1/ 0 2/ 1/ 0 6 /0 /0
23 - 2 24 - 4 25 - 2 26 - 3 27 - 6
For the slice cutting based method, there are two important parameters affecting the result of decomposition
• The interval height of every slice is defined as 0.1m. This parameter affects the performance of refining of widths of cut slices.
decides whether the pole points of every slice can be extracted accurately.
For the parameters mentioned above, most of them are adaptive or defined by the prior-knowledge of street furniture such as median width. They are more or less stable for street furniture decomposition.
3.3 Results and Evaluation
In order to evaluate the result of street furniture decomposition, 27 different instances of street furniture are selected. For the criteria of evaluation, visual inspection is utilized in this paper. Only obvious errors are demonstrated in this section. And these errors are quantified based on correct, over- and under- decomposition. These errors are explained for the following experiment. The result is shown in Table 1. For every pole, Table 1 shows the decomposition result with the error statistics. And below that it is the ground truth with the street furniture number and the number of its components. In Table 1, three numbers for decomposition error statistics are the number of correct, over and under decomposed components.
In Table 1, all the main poles of street furniture have been extracted. Many points of other components are detected as pole points in instance 3 and 9. 82.2% of the components are separated correctly. Street furniture is decomposed into different components. Different traffic signs can be separated, shown in instance 4, 6 and 11. These street signs are separated. Street lights which are very near to trees can be also decomposed, which is shown as instance 8. Different traffic lights or street lights with poles are separated, shown as instance 3, 4, 6, 10, 21, 27. By decomposing street furniture, it can provide the number of street signs and street lights for the future work. In addition, the proposed method can separate bicycle from street signs (instance 7), separate garbage bin from light poles (instance 27) and separate street furniture which is near to each other (instance 19).
However, when traffic signs or street signs are close to poles, these signs will be over-decomposed into two or more parts. This problem is with street furniture instance 1, 2, 3, 5, 7, 9, 12, 17, 22, 23, 24, 25. The reason is that these sign points become part of pole points and connected component analysis is not able to connect these sign points. Curve poles (instance 13, 14, 16, 17) cannot be extracted precisely. This is because the prerequisite of pole extraction methods that poles are straight.
The result shows that mixed classes street furniture is decomposed into different components in accordance to different functionalities. It can provide more detailed information of street furniture than generic segmentation and classification. For semantics interpretation of these components, learning properties of these decomposed components such as shapes and sizes needs to be carried out.
4. DISCUSSION
According to the results demonstrated in the last section, 92.6% of the main poles of street furniture have been extracted and 82.2% of the components are separated correctly.
2D point density based method extracts poles from street furniture which has many attached components or two or more vertical poles (instance 7, 8).This method is only restricted to vertical pole extraction. RANSAC line fitting method can
extract both horizontal and vertical poles well (instance 4). Slice cutting based method can extract both thick (instance 9) and thin (instance 20, 21, 22 etc.) poles from street furniture. Since slice cutting based method utilizes line fitting and buffer width to extract pole points, it can extract pole with a gap (instance 12).
Except that curve poles cannot be extracted accurately because the pole extraction method is proposed based on the features of straight poles, most of the incorrect decomposition is caused by connected component analysis. When sign points are close to pole, points on these signs are categorized as poles. The reason is in this case 2D point density of these sign points is very high and they are very close to the centre line of pole. With only Euclidean distance, these points cannot be separated from pole points. These poles and components will be checked during post-processing to see if they are incorrectly categorized. Therefore, post-processing is needed. Later in post-processing, standardized sizes of street signs, shape features and topological relationship of components could be used to improve street furniture decomposition.
5. CONCLUSION AND FUTURE WORK
In this paper, the main contribution is a street furniture decomposition method which combines three pole extraction approaches. Most of mixed class street furniture are decomposed into different components corresponding to their functionalities correctly. All main poles of street furniture are extracted and 82.2% of the components are correctly decomposed. Street furniture decomposition provides much knowledge for the classification, which will be the next stage. Some components cannot be separated and poles cannot be extracted accurately. Most errors come from connected components analysis. Inaccurate decomposition needs to be solved and the performance of the decomposition can be improved by bettering connected component analysis. Future work is to learn the properties of these decomposed components and interpret these components with meaningful labels.
REFERENCES
Aijazi, A. K., Checchin, P., & Trassoudaine, L., 2013. Segmentation based classification of 3D urban point clouds: A super-voxel based approach with evaluation. Remote Sensing, 5(4), pp. 1624-1650.
Bremer, M., Wichmann, V., & Rutzinger, M., 2013. Eigenvalue and graph-based object extraction from mobile laser scanning point clouds. ISPRS Annals of Photogrammetry, Remote Sensing and Spatial Information Sciences, 1(2), pp. 55-60.
Brenner, C., 2009. Extraction of features from mobile laser scanning data for future driver assistance systems. Springer, Hannover. pp. 25-42.
Cabo, C., Ordoñez, C., García-Cortés, S., & Martínez, J., 2014. An algorithm for automatic detection of pole-like street furniture objects from Mobile Laser Scanner point clouds. ISPRS Journal of Photogrammetry and Remote Sensing, 87, pp. 47-56.
and Spatial Information Sciences, Calgary, Canada, Vol. XXXVIII-5/W12, pp. 97-102.
El-Halawany, S.I. and Lichti, D.D., 2013. Detecting road poles from mobile terrestrial laser scanning data.GIScience & Remote Sensing,50(6), pp. 704-722.
Fukano, K. and Masuda, H., 2015. Detection and Classification of Pole-Like Objects from Mobile Mapping Data. ISPRS Annals of Photogrammetry, Remote Sensing and Spatial Information Sciences, 1, pp. 57-64.
Golovinskiy, A. and Funkhouser, T., 2009. Min-cut based segmentation of point clouds. IEEE Workshop on Search in 3D and Video (S3DV), IEEE International Conference on Computer Vision, Kyoto, Japan, pp. 39–46.
Golovinskiy, A., Kim, V. G., & Funkhouser, T., 2009. Shape-based recognition of 3D point clouds in urban environments. IEEE International Conference on Computer Vision, Kyoto, Japan, pp. 2154–2161.
IGN, 2013. http://data.ign.fr/benchmarks/UrbanAnalysis/.
Huang, J. and You, S., 2015. Pole-like object detection and classification from urban point clouds. IEEE International Conference on Robotics and Automation, Seattle, Washington USA, pp. 3032-3038.
Ishikawa, K., Tonomura, F., Amano, Y., & Hashizume, T., 2012. Recognition of Road Objects from 3D Mobile Mapping Data. Asian Conference on Design and Digital Engineering, Niseko, Japan, No. 100101.
Lehtomäki, M., Jaakkola, A., Hyyppä, J., Kukko, A., & Kaartinen, H., 2010. Detection of Vertical Pole-Like Objects in a Road Environment Using Vehicle-Based Laser Scanning Data. Remote Sensing, 2(3), pp. 641-664.
Li, D. and Oude Elberink, S., 2013. Optimizing detection of road furniture (pole-like objects) in mobile laser scanner data. ISPRS Annals of Photogrammetry, Remote Sensing and Spatial Information Sciences, Vol. II-5/W2, pp. 163-168.
Liberge, S., Soheilian, B., Chehata, N., & Paparoditis, N., 2010. Extraction of vertical posts in 3D laser point clouds acquired in dense urban areas by a mobile mapping system. International Archives of Photogrammetry Remote Sensing and Spatial Information Sciences, Saint-Mandé, France, Vol. XXXVIII, Part 3B, pp. 126-130.
Nurunnabi, A., Belton, D., & West, G., 2012. Robust segmentation in laser scanning 3d point cloud data. IEEE International Conference on Digital Image Computing Techniques and Applications, Fremantle, Australia, pp. 1-8.
Oude Elberink, S.and Kemboi, B., 2014. User-assisted object detection by segment based similarity measures in mobile laser scanner data. International Archives of the Photogrammetry, Remote Sensing and Spatial Information Sciences, Zurich, Switzerland, Vol. XL, Part 3, pp. 239-246.
Pu, S., Rutzinger, M., Vosselman, G., & Oude Elberink, S., 2011. Recognizing basic structures from mobile laser scanning data for road inventory studies. ISPRS Journal of Photogrammetry and Remote Sensing, 66(6, Supplement), pp. S28-S39.
Rabbani, T., van den Heuvel, F., & Vosselmann, G., 2006. Segmentation of point clouds using smoothness constraint. International Archives of Photogrammetry, Remote Sensing and Spatial Information Sciences, Dresden, Germany, Vol. XXXVI, Part 5, pp. 248-253.
Schnabel, R., Wahl, R., & Klein, R., 2007. Efficient RANSAC for Point-Cloud Shape Detection. Computer graphics forum, 26 (2), pp. 214-226.
Serna, A. and Marcotegui, B., 2014. Detection, segmentation and classification of 3D urban objects using mathematical morphology and supervised learning. ISPRS Journal of Photogrammetry and Remote Sensing, 93, pp.243-255.
Strom, J., Richardson, A., & Olson, E., 2010. Graph-based segmentation for coloured 3D laser point clouds. IEEE/ RSJ International Conference on Intelligent Robots and Systems, Taipei, Taiwan, pp. 2131-2136.
Vosselman, G., 2013. Point cloud segmentation for urban scene classification. International Archives of Photogrammetry, Remote Sensing and Spatial Information Sciences, Antalya, Turkey, Vol. XL-7/W2, pp. 257-262.
Vosselman, G., Gorte, B. G., Sithole, G., & Rabbani, T., 2004. Recognising structure in laser scanner point clouds. International Archives of Photogrammetry, Remote Sensing and Spatial Information Sciences, Vol. XXXVI -8/W2, pp. 33-38.
Weinmann, M., Jutzi, B., & Mallet, C., 2014. Semantic 3D scene interpretation: a framework combining optimal neighbourhood size selection with relevant features. ISPRS Annals of the Photogrammetry, Remote Sensing and Spatial Information Sciences, Zurich, Switzerland, Vol. II, Part 3, pp. 181-188.
Yang, B. and Dong, Z., 2013. A shape-based segmentation method for mobile laser scanning point clouds. ISPRS Journal of Photogrammetry and Remote Sensing, 81, pp. 19-30.
Yang, B., Dong, Z., Zhao, G., & Dai, W., 2015. Hierarchical extraction of urban objects from mobile laser scanning data. ISPRS Journal of Photogrammetry and Remote Sensing, 99, pp. 45-57.
Yokoyama, H., Date, H., Kanai, S., & Takeda, H., 2013. Detection and Classification of Pole-like Objects from Mobile Laser Scanning Data of Urban Environments. International Journal of CAD/CAM, 13(2), pp. 31-40.