USING REMOTE SENSING AND RPAS FOR ARCHAEOLOGY AND MONITORING
IN WESTERN GREENLAND
K. Pavelka*, J. Šedina,E. Matoušková, M. Faltýnová, I.Hlaváčová
Department of Mapping and Cartography, Faculty of Civil Engineering, Czech Technical University in Prague, Czech Republic [email protected]
Commission ICWG I/Vb
KEY WORDS: Aerial Photogrammetry, RPAS, Glaciology, InSAR, Greenland
ABSTRACT:
Since 2002, German low-cost scientific expeditions to Greenland have been performed. The objective was a geodetic survey and glaciology with GNSS technology – mainly the measurement of glacier profiles (height). The same glacier profiles along the route were measured during German expeditions in 2006, 2010, 2012 and 2015. The last international expedition was supplemented with RPAS (UAV) measurement, the testing of small corner reflectors for Terra SAR X satellite measurement and the use of image based modelling technology for historical monuments documentation, all in specific arctic conditions. The RPAS measurement was focused on the documentation of existing valuable archaeological sites near Ilulissat city and the testing of RPAS technology for the monitoring of the face of the moving glacier. Two typical church wooden constructions were documented by simple photogrammetric technology based on image correlation. Both experiments were evaluated as successfully case projects. The last part of the experiments deals with the monitoring of a moving inland glacier using SAR technology; four corner reflectors were installed on the glacier and on a massive nearby rock. Two ascending and two descending overflights of the Terra SAR X satellite in fine resolution mode were performed. The InSAR technology give inconclusive results, but some movements were detected; small and inexpensive corner reflectors of our own production have proven suitable. Experience and expertise from the measurement such as the first outputs from the expedition are the content of the present article.
* Corresponding author.
1. INTRODUCTION
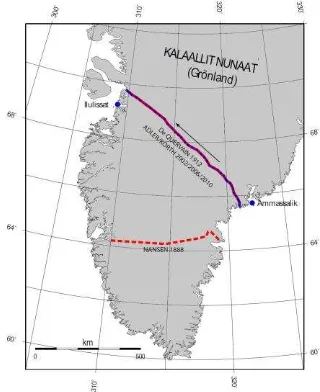
In early summer 1912, the Swiss meteorologist Alfred de Quervain crossed together, with three companions, the Greenland ice on a 700 km long route between Ilulissat on the west and east of the island Tassilaq. It was more than twenty years after the first successful expedition of the Norwegian Fridtjof Nansen in 1888. In 2002, 90 years after de Quervain's group, the first German expedition was held along the same route. The last expedition was partly international, when a member of the Czech Technical University (CTU) in Prague (Czech Republic) also attended as an expert in remote sensing and photogrammetry. For this reason, three new experiments were carried out: testing Terra SAR X satellite data for inland glacier movements, testing and using of RPAS (remotely piloted aircraft system) for the monitoring of glacier movements and archaeological sites documentation in specific arctic conditions and the using of simple photogrammetric technology for objects documentation. The expedition began on the East Greenland coast at the end of July. Four German researchers under the leadership of prof. Korth (BEUTH University of Applied Sciences, Berlin) crossed the Greenland glacier on Alfred de Quervain´s historical route. On the western part of the Greenland glacier, a group with two other persons joined, K. Pavelka from the CTU in Prague and the last member of German group (Pavelka, 2016). While the main research purpose of this expedition was the repeated GNSS measurement of glacier profile along the same route, new experiments were focused on photogrammetry and remote sensing (Zwally et al, 2002).
The preliminary results of the GNSS measurement of glaciers profile show extreme changes associated with the thaw of glaciers in western Greenland (up to 8 meters in ice height for about 10 years. Strangely enough, the central and eastern part of the inland glacier has not changed much; other phenomena is that glaciers move at twice their normal acceleration in some places and rapidly increase in air temperature, especially on the west coast (Dietrich et al, 2000, Potsch et al, 1999).
Figure 1. Expeditions - routes of Nansen, Quervain and Korth (according to W.Korth)
2. EXPERIMENTS
2.1 Using of Terra SAR X data
The first experiment dealt with the use of satellite imaging radar measurements (Terra SAR X) based on four corner reflectors with the aim of ice movement detection. It was the implementation of an approved project by the DLR (Gesellschaft für Anwendungen Raumfahrt), installation of corner radar reflectors for the satellite Terra SAR X and the pre-programmed satellite measurements of selected locations. In the area of interest (near the Egi glacier, north of Ilulissat city), four corner reflectors were installed and oriented for the ascending track (for one of them, the orientation is probably inaccurate). Two of them were installed on the bedrock (not expected to be moving at all) and two of them were installed on the ice. All the reflectors were geodetically precisely measured using GNSS. The aim of the project was to verify the possibility to monitor the movement of glaciers from radar satellites by the classical method with the temporal resolution and InSAR technology (Goldstein et al, 1993).
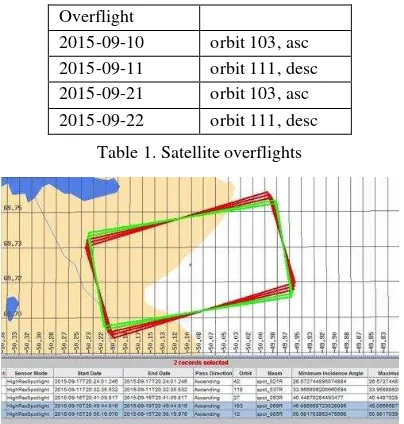
Four programmed satellite overflights above the selected area were done with eleven day intervals (ascending track September 10th and September 21th and the descending track September 11th and September 22th, 2015).
Overflight
2015-09-10 orbit 103, asc 2015-09-11 orbit 111, desc 2015-09-21 orbit 103, asc 2015-09-22 orbit 111, desc
Table 1. Satellite overflights
Figure 2. Area of interest, west Greenland north of Ilulissat (DLR, Germany)
Figure 3. Area of interest on satellite image, expedition camp Nr.39, end of inland glacier (Google Earth)
Originally, the reflectors movement of some meters (during the 11 days) was expected. According to it, GEC data was ordered to be perfectly geocoded with a known altitude (we were afraid of EEC data because the availability of the DEM in this area is limited and the accuracy is expected to be low (out-of-date)). Within the project, all the corner reflectors were found in the image (after the height correction, the coordinates correspond to the image) and their movement was estimated using image correlation (squares of 128x128 pixels, resp. 256x256 pixels were cropped; for each pair (asc/desc) and each reflector one smaller and one larger crop). Then, the crops were oversampled by the factor of 8. The position of the smaller crop within the larger crop is computed using the maximization of image correlation (in MATLAB).
Figure 4. Installing of corner reflector (photo from expedition, 2015)
Figure 5. Correlation function for corner reflector Nr.1 (Hlaváčová, 2015)
Figure 6. Correlation function for corner reflector Nr.3, (Hlaváčová, 2015)
The same procedure was applied for both ascending and descending pairs, however for the descending track the pair of corner reflectors were not found in the image (other flight direction).
After the oversampling, the resolution cell was set on 6 cm. The correlation function differs for individual reflectors: the peak is high and thin for the areas on the rock, but it is lower and wider for the areas on the glacier due to the fact that the area is more homogeneous, even more in the descending track where the The International Archives of the Photogrammetry, Remote Sensing and Spatial Information Sciences, Volume XLI-B1, 2016
reflectors are absent. Also, the peak is lower for reflector nr.1 which is probably inaccurately oriented. The estimated movements (in meters) are stated in the tables below. The correlation peak height is a relative measurement to compare the quality of the estimated shifts and the correlation peak width is the value measured at 95% of its height (in meters). The N and E values are the estimated shifts in the North and East direction, respectively. Let us point out that the resolution cell is 6 cm, and the estimated shifts are corrected for the height difference (between the actual and reference height).
Point no. N (m) E(m) corr. peak close to its border) of approx. 10-40 cm/day was not confirmed. The estimated glacier movement was approx. 30-40 cm in both east and north directions for 11 days. However, the shift was only estimated for 2 points on the glacier, and it seems that the accuracy of the method was comparable to the estimated shifts. We had no explanation for the difference between the estimated shifts between the two tracks except for the low accuracy of the method. Assuming points 3 and 4 to be stable (on the rock; their estimated movements correspond to the assumption), according to the ascending image pair, point 1 moved by 30 cm to the vertical movement (melting), however such a difference was not expected during the 11 days. The descending pair images were acquired only a night (13 hours) after the ascending pair images.
Therefore, we would like to perform standard interferometric processing to estimate the movements with higher accuracy, hoping that the movements will be slow enough (in space) to
At the same time, we would like to ask if the new TanDEM-X DEM is already available for this area.
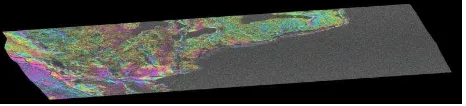
Figure 7. Ascending track-Sept.10-21: Interferogram after filtration, (Hlaváčová, 2015)
Figure 8. Ascending track-Sept.10-21: Points after filtration and thresholding, (Hlaváčová, 2015)
Figure 9. Descending track-Sept.11-22: Interferogram after filtration, (Hlaváčová, 2015)
Figure 10. Descending track-Sept.11-22: Points after filtration and thresholding, (Hlaváčová, 2015)
InSAR technology was, in this case, unsuccessful, with the grey area (glacier) being totally uncorrelated. ASTER GDEM (SRTM don´t exists for the area) has been used as a reference digital elevation model (DEM) for InSAR technology; its inaccuracy may cause the fringe on the rocks, but due to ambiguity (400 meters) it is considered unlikely (1 fringe would be caused by a bug in the height of 400 meters). The “offset tracking” with a window size 32x32 pixels has been used. It was applied to every point of the used radar images (calculations lasted 3-4 days in MATLAB), and the results were quite noisy and had a low reliability. When the displacement for each point using offset tracking was calculated, in addition to SNR (signal to noise ratio) was defined and based on this value, the resulting points were filtered; we used as a threshold value 7, which is in the software GAMMA generally recommended for other applications and had proven itself. Furthermore, the mean and standard deviation on the rocks were calculated, which was deducted from the entire raster. In the image, unfortunately, trends remained. Standard deviation on the rocks for each direction and each pair were about 0.5 m. After deducting the mean value from the rock, the glacier remained at a nonzero mean value, which was in order again to within 0.5 m, but the data contained appreciable noise.
The software allowed the computing of the point’s movement in the ground range in case the movements took place in the horizontal plane. But it was certain that the movements of the glacier was non-constant and not only in the horizontal plane.
2.2 RPAS
The second part of our experiment was the use of RPAS. Light, easy to transport and operate, the RPAS EBee system was used. EBee is a Swiss made small winged system, used many times in The International Archives of the Photogrammetry, Remote Sensing and Spatial Information Sciences, Volume XLI-B1, 2016
the Czech Republic for photogrammetric projects; in this case, measurements in special arctic surroundings were tested. It meant long transportation times, problems with batteries and its charging using solar cells, strong wind and wind streams, highly inaccurate digital terrain models and problems with orientation in terrain (without Internet access and up to date satellite images), wrong detection of height above real sea level (GNSS data uses geocentrical coordinates) etc. Our RPAS was often on the verge of destruction; it was also very hard to find a place for landing. Another problem caused a contrast between ice and land on images taken in such meteorological conditions and transportation. The RPAS measurements were focused on using this technology for Egi at the front face of the glacier movements from two different flights and on using RPAS for the archaeological documentation of historically valuable Sermermiut settlements in near the infrared and visible range (Pavelka et al, 2014).
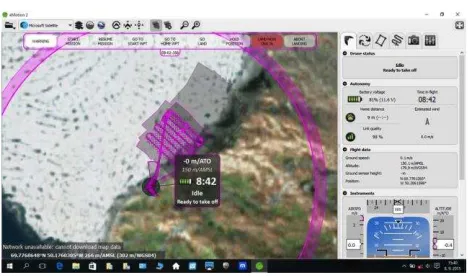
a) Opposite Disco island, in Disco bay, a several hours boat ride from Ilulissat, there sinks into the sea with eternal thundering the face of the famous Egi glacier. The Egi glacier is one of the fastest glaciers; the movement of its face is about four meters per day. Glacier movement was up to 4m per day, it was approximately 17 cm per hour. Our RPAS allowed an image pixel resolution theoretically up to 3cm- that meant that the movement in one hour should be detected by the difference of two pictures or, better yet, as the difference of two digital surface models (only the glacier is moving, while the nearby bedrock was stable).
Figure 11. Egi glacier face, (Pavelka, 2015)
Figure 12. Two overlapping flights over the Egi glacier; the satellite image as the under layer is out of date and has a low resolution for precise navigation and orientation. The glacier face was, in September 2015, some hundred meters away from the depicted position, (Pavelka, 2015)
Unfortunately, we didn’t have time for precise glacier movement monitoring due to weather and transportation. Nevertheless, it was possible to detect small shifts of ice compared with the surrounding rocks. The method is applicable and the usability of RPAS has been proven.
b) There are also important archaeological sites in Greenland, and we documented a settlement already many millennia years old. The remains on the Sermermiut old settlement was difficult to see for non-experts; this area is now included in the UNESCO World Heritage site (Ilulissat Ice Fjord). The archaeological area is located in a small valley; remains of peat houses are visible on both sides of a small melt water creek. Some were inhabited until 1850; the oldest findings are more than 4000 years old. Near this settlement is an old cemetery or necropolis, and local historical Inuit graves can be identified from the field measurement and aerial images. Outputs from our measurements are thematical maps in orthophoto forms (visible, NIR and NDVI, digital relief model), (Pavelka, Šedina, 2015).
Figure 13. Sermermiut old settlement, (Pavelka, Šedina, 2015)
Figure 14. Detail of the Sermermiut old settlement – orthophoto in visible range from RPAS (Pavelka, Šedina, 2015)
2.3 Photogrammetry
A 3D model of selected graves near Sermermiut have been made (they were documented by terrestrial photogrammetry). The oldest historical buildings (wooden churches in Ilulissat, formerly Jakobshaven, and Ilimanaqu from the early 18th century) have been documented by photogrammetry too (Faltýnová, Pavelka, 2011).
Figure 15. Sermermiut old settlement – orthophoto superimposition with map from Ilulissat museum, (Pavelka, Šedina, 2015)
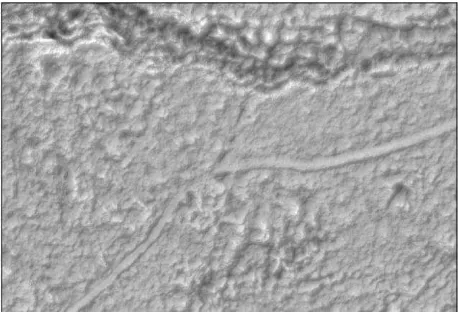
Figure 16. Sermermiut old settlement – differential digital terrain model
3. DISCUSSION AND CONCLUSION
Four corner metal reflectors (with 60cm side) were installed in Greenland in September 2015 (2 on the rock (assumed to be stable) and 2 at the glacier (assumed to be moving)), oriented to be visible from the passing of the TerraSAR-X satellite in the ascending track (High-Resolution SpotLight data with HH polarisation and high incidence angle were ordered to conform to the expected (almost) horizontal motion). The a-priori expected movements were around 40 cm/day at the edge of the glacier, i.e. around 4 m between the two consecutive passes of the satellite (11 days). In addition to the ascending pair of the data, a descending pair of data was acquired few hours later for verification (however the corner reflectors are not visible here). First, geocoded data were processed with the geo-resolution of 0.5 m. From this data, the approximate movements of the reflectors were estimated to be around 30-50 cm (in 11 days) in both east/north directions, comparable to the estimated accuracy of the offset-tracking method.
After that, InSAR processing was performed in order to assess for better accuracy, but the glacier surface is completely
incoherent, probably due to an unsuitable surface or melting. So, a detailed offset tracking analysis of the complex data is performed in order to assess the glacier movement in its whole area, also to verify the measured movements of the corner
reflectors. The quality of the measured offsets at the glacier surface is significantly lower in comparison to the rock area. The separation of the movement component from the geometry component is not trivial due to the fact that the glacier covers approximately half of the image area. If possible, 3D motions will be evaluated from the dual-track monitoring (the angle between the track headings is significantly higher in the polar areas than in commonly-monitored areas). Processing is performed in the GAMMA software.
ACKNOWLEDGEMENTS
This research was sponsored by Ministry of Culture of the Czech Republic, grant DF13P01OVV02 and by Czech Technical University in Prague, Faculty of Civil Engineering.
REFERENCES
Dietrich, R., Metzig, R., Korth, W., Perlt J. 1999. Combined use of field observations and SAR interferometry to study ice dynamics and mass balance in Dronning Maud Land, Antarctica, Polar Research - POLAR RES, vol. 18, no. 2, pp. 291-298.
Faltýnová, M., Pavelka, K. 2011. Aerial Laser Scanning in Archaeology. Geoinformatics. vol. 6, no. 1, p. 103-108. ISSN 1802-2669.
Goldstein, R.M., Engelhardt, H., Kamb, B., Frolich, R. M. 1993. "Satellite radar interferometry for monitoring ice sheet motion: application to an Antarctic ice streamy", Science 262 (5139), pp. 1525–1530
Pavelka, K. 2016. Greenland expedition 2015. Pražská technika. 2016, Vol. 18, Nr. 1/2016, ISSN 1213-5348. (in Czech), pp. 20-23.
Pavelka, K., Tollingerová, D. 1999. Creating of Digital Surface Model and Orthophoto from ASTER Satellite Data and their Application in Land/Water Research. Soil and Water Research. 2008, vol. 2, no. 3, p. 52-61. ISSN 1801-5395.
Pavelka, K., Šedina, J. 2015. Creating of DSM based on RPAS measurement and accuracy testing. Surface Models for Geosciences. Cham: Springer International Publishing, p. 173-188. ISSN 1863-2351. ISBN 978-3-319-18406-7.
Pavelka, K., Řezníček, J., Faltýnová, M., Matoušková, E. 2014. RPAS as a tool for the monitoring of a natural reserve. 14th International Multidisciplinary Scientific Geoconference SGEM 2014, Conference Proceedings vol. III. Sofia: STEF92 Technology Ltd., p. 291-298. ISSN 1314-2704. ISBN 978-619-7105-12-4.
Potzsch, A., Legresy, B., Korth, W., Dietrich, R. 2000. Using SAR Interferometry and Field Observations, http://earth.esa.int
Zwally, H.J., Abdalati, W., Herring, T., Larson, K., Saba, J. Steffen, K. 2002. Surface Melt-Induced Acceleration of Greenland Ice-Sheet Flow, Science Express, Science 12 July 2002: Vol. 297. no. 5579, pp. 218 - 222.doi:10.1126/science.1072708