DEFORMATION EFFECTS OF DAMS ON COASTAL REGIONS USING SENTINEL-1
IW TOPS TIME SERIES: THE WEST LESVOS, GREECE CASE
K. Karamvasis 1, *, V. Karathanassi 1
1 Laboratory of Remote Sensing, National Technical University of Athens, 9 Heroon Polytechniou Str, Zographos, 15780, Athens,
Greece - [email protected], [email protected]
KEY WORDS: Sentinel-1, PSI, Land Subsidence, Coastal Environments, Dams
ABSTRACT:
Coastal zones are vulnerable to erosion and loss by level sea rise. Subsidence caused by the reduction of fluvial sediments in coastal zones found close to dams, is another important deformation factor. Quantification of the deformation rate of coastal region is essential for natural and anthropogenic activities. The study utilizes Interferometric SAR (Synthetic Aperture Radar) techniques and exploits the archive of Sentinel-1 TOPS data for the period 2014-2016. The freely available, wide ground coverage (250x170km) and small temporal resolution Sentinel-1 TOPS datasets are promising for coastal applications. Persistent Scatterer Interferometry (PSI) methodologies are considered state-of-the-art remote sensing approaches for land deformation monitoring. The selected PSI method is the Small Baseline Subset (SBAS) multitemporal InSAR technique. The study area of this study is the coastal zone of west region of Lesvos Island, Greece. The main characteristic of the area is the reduction of the fluvial sediment supply from the coastal drainage basins due to construction of dams and the abstraction of riverine sediments. The study demonstrates the potentials of the SBAS method for measuring and mapping the dynamic changes in coastal topography in terms of subsidence rates and discusses its advantages and limitations. The results show that natural and rural environments appear to have diverse ground deformation patterns.
1. INTRODUCTION
Deformation on the Earth`s surface can be caused from natural and anthropogenic forces. In coastal regions natural causes are the sediment deposition along rivers and near coasts, which together with erosion processes are the main deformation causes. The main anthropogenic activities related with coastal deformation are the reduction of the fluvial sediment supply from the coastal drainage basins due to the construction of dams and the abstraction of riverine sediments (Velegrakis et al., 2008). Coastal deformation (mainly subsidence) which involve inhabited areas can have conspicuous economic costs. Consequently information on ground stability is valuable for planning effective prevention measures and for implementation of warning systems.
Ground deformation information can be acquired using a number of techniques. Leveling and GPS (Global Positioning Systems) are the most accurate and well-developed methods. However, the aforementioned techniques are labor-intensive and are limited in spatial coverage and density. For extended areas, the use of the aforementioned methods is practically unfeasible due to their high cost in terms of time and money. Differential Interferometric Synthetic Aperture Radar (DInSAR) analysis considered to be an effective technique as they provide regional and spatially continuous deformation maps with high accuracy (<1 cm) and high temporal resolution (Hung et al., 2011).
Due to advances of the last decades in radar satellite capabilities and DInSAR techniques land deformation monitoring has been significantly improved. Mainly, DInSAR techniques based on the (Persistent Scatterer) PS method (Ferretti et al., 2001) and Small Baseline Subset (SBAS) technique (Berardino et al., 2002). The interferometric processing of SAR time series can provide high accuracy deformation results and average velocity maps. Time series of interferometric data have been used in a wide range of applications related with phenomena such as earthquakes, landslides, volcanoes, variations in ground water levels.
* Corresponding author
Advanced DInSAR techniques have been proven to be a suitable tool for measuring spatial and temporal patterns of surface deformation. It is important to state that in each application, each algorithm possesses inherently unique strengths and weaknesses due to specific characteristics in each case (Osmanoğlu et al., 2016).
In this study, an approach based on the SBAS technique (Berardino et al., 2002) was implemented. SBAS approach has been chosen for the following reasons. Firstly, it allows the measurement of surface displacements in low reflectivity areas like scattered outcrops and bare soil over the study area, and secondly, it is expected to perform well due to the small variability of the geometric position of Sentinel-1 acquisitions. The main objectives of this study are the (1) measurement and mapping of the spatial distribution of the deformation rates in the study area; (2) analysis of anthropogenic driving forces of the observed deformation patterns; and (3) exploration of the strengths and limitations of SBAS when Sentinel-1 datasets are used.
2. DATASETS AND STUDY AREA 2.1 Dataset
In figure 1, grey rectangle represent the coverage of Sentinel-1A dataset used. SAR data acquired from October 2014 to May 2016 and are provided via Sentinel-1 Scientific Data Hub.
The interferometric-related strengths of Sentinel-1A datasets are their small orbital tube (order of 100m), their high temporal
resolution (12 days) and their big spatial coverage (170kmx250km). However, due to the peculiarities of TOPS mode special treatment is needed in order to obtain accurate results.
2.2 Study area
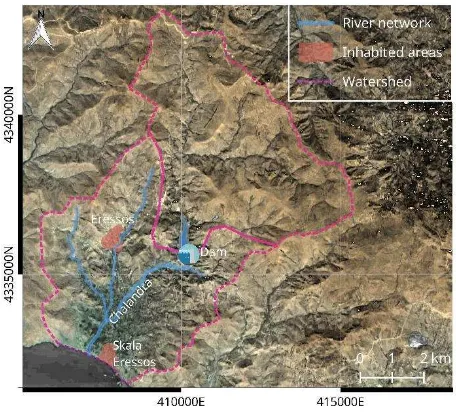
Figure 2. Study area. Background image results from the combination of an optical image (Landsat-8) and the SRTM DEM aspect map. Reference system is WGS84 UTM 35N.
The study area is the Eressos drainage basin located in the south-western region of Lesvos Island in Greece, as we can see in figure 1. In figure 2, a more detailed view of the study area is provided. The area of the whole basin is about 57 km2 and includes two
inhabited areas, the villages of Eressos and Skala Eressos. In this work, Eressos basin has been divided into two sub-basins; one upstream of the dam and another one downstream of the dam.
Eressos basin is found on upper Paleozoic-Triassic schists, conglomerates, limestones and slates, and Neogene volcanics (Velegrakis et al., 2008). The sub-basin located upstream of the dam consists of a n ignimbritic layer, a tephra layer and a dacitic lava unit (Hecht, 1975). The sub-basin located downstream of the dam is dominated by alluvial deposits such as sands, gravels, fluvial conglomerates and minor clay. The morphology of the study area is semi mountainous, with ground slopes decreasing from the uplands to the coast.
The area of interest in terms of vegetation mainly consists of agricultural regions with low-height crops, shrubs and sparsely scattered olive trees (Andreadis, 2005). The watershed contains several seasonal streams ending up in the Chalandra river which has 14 km length and up to 90 m3/sec discharge and flows into the sea at Skala Eressos beach. (Velegrakis et al., 2008).
The Eressos dam was constructed in 1999 on the Chalandra river for cultivation and general water needs of the municipality. Dams can provide solution to a lot of energy and water demand problems but can also affect downstream hydrology, morphology and ecology. Dams are related with the capture of sediment of the drainage basin resulting in negative sediment balance and subsequent morphological changes. This dam retains more than half of the sediment load produced in the basin (Velegrakis et al., 2008). The medium and coarse grained sediments from the uplands of basin also are captured by the dam.
3. METHODOLOGY
Due to special characteristics of TOPS (Terrain Observation with Progressive Scans) mode (Torres et al., 2012) the several changes needed to be made into the processing steps of conventional interferogram production (Bürgmann et al., 2000) in order to retrieve accurate interferometric products. The special treatment of TOPS datasets arises from the range-varying phase offsets due to EAPs (Elevation Antenna Patterns) (Miranda 2015). In our study due to the vegetation existence and the high humidity, interferometry is limited due to temporal decorrelation (Bürgmann et al., 2000) and tropospheric errors (Zebker et al., 1997). In order to overcome the aforementioned limitations we developed an SBAS based approach. The following flow chart showing the strategy, which consists of five main processing steps.
3.1 SLC Selection
After the download of all the available (45) Sentinel-1A acquisitions from October of 2014 till June of 2016 of our study area a selection strategy was implemented. The selection criteria were developed considering our present knowledge related to the appropriate properties of SLC acquisitions for achieving the optimum interferometric results.
The first criterion is associated with the atmospheric contribution in interferometric phase that should be mitigated. In particular, for each acquisition an atmospheric delay of Sentinel-1A signal was calculated using meteorological data of a station located in Skala Eressos. For the calculation of Line of Sight (LOS) atmospheric delay of Sentinel-1A signal, the Saastamoinen model (Saastamoinen, 1972) was used. It was decided to discard the acquisitions with high or low values of SAR atmospheric path Figure 1. Location map and spatial coverage of
delay. Moreover, we discarded the acquisitions in rainy days to ensure the interferometric phase stability.
The next criterion related with the geometric baseline information. Geometric baseline is associated with the topographic contribution in the interferometric phase. The acquisitions that form large baseline interferograms that equals to large residual topographic errors were discarded. With this approach, the topographic residual error is minimized in order to improve the reliability of the results (Berardino et al., 2002). However, the number of remaining acquisitions decreased drastically (17).
3.2 Pre-processing
Due to special characteristics of TOPS (Terrain Observation with Progressive Scans) mode (Torres et al., 2012) several changes needed to be made into the processing steps of conventional interferogram production (Bürgmann et al., 2000) in order to retrieve accurate interferometric products. The special treatment of TOPS datasets arises from the range-varying phase offsets due to EAPs (Elevation Antenna Patterns) (Miranda 2015).
The co-registration step of Sentinel-1A datasets was performed using precise orbits and with an external DEM according to Sansosti et al., 2006. As an external DEM, we used a photogrammetric DEM with ground pixel size of 5 m, provided by KTIMATOLOGIO S.A. Due to the high Doppler centroid (steep azimuth spectra ramp) in the burst edges of a Sentinel-1 acquisition a high co-registration precision is especially in the azimuth direction required (Prats-Iraola et al., 2012). The implemented method which can meet the strict co-registration requirements was the Enhanced Spectral Diversity method (Prats-Iraola et al., 2012; Yagüe-Martínez et al., 2016) and it was implemented using SARscape software, in which in the coregistration process the debursting of SLC acquisitions is included. In order to ensure the quality of coregistration we visually inspected the formed interferograms. No phase jumps were observed in the burst interfaces regions.
3.3 Interferometric Process
It must be stated that the multi-look ratio ¼ (azimuth looks/ range looks) was applied in each acquisition. The multi-looking process increases Signal to Noise (SNR) of the interferograms and the quality of coherence estimation (Gierull et al., 2004). Then, 95 interferograms were generated meeting the temporal, geometric
baseline and Doppler difference criteria. The formed interferograms considered as stripmap – like interferograms so phase filtering and phase unwrapping were implemented as in conventional stripmap interferometry. The next processing step is the adaptive filtering of the produced interferograms using a power spectrum filter (Goldstein & Werner 1998). Also an additional low pass filter (5%) was applied to remove high frequency phase noise. In order to create differential interferograms, topographic contribution was simulated using the aforementioned external DEM and extracted from each interferogram. The next step is the phase unwrapping that was performed using the MCF (minimum cost flow) algorithm (Costantini 1998). Besides the unwrapped differential interferograms it was also generated the associated coherence map for each interferogram. It should be mentioned that thresholds and settings were chosen empirically to improve the interferometric performance of Sentinel-1A datasets and ensure the reliability of the results (unwrapped interferometric phase).
3.4 Interferogram Selection
The purpose of this processing step is the creation of a high-quality subset of differential interferograms in order to maximize the performance of SBAS algorithm. At first, unwrapping errors were identified and mitigated with the assumption that the SAR phase field is conservative (Biggs et al., 2007). Orbital errors, caused from orbit inaccuracies (Zebker et al., 1994), were identified from the unusual dense-fringes phenomenon in the associated interferograms. Due to their small percentage of appearance, the respective interferograms were discarded. At last, given the fact that coherence is a measure of the quality of interferometric results, a high coherence subset of unwrapped interferograms was constructed.
3.5 SBAS Processing
This is the last processing step and it is related with the SBAS algorithm. SBAS technique mitigates decorrelation errors using appropriate combinations of interferograms and produces deformation (Berardino et al., 2002). At that point, we describe briefly the SBAS approach. Interested readers are referred to Berardino et al., 2002.
The first step of SBAS approach consists of the selection of coherent (>0.35) pixels with small standard phase deviation. These pixels can meet the criteria of SBAS analysis in order to obtain deformation information.
Given the fact that interferograms contain differential measurements, it is necessary to use a spatial reference in order to obtain the displacement results. We selected 30 pixels by thresholding the temporal coherence (>0.95) and by selecting the minimum standard deviation of their unwrapped phase series. We assumed that the reference pixels are not located in a deforming zone even though it is practically impossible to completely rule out surface motion. It is important to note, that high-coherent Skala Eressos region was assumed as a non-deforming zone in order to acquire reliable results for our study area.
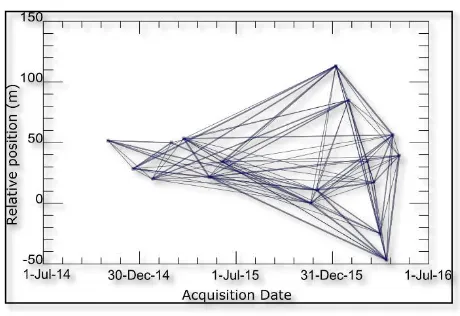
In order to mitigate phase unwrapping errors, phase unwrapping was repeated, exploiting the temporal relations of the interferometric phases. The algorithm that was used based on the Extended Minimum Cost Flow approach (Pepe and Lanari 2006). Figure 3. Spatial and temporal distribution of the
Using the unwrapped phases a non-linear rank deficient system was formulated and its solution was obtained using Singular Value Decomposition (SVD) method in a Least Square (LS) sense. We remark that the minimum norm constraint was on the rate of the phase. The main results consist of the mean deformation velocity map and the deformation time series. At the same time estimations of residual topographic and atmospheric contributions are also accomplished. In particular, SBAS algorithm mitigates atmospheric artifacts through temporal high-pass and spatial low-high-pass filtering of the interferograms after the mean deformation rates have been removed. (Berardino et al., 2002). This operation is based on the observation that the atmospheric phase signal component is highly correlated in space but poorly in time (Ferretti et al., 2001; Goldstein, 1995). We remark that using a low pass filter, long-wavelength errors (errors that occur on a large scale) are removed. These errors are related with gradual atmospheric changes, ionospheric effects, residual orbital errors but also with valuable deformation signal that can be removed.
The last part of this approach was the geocoding and resampling of SBAS results from SAR geometry to a reference grid. The selected grid was the cartographic projection Universal Transverse Mercator (UTM) in zone 35 North with WGS84 as reference ellipsoid.
4. RESULTS AND DISCUSSION
In this section the most significant SBAS results are reported and analysed. As we already mentioned the main results of SBAS
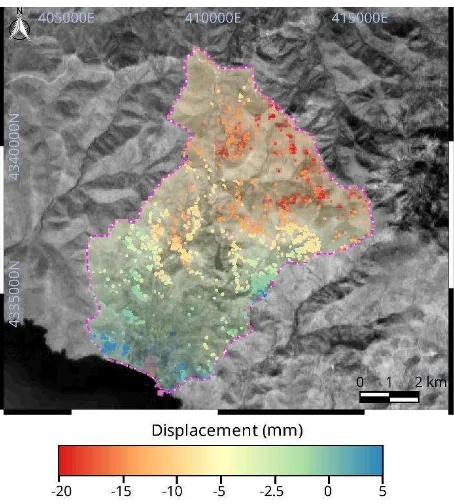
processing were the average velocity during the time of acquisitions and the deformation time series. In figure 4, the average phase velocity is estimated using the assumption of linear deformation rate through time. Positive values indicate
movement towards the satellite (uplift) and the negative ones indicate movement away from satellite (subsidence). Subsidence in the study area is visible and increasing towards the North East direction.
The main causes of the observed subsidence are erosion and reduction of the fluvial sediment supply. Upstream of the dam, the high subsidence values are related to high rates of erosion in the north regions. The absence of dense vegetation combined with the steep relief upstream the dam, as we can clearly see in figure 2, are the main causes of the intense erosion rate. As we move towards the coast, the displacement values and the displacements rates decreases mainly due to the decreasing of the steepness and the increasing of vegetation cover. At last, we remark that positive deformation values were also observed downstream of the dam possibly due to anthropogenic factors.
It is clearly visible from figure 4 and 5 that there are limited pixels that provide information about the deformation downstream of the dam. The sparse distribution of the SBAS results is due to the fast changing physical characteristics (temporal decorrelation) of the downstream of the dam region because of the dense vegetation.
The validation of the deformation field measured from the Sentinel-1A data was carried out by comparing the average vertical GPS displacement component obtained from the Dionysos Satellite Observatory. Three continuous GPS stations located in Lesvos Island far away from the study area, independently assessed ground deformation during this period. This information was used as ground truth information. Vertical deformation values were calculated using SBAS results and compared with vertical GPS estimations. It was observed close agreement. However, the absence of external information about deformation in the study area did not allow us to compute the uncertainty of the results.
Figure 4. Cumulative deformation from October 2014 to May 2016. Total deformation at the SBAS point were interpolated on a regular spatial grid by means of Inverse Distance Weighting interpolation. The background image is the identical to figure 4
We should also highlight the limitation of interferometric techniques in measuring deformation fields in more than one direction. The use of several SAR geometries by combining multiple interferograms from adjacent tracks and ascending and descending tracks can potentially resolve the 3D displacement vector (Wright et al., 2004). However, different scene geometries imply different foreshortening and shadow effects, which affect phase values in different way.
Considering the short time period of the used Sentinel-1A acquisitions (<2 years) and the complex environment of the study area results are considered satisfactory. The observed deformation rates can be mostly associated with erosion, which is intense due to the winds that dominate in Aegean coastal areas. More research is needed to explain the specific interferometric deformation pattern.
5. CONCLUSION
The interferometric analysis of Sentinel-1 IW TOPS time series showed that the generation of high quality deformation maps is possible. Interferometric deformation maps can be a valuable tool for monitoring long-term deformation. Long-term deformation time series allow improving the interpretation of the natural and anthropogenic processes responsible for the ongoing deformation. In the study area, downstream of the dam SBAS results present low density. Dense vegetation is responsible for that. However, the increasing Sentinel-1 data archive and the constantly developing interferometric approaches are promising for retrieving accurate deformation patterns in such complex environments. In the broader area, SBAS produced acceptable and interpretable results. Coastal winds cause severe erosion effects which are the main deformation source. The results show that Sentinel-1 time series interferometric analysis can offer valuable information for coastal management and risk assessment.
Future work will focus on the combination of ongoing acquisitions from parallel Sentinel-1A and Sentinel-1B tracks to get more information about seasonal and long term deformation. The observations from multiple tracks can be also used to cross-validate the deformation measurements and distinguish accurately the vertical from the horizontal deformation component without the use of dense continuous GPS networks.
6. ACKNOWLEDGEMENTS
This study has received funding from the Horizon 2020 research and innovation programme under the Marie Sklodowska-Curie grant agreement No 691071. We would like to thank the European Space Agency (ESA) for supplying the Sentinel-1 images. The authors would like to acknowledge KTIMATOLOGIO S.A. for kindly providing the DEM for the study area. The authors are also grateful to the Dionysos Satellite Observatory, Higher Geodesy Laboratory for providing GPS data.
7. REFERENCES
Andreadis, O (2005). The effect of small dams on the sedimentary budget of small drainage basins of Mediterranean islands: The case of Eresos, Island of Lesvos Greece, MSc Thesis (In Greek with English abstract), University of the Aegean, Mytilene, Greece, 82 pp.
Berardino, P., Fornaro, G., Lanari, R., & Sansosti, E. (2002). A new algorithm for surface deformation monitoring based on small baseline differential SAR interferograms. IEEE Transactions on Geoscience and Remote Sensing, 40(11), 2375-2383.
Biggs, J., Wright, T., Lu, Z., & Parsons, B. (2007). Multi-interferogram method for measuring interseismic deformation: Denali Fault, Alaska. Geophysical Journal International, 170(3), 1165-1179.
Bürgmann, R., Rosen, P. A., & Fielding, E. J. (2000). Synthetic
aperture radar interferometry to measure Earth’s surface
topography and its deformation. Annual review of earth and planetary sciences, 28(1), 169-209.
Costantini, M. (1998). A novel phase unwrapping method based on network programming. IEEE Transactions on geoscience and remote sensing, 36(3), 813-821.
De Zan, F., & Guarnieri, A. M. (2006). TOPSAR: Terrain observation by progressive scans. IEEE Transactions on Geoscience and Remote Sensing, 44(9), 2352-2360.
Ferretti, A., Prati, C., & Rocca, F. (2001). Permanent scatterers in SAR interferometry. IEEE Transactions on geoscience and remote sensing, 39(1), 8-20.
Gierull, C. H. (2004). Statistical analysis of multilook SAR interferograms for CFAR detection of ground moving targets. IEEE Transactions on Geoscience and Remote Sensing, 42(4), 691-701.
Goldstein, R. (1995). Atmospheric limitations to repeat-track radar interferometry. Geophysical Research Letters, 22, 2517-2520.
Goldstein, R. M., & Werner, C. L. (1998). Radar interferogram filtering for geophysical applications. Geophysical Research Letters, 25(21), 4035-4038.
Hecht, J. 1975. Geological Map of Lesbos 1:50000 (Eressos Sheet). Institute of Geology and Mineral Exploration (IGME), Athens.
Hung, W. C., Hwang, C., Chen, Y. A., Chang, C. P., Yen, J. Y., Hooper, A., & Yang, C. Y. (2011). Surface deformation from persistent scatterers SAR interferometry and fusion with leveling data: A case study over the Choushui River Alluvial Fan, Taiwan. Remote Sensing of Environment, 115(4), 957-967.
Miranda, N., 2015, Sentinel-1 Instrument Processing Facility: Impact of the Elevation Antenna Pattern Phase Compensation on the Interferometric Phase Preservation, European Space Agency Technical Note ESA-EOPG-CSCOP-TN-0004, Issue 1, 22 July 2015.
Osmanoğlu, B., Sunar, F., Wdowinski, S., & Cabral-Cano, E. (2016). Time series analysis of InSAR data: Methods and trends. ISPRS Journal of Photogrammetry and Remote Sensing, 115, 90-102.
Rucci, A., Ferretti, A., Guarnieri, A. M., & Rocca, F. (2012). Sentinel 1 SAR interferometry applications: The outlook for sub millimeter measurements. Remote Sensing of Environment, 120, 156-163.
Sansosti, E., Berardino, P., Manunta, M., Serafino, F., & Fornaro, G. (2006). Geometrical SAR image registration. IEEE Transactions on Geoscience and Remote Sensing, 44(10), 2861.
Saastamoinen, J. (1972). Atmospheric correction for the troposphere and stratosphere in radio ranging satellites. The use of artificial satellites for geodesy, 247-251.
Torres, R.; Snoeij, P.; Geudtner, D.; Bibby, D.; Davidson, M.; Attema, E.; Potin, P.; Rommen, B.; Floury, N.; Brown, M.; et al. (2012) GMES Sentinel-1 mission. Remote Sensing of Environment, 120, 9-24.
Velegrakis, A. F., Vousdoukas, M. I., Andreadis, O., Adamakis, G., Pasakalidou, E., Meligonitis, R., & Kokolatos, G. (2008). Influence of dams on downstream beaches: Eressos, Lesbos, Eastern Mediterranean. Marine Georesources and Geotechnology, 26(4), 350-371.
Wright, T. J., Parsons, B. E., & Lu, Z. (2004). Toward mapping surface deformation in three dimensions using InSAR. Geophysical Research Letters, 31(1).
Yagüe-Martínez, N., Prats-Iraola, P., González, F. R., Brcic, R., Shau, R., Geudtner, D., Eineder, M., Bamler, R. (2016). Interferometric processing of Sentinel-1 TOPS data. IEEE Transactions on Geoscience and Remote Sensing, 54(4), 2220-2234.
Zebker, H., Rosen, P., Goldstein, R. M., Gabriel, A, Werner, C. L. (1994). On the derivation of coseismic displacement fields using differential radar interferometry: The Landers earthquake, Journal of Geophysical Research., 99(B10), 19 617-19 634.