SEMI-BLIND SOURCE SEPARATION FOR ESTIMATION OF CLAY CONTENT OVER
SEMI-VEGETATED AREAS, FROM VNIR/SWIR HYPERSPECTRAL AIRBORNE DATA
W. Ouerghemmi 1,2, C. Gomez 1, S. Nacer 2, P. Lagacherie 3
1 IRD, UMR LISAH (INRA-IRD-SupAgro), F-34060 Montpellier, France, [email protected] 2 LTSIRS, Laboratoire de Télédétection et Systèmes d’Information à Référence Spatiale, ENIT
, Tunisia, [email protected] 3 INRA, UMR LISAH (INRA-IRD-SupAgro), F-34060 Montpellier, France, [email protected]
KEY WORDS: Hyperspectral remote sensing, Semi-Blind source separation, Non-Negative Matrix Factorization, partial least
squares regression, clay content, semi-vegetated pixels.
ABSTRACT:
The applicability of Visible, Near-Infrared and Short Wave Infrared (VNIR/SWIR) hyperspectral imagery for soil property mapping decreases when surfaces are partially covered by vegetation. The objective of this research was to develop and evaluate a methodology based on the “double-extraction” technique, for clay content estimation over semi-vegetated surfaces using VNIR/SWIR hyperspectral airborne data. The “double-extraction” technique initially proposed by Ouerghemmi et al. (2011) consists of 1) an extraction of a soil reflectance spectrum from semi-vegetated spectra using a Blind Source Separation technique, and 2) an extraction of clay content from the soil reflectance spectrum , using a multivariate regression method. In this paper, the Source Separation approach is Semi-Blind thanks to the integration of field knowledge in Source Separation model. And the multivariate regression method is a partial least squares regression (PLSR) model. This study employed VNIR/SWIR HyMap airborne data acquired in a French Mediterranean region over an area of 24 km².
Our results showed that our methodology based on the “double-extraction” technique is accurate for clay content estimation when applied to pixels under a specific Cellulose Absorption Index threshold. Finally the clay content can be estimated over around 70% of the semi-vegetated pixels of our study area, which may offer an extension of soil properties mapping, at the moment restricted to bare soils.
1. INTRODUCTION
The use of hyperspectral imagery in Soil Science, have been widely developed over the last years, but still limited to the bare soil surface (e.g. Lagacherie et al., 2010). In particular, the soil properties estimation is inaccurate over vegetated surfaces. To overcome this limitation, a “double-extraction” of information from VNIR/SWIR hyperspectral imagery was proposed by Ouerghemmi et al. (2011) and consists of: 1) a first extraction of an estimated soil spectrum , using a blind source separation (BSS) technique from mixed VNIR/SWIR spectra , and 2) a second extraction of the soil property content applying classical chemometric methods on the estimated soil spectrum . In this study we adapted this “double-extraction” technique proposed by Ouerghemmi et al. (2011) in developing a Semi-Blind source separation (SBSS) method using prior knowledge about our context (presence of soil and green vegetation). Moreover the source separation method used in this study is a Non-Negative Matrix Factorization (NMF) method based on a data positivity assumption (spectra and proportions) which is suitable to our case study. As in Ouerghemmi et al. (2011), the multivariate regression method used for the extraction of the soil property content is a partial least squares regression (PLSR) model. The soil property tested was the clay content, the VNIR/SWIR hyperspectral data were acquired by the HyMap sensor and the study area is mainly composed by vineyards fields.
2. DATA
2.1 Study area and HyMap airborne data
The study area is located on the southern part of the La Peyne catchment (43°29′ N and 3°22′ E), 60 km west of Montpellier in France. The acreage of the study area is approximately 24 km²
and the area is largely devoted to vineyards. A HyMap image was acquired over the study area on July 13, 2003, with a spatial resolution of 5 m (Figure 1). The HyMap airborne imaging spectrometer measures the reflected radiance in 126 noncontiguous bands covering the 400–2500 nm spectral domain. Noisy and atmospheric absorption bands were removed and 114 spectral bands from 450 to 2468 nm were retained. The data and study area were described in details in Gomez et al., (2012).
2.2 Field data
In total, 135 soil samples were collected on the study area in 2009. The soil samples were composed of five sub-samples that were collected within a 10 m wide square centered on the geographical position of a sampling plot. A subset of data including 95 of these soil samples (further denoted by CalibSet), were sampled in fields that were bare during the hyperspectral data acquisition (Figure 1). A second database (further denoted by TestSet) includes the remaining 40 samples, which were collected in fields that were partially covered by vineyard during the hyperspectral data acquisition (Figure 1). Clay content was determined using classical routine soil analysis. The clay content of CalibSet and TestSet varied respectively between 73 and 397 g/kg and between 111 and 348 g/kg. Both sets followed a normal distribution.
In addition, vineyard leaves were collected over the study area and were measured in the laboratory with an ASD FieldSpecpro spectroradiometer (350–2500 nm). These Lab spectra were averaged and the resulting vineyard spectrum was resampled to the 114 spectral of HyMap data.
The pixels corresponding to the 40 semi-vegetated soil samples (TestSet) were characterized by a Normalized Difference
Vegetation Index (NDVI) and a Cellulose Absorption Index (CAI) respectively between 0.28 and 0.72 and between -236 and 32, both following a normal distribution.
Figure 1: HyMap hyperspectral image (in red the 95 soil samples, in green the 40 soil samples).
3. METHODOLOGY
The approach of “double-extraction” of information was tested on the 40 semi-vegetated sites corresponding to the TestSet database. For each semi-vegetated site, the methodology considered a grid of 3x3 pixels, supposed to be homogeneous in terms of vegetation type and clay content, and centered on the location of the field sample (Figure 2).
Figure 2: Illustration of a grid of 3 x 3 pixels centered on a sampled semi-vegetated site. Green crosses are the central pixel
for which clay content is known and a neighbour pixel.
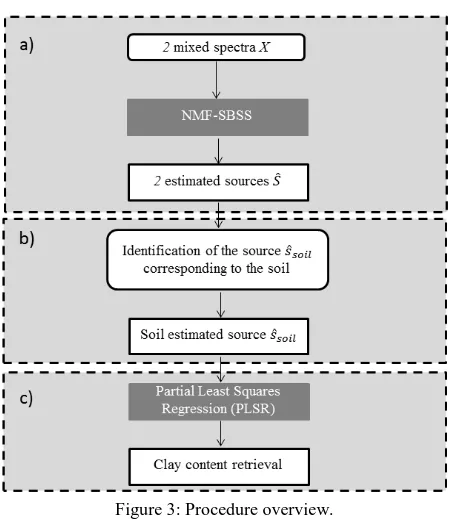
For each site, two spectra including the one of central pixel (Figure 2a) were used in input of the Semi-Blind source separation (SBSS) method to estimate two new spectra including an estimation of the soil spectrum (Figure 3a). After identification of the estimated soil spectrum among outputs of the SBSS method (Figure 3b), the clay content was predicted using a Partial Least Square Regression (PLSR) method (Figure 3c). This process was repeated for the eight couples of each site (Figure 2a). So eight clay content predictions for each semi-vegetated site were obtained and so averaged and attributed to the central pixel (Figure 3c).
Figure 3: Procedure overview.
3.1 Blind Source Separation approach
The goal of the Blind Source Separation (BSS) technique is to recover the original signals from their mixtures. The term “blind” refers to the fact that we have no knowledge of how the sources are mixed or about the sources themselves. Considering a linear mixture, m observed signals xiare linear combinations
of n signals sj (with m≥ n), which can be written in matrix
notation following:
(1) where λ is the index of the spectral band, X(λ)= [x1(λ)...xm(λ)]T
are the reflectance spectra of a mixture, S(λ)= [s1(λ)...sn(λ)]
T are the reflectance spectra of the original components, A is an m x n mixing matrix and α(λ)= [α1(λ)... αm(λ)]T is the noise component.
The aim of the BSS method is to solve (1) when S and A are unknown, where S= A-1X. The noise term α is neglected in order
to consider a simple model.
3.2 Semi-Blind Source Separation algorithm
In this study the Lee & Seung’s multiplicative algorithm (Lee and Seung, 2001) was used to solve the BSS problem. This algorithm is a Non-Negative Matrix Factorization (NMF) method based on the assumption of the positivity of the data (spectra and proportions). This assumption is suitable to our case study and motivates our choice for the NMF based method. The goal of the NMF is to approximate 2 positives matrices A and S that best fit the mixing matrix X, so that X≈AS. The NMF was popularized since the multiplicative Lee & Seung algorithm which can estimate simultaneously S and A using a multiplicative scheme (Lee and Seung, 2001).
The NMF algorithm is known to be sensitive to initial conditions Sinit and Ainit and gives non-unique solution (Cichocki
et al., 2009). To overcome these limitations we have modified the random initial conditions, into a supervised one close to the one used in (Meganem et al., 2014). Thanks to this supervised initialization, the NMF method became a Semi-Blind Source Separation (SBSS) technique.
We considered the existence of 2 components in the mixtures (n= 2), so the matrix Sinit will be initialized with 2 spectra, Sinit
=[s1_init, s2_init]T, where s1_init is a soil spectrum and s2_init is a
vegetation one. Ainit is identified by a Non Negative Least
Square method. The outputs of our SBSS method are 2 spectra
1 and 2 corresponding to the components existing in the spectrum with the higher is identified as the estimated soil spectrum.
3.3 Partial Least Squares Regression (PLSR)
The PLSR method is used to establish relationship between the soil property content and the VNIR/SWIR spectra (Tenenhaus, 1998). The PLSR reduces the number of variables, by projecting the X-variables (the VNIR/SWIR spectra) and Y-variables (the soil property content) on latent structures. This approach seeks linear combinations of the predictors, that explain both response and predictor variation.
A PLSR model was built using the 95 VNIR/SWIR soil spectra associated to their clay content corresponding to the CalibSet database. Prior to the quantitative statistical analysis, the reflectance was converted into a “pseudo absorbance” (log [1/reflectance]). Noise reduction was achieved through standard pre-treatments, including a Savitzky–Golay filter with second-order polynomial smoothing and window widths of 30 nm (Savitzky and Golay, 1964) for noise removal and a standard normal variate correction (Barnes et al., 1993) for additive and multiplicative effect removal. Moreover an analysis was performed to detect the spectral outliers in the calibration dataset (Chiang et al., 2003; Pearson, 2002) using the principle of the Mahalanobis distance (Mark and Tunnell, 1985) and applied it to principal component analysis reduced data. The samples with a Mahalanobis distance greater than 3 were identified as outliers. A leave-one-out cross-validation procedure was adopted to verify the prediction capability of the PLSR model for the calibration set (Wold, 1978). The number of latent predictor variables was set to 6, determined using the Predicted Residual Sum of Squares (PRESS) statistic, taking care to avoid under- and over-fitting.
This PLSR model has good performances with a Root Mean
The SBSS performances for soil spectrum extraction were evaluated using the index which is thecoefficient of correlation between the estimated soil spectrum and a reference soil spectrum . This reference soil spectrum belongs to the CalibSet database and is one of the most correlated with all the soil spectra of the database.
The PLSR performances for clay content estimation were evaluated using the Root Mean Square Error of Prediction
(RMSEP) of the Testset database. The expected RMSEP should be higher than RMSECV (see section 3.3) and should not exceed the standard deviation of the clay contents of the TestSet (denoted RMSEPMax) which is equal to 72.54 g/kg. The ratio of the performance to the deviation (RPD), which is the ratio between the standard deviation in the TestSet and the RMSEP, was used. RPD value has to be superior to 1.4 to consider the PLSR model performance as correct (Chang and Laird, 2001).
4. RESULTS
4.1 Preliminary results (without applying the Double-Extraction)
The prediction of clay content directly by the PLSR model over the 40 semi-vegetated sites was unsuccessful (RMSEP > RMSEPMax). The RMSEP and RPD were respectively of 71.27 g/kg, and 1.03. So a clay content mapping cannot be done using only a PLSR model calibrated on bare soil spectra and applied to semi-vegetated spectra.
4.2 Extraction of soil spectrum by SBSS method
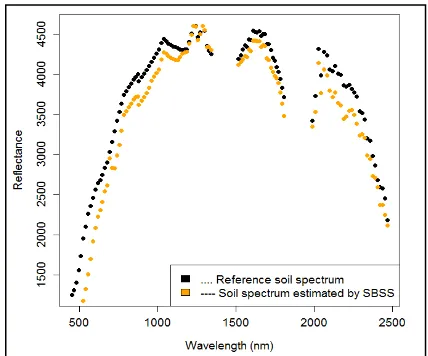
To evaluate the accuracy of the estimated soil spectra obtained for the 40 test sites, we have calculated the mean coefficient of correlation for each site. The soil spectra estimation was accurate, with a between 0.66 and 0.99, and having a mean of 0.96. The accuracy of the estimated soil spectra is shown on figure 4 and we can notice that the estimated spectrum is similar to the reference one .
Figure 4: The reference soil spectrum (in black points) and a soil spectrum estimated by SBSS method (brown points)
4.3 Estimation of clay content by PLSR, using soil spectrum
The prediction of clay content by the PLSR model over the 40 semi-vegetated sites, after the SBSS method was still unsuccessful (RMSEP > RMSEPMax). The RMSEP and RPD were respectively of 69.19 g/kg and 1.06 (Figure 5). Finally, the double extraction using the SBSS method leads to a slight increase in the performance of clay content estimation, compared to results obtained directly from the spectra X (see section 4.1).
The SBSS method combined with PLSR seems not efficient in clay estimation; however the scatter plot between the observed clay content and the predicted clay content shows some outliers that affect the global performance of clay prediction (Figure 5). The elimination of theses outliers could considerably enhance the performance of clay prediction.
Figure 5: Predicted clay content versus observed clay content, using soil spectra .
To filter these outliers we have studied the relation between the predicted clay values and two perturbation factors that are the green vegetation rate (measured with the NDVI), and the dry vegetation index (measured with CAI). These perturbation factors were calculated from the central pixel of each site. The CAI seemed more suitable against the NDVI (results not shown). Thus, in each grid of (3 x 3) pixels we have filtered the pixels with a CAI superior to -50, which correspond to the pixels having a high rate of dry vegetation (which represent 28% of the semi-vegetated sites). The prediction of clay has now a moderate accuracy with RPD >1.4 and a RMSEP < RMSEPMax (Figure 6).
4.4 Clay mapping over a HyMap Test image
We applied the SBSS method and the PLSR model on a portion of the HyMap image (0.46 km x 0.67 km). Only the semi-vegetated pixels with a CAI inferior to -50 were considered. The obtained map seems fluent, with a low variability in clay content inside the parcels, and a good identification of the parcels bound (Figure 7a). Moreover the spatial structure of semi-vegetated fields seems to be consistent with the neighboring bare soil fields (Figure 7b).
Figure 6: Scatter plot between predicted clay content and observed clay content after outliers filtering.
Figure 7: Clay mapping over HyMap test image, a) white pixels correspond to bare soil pixels, b) bare soil pixels are fulfilled
using clay content estimated by the PLSR model [1]. Black areas correspond to filtered pixels (CAI > -50).
5. DISCUSSION
The results obtained show that it was not possible to accurately predict a soil property using only a classical multivariate model applied to mixed spectrum. This illustrates the crucial importance of developing appropriate methods for isolating the soil signal from the mixed surfaces to extend the application of imaging spectrometry.
The use of a “double-extraction” technique which combines an NMF-SBSS algorithm to isolate the soil spectra and a PLSR model to predict the clay content over semi-vegetated surfaces, offered lower performances than those observed in the literature over bare soil surfaces (e.g., Gomez et al., 2012). An alternative to better taking into account non-linear and complex contributions in the mixtures and to improve prediction performances, could be the use of a non-linear BSS algorithm instead of a linear one; the linear-quadratic model developed by Meganem I. et al., (2014) could be tested in this context.
This procedure allows acceptable prediction of clay content (RMSEP around 52 g/kg, Figure 6) for 72 % of the semi-vegetated surfaces. The main limitation of the procedure occurred when the dry vegetation cover reach a given level (CAI > -50). As we used only two pixels in NMF-SBSS input, only two sources can be extracted. As we know that the 40 studied semi-vegetated sites were covered by vineyard (green vegetation), one of the extracted source is a green vegetation spectra and the other source is the soil. So a third component (e.g. dry vegetation) cannot be extracted by the procedure. Improving the performance of the “double-extraction” of information would require an adaptation of this “double -extraction” technique to the case of more than two components in mixed pixels. In particular, for pixels with CAI superior to -50, the “double-extraction” technique could be tested with three pixels of the grid (including the central pixel, Figure 2a) in input.
6. CONCLUSION
The double extraction technique based on a Semi-Blind algorithm gives encouraging results, for soil spectrum extraction and clay prediction using a threshold based on dry vegetation index (CAI). In spite of a reduction of studied pixels (28% in our case), the performances of clay prediction is acceptable and an interesting clay content maps can be obtained.
Further tests are planned to validate the predicted clay map over the entire study area, using variograms to study spatial structures of the predictions. The experiments presented in this
paper were the first step of a research which has to lead to a successful soil property mapping over all the mixed surfaces of this vineyard region covered by the hyperspectral image.
ACKNOWLEDGEMENTS
We are indebted to Dr. Steven M. de Jong, Utrecht University in The Netherlands and to Dr. Andreas Mueller of the German Aerospace Establishment (DLR) in Wessling, Germany for providing the 2003 HyMap images for this study. We are also indebted to Yves Blanca, IRD-UMR LISAH Montpellier, for the soil samples sampling in 2009 over the vineyard plain of Languedoc.
REFERENCES
Barnes, R.J., Dhanoa, M.S., and Lister, S.J., 1993. Correction to the description of standard normal variate (snv) and de-trend transformations in practical spectroscopy with applications in food and beverage analysis — 2nd edition. Journal of Near Infrared Spectroscopy, 1, 185–186.
Cichocki, A., Zdunek, R., Phan, A.H., and Amari, S., 2009. Nonnegative Matrix and Tensor Factorizations: Applications to Exploratory Multi-Way Data Analysis and Blind Source Separation, John Wiley and Sons.
Chang, C.-W. and Laird, D.A., 2002. Near-infrared reflectance spectroscopic analysis of soil C and N. Soil Science 167 (2), 110–116.
Chiang, L.H., Pell, R.J. and Seasholtz, M.B., 2003. Exploring process data with the use of robust outlier detection algorithms. Journal of Process Control 13 (5), 437–449.
Gomez, C., Coulouma, G., and Lagacherie, P., 2012. Regional predictions of eight common soil properties and their spatial structures from hyperspectral Vis–NIR data, Geoderma, Vol. 189–190, pp. 176-185.
Lagacherie, P., Gomez, C., Bailly, J.S., Baret F., and Coulouma G., 2010. Chapter 8: The use of Hyperspectral Imagery for Digital Soil Mapping in Mediterranean areas. In “Digital Soil Mapping: Bridging Research, Environmental Application, and Operation” Boettinger J., Howell, D., Moore, A., Hartemink A., Kienast-Brown, S. (ed.). Springer Verlag. pp 93 – 102.
Lee D.D. and Seung, H.S., 2001. Algorithms for non-negative matrix factorization. Advances in Neural Information Processing Systems, vol. 13, MIT Press, pp. 556–562.
Mark, H.L. and Tunnell, D., 1985. Qualitative near infrared reflectance analysis using Mahalanobis distances. Analytical Chemistry 57 (7), 1449–1456.
Meganem, I., Deville, Y., Hosseini, S., Deliot, P. and Briottet, X., 2014. Linear-Quadratic Blind Source Separation Using NMF to Unmix Urban Hyperspectral Images, Signal Processing, IEEE Transactions on , vol.62, no.7, pp.1822,1833.
Ouerghemmi, W., Gomez, C., Nacer, S. and Lagacherie, P., 2011. Applying Blind Source Separation on hyperspectral data for Clay content estimation over partially vegetated surface. Geoderma, Volume 163, Issues 3-4, 15 July 2011, p. 227-237.
Pearson, R.K., 2002. Outliers in process modeling and identification. IEEE Transactions on Control Systems Technology 10 (1), 55–63.
Savitzky, A. and Golay, M.J.E., 1964. Smoothing and differentiation of data by simplified least squares procedures. Analytical Chemistry 36 (8), 1627–1639.
Tenenhaus, M., 1998. La régression PLS, Edition TECHNIP.
Wold, S., Sjostrom, M. and Eriksson, L., 2001. PLS-regression: a basic tool of chemometrics. Chemometrics and Intelligent Laboratory Systems 58, 109–130.