CHANGE DETECTION WITH MULTI-SOURCE DEFECTIVE REMOTE SENSING
IMAGES BASED ON EVIDENTIAL FUSION
Xi Chen a, b, Jing Li * a, b , Yunfei Zhang a, b, Liangliang Tao a, b
a State Key Laboratory of Earth Surface Processes and Resource Ecology, 100875 Beijing, China b Academy of Disaster Reduction and Emergency Management , Beijing Normal University, 100875 Beijing, China
[email protected], [email protected]
Commission VII, WG VII/5
KEY WORDS: Change Detection, Multi-source Data, Evidential Fusion, Post-classification Comparison, Landslide
ABSTRACT:
Remote sensing images with clouds, shadows or stripes are usually considered as defective data which limit their application for change detection. This paper proposes a method to fuse a series of defective images as evidences for change detection. In the proposed method, post-classification comparison process is firstly performed on multi-source defective images. Then, the classification results of all the images, together with their corresponding confusion matrixes are used to calculate the Basic Belief Assignment (BBA) of each pixel. Further, based on the principle of Dempster-Shafer evidence theory, a BBA redistribution process is introduced to deal with the defective parts of multi-source data. At last, evidential fusion and decision making rules are applied on the pixel level, and the final map of change detection can be derived. The proposed method can finish change detection with data fusion and image completion in one integrated process, which makes use of the complementary and redundant information from the input images. The method is applied to a case study of landslide barrier lake formed in Aug. 3rd, 2014, with a series of multi-spectral images from different sensors of GF-1 satellite. Result shows that the proposed method can not only complete the defective parts of the input images, but also provide better change detection accuracy than post-classification comparison method with single pair of pre- and post-change images. Subsequent analysis indicates that high conflict degree between evidences is the main source of errors in the result. Finally, some possible reasons that result in evidence conflict on the pixel level are analysed.
* Corresponding author
1. INTRODUCTION
Change detection with remote sensing techniques are usually depend on images with precise registration, radiometric and atmospheric calibration, similar phenological states, similar spatial and spectral resolution if possible (Coppin P., 2004). However, the idealized data source is not always available due to the limitation of satellite revisiting period, the weather condition and the sensor defects. Applications such as disaster monitoring cannot wait for the acquisition of high-quality remote sensing images in a short time. As a matter of fact, multi-source data and even defective remote sensing images with thick cloud coverage (but parts of the images are clear), shadows or stripes (for instance, the ETM+ SLC-off data) are usually employed for change detection in emergency situation. Many works devoting to change detection are based on single pair of pre- and post-change images (or named bi-temporal change detection), which is the basic model of the technique (Coppin P., 2004). The result of change detection relies heavily on the quality of every input image, because any imprecise in classification, registration or calibration may influence the change detection accuracy (Lu D., 2004). In order to improve the detection accuracy, information fusion schemes have been proposed. The schemes of fusion multi-source data expand the application of change detection, and make it possible to use remote sensing images from different sensors (Nichol J., 2005, Xu M., 2009, Longbotham N., 2012, Liu Z., 2014); The schemes of combining multi-temporal data demonstrate that detailed spatial variations of objects can be measured with time series images; The schemes of fusing different change indexes
show that the false alarm and miss-detection levels can be reduced through a fusion of the complementary indices (Li J., 2003, Le Hégarat-Mascle S., 2004, Lunetta R. S., 2006, Du P., 2013). Consequently, change detection techniques based on fusion of multi-source data are very potential to achieve better detection accuracy, which take the advantages of redundant information in the input data. However, most of the related applications are based on the fusion of defect-free images. Researches about general methods that applicable for non-ideal data sources are still insufficient.
Image completion methods are commonly introduced to deal with remote sensing data covered by thick clouds, shadows or stripes. Defective parts in the images are completed or replaced by neighbouring pixels or the defect-free parts from other images (Zeng C., 2013). The failure of scan-line corrector (SLC) on the Enhanced Thermal Mapper Plus (ETM+) sensor of Landsat 7 in 2003 aroused the researches of gap filling methods for the SLC-off images. Subsequently, interpolation methods such as geostatistical interpolation were developed for gap filling of the SLC-off images (Pringle M.J., 2009). These approaches recover the missing pixels without referencing other data sources. However, they are not always valid for heterogeneous landscapes (Zeng C., 2013). Many researches demonstrate that the outcomes of image completion with auxiliary reference data for gap filling are better than non-referenced approaches if the auxiliary data are available (USGS, 2004). The auxiliary data can be multi-temporal images from the same sensor (Chen, J., 2011, Zeng C., 2013, Zhu, X., 2012a), or data from other sensors with similar spectral specifications (Roy D.P., 2008, Chen F., 2010). Some researches develop the
gap filling methods for thick cloud removal (Meng, Q., 2009, Zhu, X., 2012b), which generate the cloud-free composite scene by fusing multi-source images (Cihlar J., 1994, Le Hegarat-Mascle S., 1998, Song M., 2002, Luo Y., 2008). Image completion methods based on multi-source data has become the mainstream solution for gap filling and thick cloud or shadow removal, which benefit from the complement information provided by referencing data.
Even though both of the change detection and image completion can make use of multi-source data, their principles are different. Completing the defective parts of images is based on the assumption that the land covers have negligible change during the period of image acquisition, but the process is not necessary for change detection. On the contrary, the fusing or replacing processes may introduce false information to the original data. It is reasonable to consider if an integrated fusion method can be introduced for change detection without modifying the original defective input images. Suppose that the study area can be covered by defect-free parts of the input images in both dataset before and after change, on the one hand, zones with overlapping image parts can be fused to reduce the imprecision by mutual validation with redundant information, on the other hand, zones in defective part of images need a fusion process to obtain the complementary information from the other data sources, so that the uncertainty can be reduced. The mathematical theory of evidence introduced and extended by Dempster and Shafer (Shafer G., 1976), which is called Dempster-Shafer evidence theory, can combine evidences with imprecision or uncertainty to obtain a final decision. The method appears to be a more flexible and general approach than the Bayesian one (Le Hegarat-Mascle S., 1997). The theory has been developed as decision level image fusion method and can be used for change detection as well (Le Hégarat-Mascle S., 2004, 2006, Poulain V., 2009, Du P., 2013, Liu Z., 2014). Many researches take the advantage of Dempster-Shafer’s evidence theory in fusing redundant information, but ignoring the theory’s another specialty in filling up the missing information with the complementary part of data. This paper aims at developing a general change detection method that is feasible for multi-source images even when they are defective, such as partially covered by clouds, shadows or stripes.
2. METHODOLOGY
2.1 Calibration of Multi-source Remote Sensing Data Both image completion and change detection have some basic requirement for the input data. For instance, image registration, radiometric and atmospheric calibration are suggested as accuracy as possible. It is also highly recommended that images used for change detection are with similar phenological states, and similar spatial and spectral resolution. If the change detection algorithm is post-classification comparison, then the requirement for data calibration can be more flexible than other methods based on spectral features, because the classification can be operated independently for every image. This characteristic makes the post-classification comparison method a widely used algorithm, which has been successfully applied for land-cover change detection with heterogeneous data (Lu D., 2004, Xu M., 2009).
2.2 Post-classification Comparison
If the purpose of change detection is recognizing the land use and land cover (LULC) conversion from one category to another, the post-classification comparison is compatible. The
method can minimize the impacts of atmospheric, sensor and environmental differences between the input images, and the final accuracy depends on the quality of the classified image of each date (Coppin P., 2004). Most of the common classification algorithm is optional for the method.
Denote and the set of categories of the classification result before and after change, respectively. The categories are denoted as follows:
0, , , ,1 2
p
0, , ,1 2
q
Where p,q=number of categories before and after change;
x
,
y= the tag of categories;
0,
0= the tag of unknown categories that result from image defects;The change detection result can be denoted as follows: 0 0
The change vector will be determined for each pixel in the final change detection map.
Denote Tt=the classified image after classification;
t
p =the corresponding confusion matrix of Tt;
t
T and ptshould be kept as intermediate results for further processes. Where t{ , }t t0 1 , and t0,t1 are the time labels before and after change;
2.3 Dempster-Shafer Evidential Fusion
2.3.1 Representation of Evidence: According to Dempster-Shafer evidence theory, can be considered as the frame of discernment which is a set of hypothesis.
Denote N = the number of elements in
Where N (p1) (q1)
Elements in are considered as single hypothesis, and the union of single hypothesis which belongs to the subset of are named compound hypotheses. The empty set , universal set , single hypothesis
x, y , or compound hypotheses such as
x, y
x1,
y are also subsets of . The Basic Belief Assignment (BBA) in Dempster-Shafer evidence theory measures evidences by assigning its beliefs over thesub
sets of . value has to be limited to [0, 1] interval (Le Hegarat-Mascle S., 1997). There are:2.3.2 Modelling of Basic Belief Assignment (BBA): The definition of BBA relates to the application and the character of data source. In this paper, change detection is considered as a classification problem of detecting the categories of land-cover change vectors. The BBA can be calculated based on the confusion matrixes of every classified image, this approach has been proved to be feasible for classification (Elouedi Z., 2010). The classification process provides the classified image
T
t , which means each pixel in the images gets a detected class, the detected class before and after change forms a detected change vector, denoted as( , )
x y . The unavoidable classification error makes the detected change vector( , )
x y imprecise. It is reasonable to believe that the detected change vector is not absolutely reliable, and may correspond to other possible real change vector
a,
b
as denoted in section 2.2.In order to measure the belief value of a detected change vector, the confusion matrixes
p
t0 andp
t1 (correspond to the pre- and post-change classified imageT
t0andT
t1) should be converted to the prediction positive rates as follows:0 pixels classified as class
xand
y while their ground-true class are
aand
b.According to Dempster-Shafer’s theory, the summation of the BBAs should satisfy
equation
(1), denoting that:(
a,
b)
a bM
m
(4)Then the BBAs should be normalized as follows:
0 1
2.3.3 Evidential Fusion based on Combination Rules: The Dempster-Shafer evidence theory has provided the basic evidence combination rules to combine the BBAs of different evidences (Shafer G., 1976). As described in the previous paragraph, each pair of pre- and post-change images provides a detected change vector for every pixel. If more pairs of images are introduced to produce evidences for a pixel, there will be a series of BBAs that can be fused for better estimation of the change vectors.
Assuming that there are two pairs of pre- and post-change images, each of them provides the BBAs of a pixel following equation (5), denote as follows:
1
[ ( ), ( ), , ( ), ( )]
1 1 1 2 1 k 1The fusion of two evidences can be represented by combination of BBAs as follows: difficulty in combining them.
The combination rule can be extended for fusing more
uncertainty of the real land-cover change type on the pixels. According to the combination rule in equation (6), the value of
( )
m
may accumulate in the combination process untilenough evidences with certain information are combined. In order to reduce the influence of uncertain information and increase the certainty in the evidence combination process, the correction of BBAs for pixels in defective parts of images should be introduced. Assuming that the defective parts in the images are with equal possibility to be any land-cover category, their BBA values
m
( )
can be redistributed as follows:The correction of BBAs redistributes the uncertainty degree to BBAs of other single hypothesis, eliminating the uncertainty caused by image defects with speculation, which is based on the uniform distribution principle. It is easy to prove that
m
*is a Basic Belief Assignment (BBA) after a comparison with equation (5). Consequently, the combination rules expressed by equation (6), (7) and (8) are still applicable for the corrected BBAs.2.4 Decision Making
The decision making process is operated after evidential fusion to decide which single hypothesis should be supported, and the criterion is called “decision rule”. The choice of this criterion is
application dependent, and the three most popular decision rules are: 1) maximum of plausibility; 2) maximum of belief; 3) maximum of belief without overlapping of belief intervals (Le Hegarat-Mascle S., 1997). In this paper, we follow the “maximum of belief” rule to decide the land-cover change type for every pixel as follows:
( ) max{c ( )}i
i
Bel A Bel A (10)
Where the belief function Belis defined as:
( ) ( )
B A
Bel A m B
( A ) (11)The “maximum of belief” rule indicates that after the combination of BBAs for a pixel, the land-cover change type with the maximum belief function value is the final decision.
2.5 Global algorithm of the proposed method
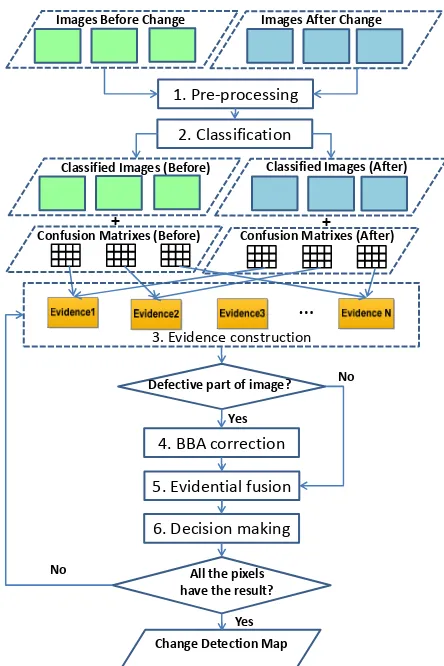
Global algorithm of the proposed method is illustrated in Figure 1. The process can be described as follows:
Step 1: Preparing the input data. Choosing the most suitable
data for the application, defect-free parts of the images should make a full coverage of the study area in both dataset of before and after change. Registration of the input images is necessary for change detection;
Step 2: Classification of the input images. Setting the
classification algorithm, the maximum number of classes, and the definition of land-cover categories based on the application. Performing classification process to all the pre- and post- change images, the classified images can be derived. Using ground truth data to calculate the confusion matrixes of the images with post-classification statistic;
Step 3: Evidence construction. Selecting a pair of pre- and
post-change classified images with no repeat, after comparison between the two images, a change vector can be detected for every pixel. Repeating the process until all the pair-wises of images are used, and then the BBAs for each detected change vectors can be calculated following equations (2)-(5). If a pixel is located in defective part of any input image go to Setp 4.
Otherwise, directly go to Step 5;
Step 4: Correcting the BBAs for pixels located in the defective
part of any image following equation (9), and then go to Step 5; Step 5: Operating evidential fusion based on the combination
rules for every pixel following equations (6)-(8), then the fused BBAs of all the pixels can be derived;
Step 6: Making the final decision of land-cover change type for
every pixel, until all the pixels get the change detection decision. At last, the final change detection map can be derived.
3. APPLICATION OF THE METHOD FOR CHANGE
DETECTION OF LANDSLIDE BARRIER LAKE 3.1 Data and Study Area
The Ms 6.5 earthquake took place in Ludian county, Yunnan Province, China, on 3rd August, 2014. The disaster triggered a number of landslides, one of which formed a barrier lake on the Niulan River. The barrier lake was formed in the afternoon on 3rd August, and the flooded area changed little since a spillway is finished on 17th August, the water level didn’t fell until mid-September after another spillway is finished.
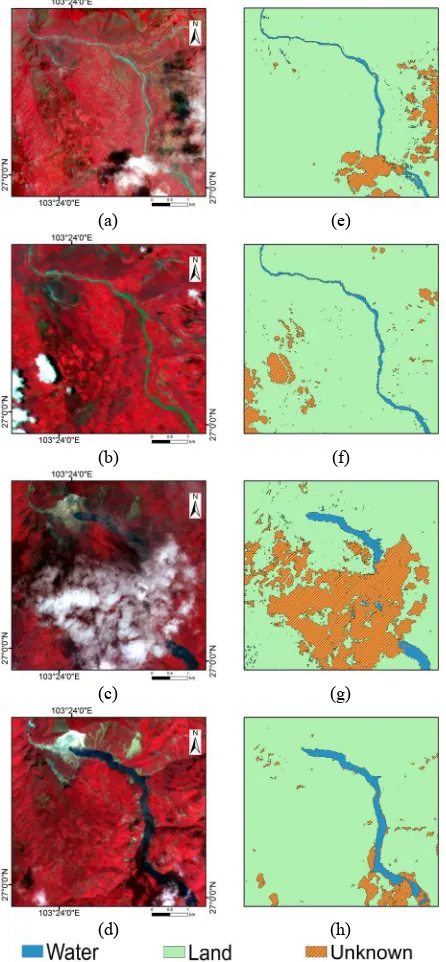
Images that used for the disaster monitoring at that time are 4 images from the multi-spectral sensors of GF-1. Two of the images are acquired before disaster on Jun. 25th, Jul. 23rd, from PMS2 and WFV1 sensor, respectively. The other two images are acquired after the disaster on Aug. 5th and Sep. 11th, from
PMS2 and WFV3 sensor, respectively. Every image was partially covered by thick cloud over the Niulan River but located in different zones (see in Figure 2). All of the related 3 sensors have 4 bands, the resolution of the PMS2 is 8 meters and the resolution of WFV1 and WFV3 are both 16 meters. Some basic specifications of the data are listed in Table 1.
3.2 Data Processing
The main data processing of detecting the landslide barrier lake include image pre-processing, supervised classification, evidential fusion, and decision making.
3.2.1 Image pre-processing: The main pre-processing of the image are registration and resampling. The ground control points (GCPs) are manually selected and distributed evenly in the images for registration, including corners of buildings and cropland, road intersections, and so on. All the images are resampled to 5 meters to facilitate the geometric registration. The polynomial algorithm is chosen as the warp method for registration. Restricted by the image resolution, the mean absolute error of registration is 9.78 meters.
Images Before Change
1. Pre‐processing
…
Defective part of image?
Change Detection Map
2. Classification
Images After Change
Classified Images (Before) Classified Images (After) +
Confusion Matrixes (Before) Confusion Matrixes (After)
No
4. BBA correction
5. Evidential fusion
6. Decision making
All the pixels have the result? No
Yes
+
Yes
3. Evidence construction
Figure 1. Workflow of the proposed method for change detection
Specification Parameter
Data Tag (a) (b) (c) (d)
Acquisition Date 2014-06-25 2014-07-23 2014-08-05 2014-09-11
Sensor PMS2 WFV1 PMS2 WFV3
Resolution(m) 8 16 8 16
Number of band 4 4 4 4
Image Defect (8.8%) Cloud (6.8%) Cloud (28.4%) Cloud (5.5%) Cloud Table 1. Basic specifications of the multi-source data
3.2.2 Supervised classification and class combination: In order to guarantee good classification accuracy, every input image is classified independently to 7 classes, namely: water, watercourse, vegetation, bared land, built-up land, clouds and shadows, and then combined to 3 classes: (1) Water (rivers and watercourse); (2) Land (vegetation, bared land and built-up land); (3) Unknown (clouds and shadows). The categories of the classification can be defined as:
= Water,Land, Unknown
A supervised classification algorithm, Maximum Likelihood Classification (MLC), is chosen as the classification method. The samples per class used for training and constructing the confusion matrix are chosen based on visual interpretation, and the datasets of training and testing samples are with no overlap. The classification results are shown in Figure 2 and the evaluation of classification accuracy is listed in Table2.
3.2.3 Evidential fusion on the pixel level: Using image pairs (a) and (c), (a) and (d), (b) and (c), (b) and (d) for post-classification comparison (see in Figure 3). Denoting the classes in the classification results are as follows:
1, 1Water,2, 2 Land
,
0, 0Unknown . Where,
representsthe class in pre-disaster image; and
represents the class in post-disaster image.Every image pair can provide a change detection map. There are 9 types of land-cover change vectors in the map, 4 of them are certain change vectors:
2,
1
corresponds to “Flooded”;
1, 2 corresponds to “Blocked”;
1, 1 and
2, 2 correspond to “Unchanged”. While the other 5 vectors which include Unknown class in the vector (for example
1, 0), are corresponding to “Unknown” change type. Then the frame of discernment in this application can be defined as:{Flooded,Blocked,Unchanged}
The Unknown type means the real land-cover change is one of the elements in the frame of discernment, denoted by. The detected change vectors in the map will assign their belief values to the frame of discernment, which are represented by a row vector of BBAs. For pixels in no-defective parts, the BBAs can be calculated following equations (2)-(5):
[ (Flooded), (Blocked), (Unchanged), ( )]
E m m m m
For pixels in defective parts, the BBAs should be corrected following equation (9):
* * * *
[ (Flooded), (Blocked), (Unchanged), ( )]
E m m m m
The evidential fusion for each pixel based on m( ) or
*( )
m follows the equation (6)-(8).
3.2.4 Decision making on the pixel level: Determining the land-cover change type for every pixel based on the “maximum of belief” rule following (10)-(11). After the decision making process the final change detection map can be derived.
The evidential fusion and decision making process can be integrated on the pixel level. What’s more, on the image level the process can be further accelerated through simply assigning the same BBAs and determined land-cover change type to pixels with the same classification result in every image. The reason lies in the fact that pixels with the same class in every input image will produce the same detected change vectors, BBAs, and determined land-cover change type based on the same evidential fusion rule and the decision making rule.
(a) (e)
(b) (f)
(c) (g)
(d) (h)
Figure 2. Remote sensing images of the study area (by false colour composition) and their corresponding classification result. (a) Pre-disaster image of 2014-06-25. (b)Pre-disaster image of 2014-07-23. (c) Post-disaster image of 2014-08-05. (d) Post-disaster image of 2014-09-11. (e), (f), (g), (h) classification result of (a), (b), (c), (d), respectively.
Image
tag User accuracy (%)
Overall accuracy (%)
Kappa coefficient Water Land Unknown
(a) 96.50 96.71 71.18 84.77 0.7385 (b) 91.48 99.51 90.98 95.96 0.9276 (c) 94.45 99.78 82.85 92.45 0.8821 (d) 97.73 99.96 66.89 92.55 0.8712 *The image tags are corresponding to Figure 2.
Table 2. Accuracy evaluation result of the Maximum Likelihood Classification
3.3 Results and Discussion
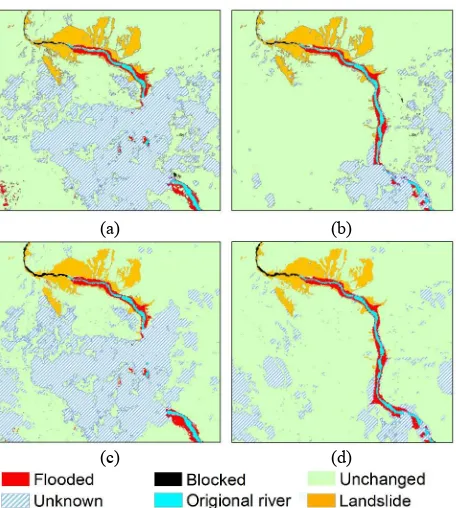
Change detection result of the proposed method is illustrated in Figure 4-(a), the ground truth is shown in Figure 4-(b) for comparison. The Ground truth is manually interpreted based on parts of all the four images where there is no cloud coverage. In Figure 3 and Figure 4, the Original river (blue) and Landslide area (yellow) are added manually based on the ground truth in order to show the relative position of the detected flooded and blocked areas. Comparing the result of the proposed method in Figure 4-(a) and post-classification comparison result with 4 different pairs of pre- and post-disaster images in Figure 3, there is no Unknown pixel in Figure (4), which means that all the pixels have got a certain decision of the land-cover change type. While in Figure 3 the percentage of Unknown area in post-classification comparison results of (a)-(c), (a)-(d), (b)-(c), (b)-(d) are 39.91%, 16.06%, 37.47%, and 13.74%, respectively. Without counting the Unknown parts in the images, we use the user’s accuracy of each land-cover change type, overall accuracy, and kappa coefficient as indexes to compare the performance of the proposed method and post-classification comparison method, the results are listed in Table 3. The user’s accuracy of Flooded and Blocked change type provided by the proposed method are better than the other 4 results. What’s more, the overall accuracy and kappa coefficient of the result by the proposed method is the second best among all the results. Table 3 indicates that the proposed method can not only complement the detective parts of remote sensing images, but also fuse the redundant parts of the images to promote change detection accuracy.
Through comparing the change detection result in Figure 4-(a) and the ground truth in in Figure 4-(b), the location of miss-detected (false negative error) and false-miss-detected (false positive error) pixels are shown in Figure 5. Only 0.07% of the
non-disaster areas are false-detected as non-disasters; 21.30% of the flooded area and 2.07% of the blocked area are miss-detected. Detailed observation find that there are some massive areas of detection in the change detection result such as the detected area marked in zone I and II in Figure 5. The miss-detected part in zone I is classified as land in both of the post-disaster images, results from the false classification of floating objects that stacked in the downstream of the barrier lake; The miss-detected part in zone II is bare soil before disaster but misclassified as watercourse in image (a) (see in Figure 2-(e)), even though this part is correctly classified in image (b) (see in Figure 2-(f)). The proposed method fail to distinguish the conflicting change detection results provided by (a)-(c) and (b)-(d), as shown in Figure 3-(a) and Figure 3-(c).
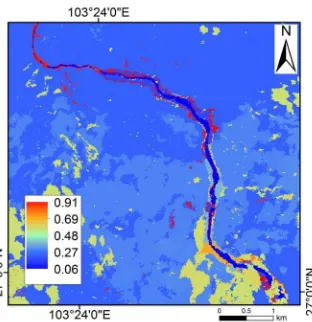
Based on the Dempster-Shafer evidence theory, high conflict between the evidences may lead to unreasonable decision. In order to analyse the distribution of errors in the result, the conflict degree values K of all the pixels are calculated
following equation (7) and illustrated in Figure 6.
(a) (b)
(c) (d)
Figure 3. Post-classification comparison result with single pair of pre- and post-disaster images. (a) Detection result with (a) - (c) in Figure 2; (b) Detection result with (a) - (d in Figure 2; (c) Detection result with (b) - (c) in Figure 2; (d) Detection result with (b) - (d) in Figure 2.The original river (blue) and landslide area (yellow) are added manually based on the ground truth.
(a) (b)
Figure 4. Change detection result of the proposed method and the ground truth. (a) Detection result of the proposed method (The original river (blue) and landslide area (yellow) are added manually based on the ground truth); (b) The ground truth provided by manual interpretation.
Figure 5. Location of change detection errors in the result of the proposed method.
Method Input data User’s accuracy (%) accuracyOverall (%)
Kappa coefficient Flooded Blocked Unchanged
Post-classification
comparison
(a) - (c) 74.99 67.28 99.05 98.24 0.7275 (a) - (d) 81.68 75.86 99.37 98.86 0.7952 (b) - (c) 86.67 66.29 99.33 98.85 0.8172 (b) - (d) 92.97 70.87 99.51 99.26 0.8764 Evidential
Fusion (a), (b), (c), (d) 99.76 77.76 99.28 99.22 0.8528
Table 3. Performances of the landslide barrier lake detection with different methods and input data.
Statistic of the conflict degree values in Figure 6 shows that 85.07% of the pixels in the entire image are with low conflict degree (K0.3), 14.93% of the pixels are with high conflict
degree (K0.5). Among all the pixels with low conflict
degree values, 99.75% are correctly detected, only 0.23% of them are miss-detected, and 0.02% of them are false-alarmed; among all the pixels with high conflict degree values, 96.21% are correctly detected, the miss-detection rate is 3.42%, and the false-alarm rate is 0.37%. The low conflict pixels are mostly located on the original river course and unchanged areas, while high conflict pixels are mainly located at the edge of the barrier lake and the border of land and water. Pixels with high conflict degrees are more likely to result in miss-detection and false-alarm.
Some possible reasons may lead to high evidence conflict degree on a pixel:
(1) High registration error will result in conflict at the interface areas of different land cover class;
(2) The resolution difference of multi-source images can cause conflict at the edge of ground objects;
(3) Misclassification may lead to inconsistency between the evidences of a pixel. For example, if a pixel is misclassified, but the classification accuracy of the incorrect class is high in that image (the dominant image), the land cover change type of that pixel will be incorrectly discriminated;
(4) Land cover change during the acquisition time of pre- or post-change images may lead to conflict at the edge of the changed area. For example, the water level changed slightly from Aug. 5th to Sep. 11th and results in the difference of flooded area in image (c) and (d), the land cover difference between post-disaster images will lead to evidence conflict on pixels around the flooded area.
4. CONCLUSION
Change detection based on remote sensing images relies heavily on the quality of input data. However, satellite revisiting period, weather conditions and sensor defects usually limit the application of remote sensing images. Multi-source remote sensing data provide the second choice to remedy the defects of images for change detection, especially in emergency situations. This paper proposes a method that can finish data fusion and image completion in one integrated process with multi-source defective images. On the one hand, land-cover change types in defective parts of the input images are complemented through the BBA correction process. On the other hand, redundant parts of the input images are fused through the evidence combination
process. Application on a study case of barrier lake monitoring indicates the effectiveness and flexibility of the proposed method. The method can not only complement the detective parts of multi-source images but also fuse the redundant parts of images to promote change detection accuracy.
Good performance of the proposed method benefits from the Dempster-Shafer evidential fusion framework which can properly deal with the imprecise and uncertain information from multi-source data. Subsequent analysis shows that high conflict between evidences is the main source of miss-detection and false-alarm. Further, many reasons lead to high conflict degrees on the pixel level, including high registration error, resolution difference of multi-source images, classification error in the dominant image, and land cover change during the acquisition time of the fused data. Specific ways to reduce the conflict degree between evidences and to improve the performance of the proposed method deserve further study in the future.
ACKNOWLEDGEMENTS
This work was supported in part by the National Natural Science Foundation of China, No. 51379104, No. 41571342 and No.41171318, and the Fundamental Research Funds for the Central universities of China, No. 2014KJJCA16.
The Authors would like to thank A.P. Weiguo Jiang and Dr. Hongkui Zhou from State Key Laboratory of Earth Surface Processes and Resource Ecology, Beijing Normal University, for their constructive comments.
REFERENCES
Chen F., 2010. Exploitation of CBERS-02B as Auxiliary Data in Recovering the Landsat7 ETM+ SLC-off Image. 2010 18TH INTERNATIONAL CONFERENCE ON GEOINFORMATICS, pp.1-6.
Chen, J., 2011. A simple and effective method for filling gaps in Landsat ETM+ SLC-off images. Remote Sens. Environ., 115(4), pp. 1053-1064.
Cihlar J., 1994. Detection and removal of cloud contamination from AVHRR images. IEEE Trans. Geosci. Remote Sens., 32(3), pp. 583-589.
Coppin P., 2004. Digital change detection methods in ecosystem monitoring: a review. Int. J. Remote Sens., 25(9), pp. 1565-1596.
Du P., 2013. Information fusion techniques for change detection from multi-temporal remote sensing images. Information Fusion, 14(1), pp. 19-27.
Elouedi Z., 2010. Discountings of a belief function using a confusion matrix. In 22nd International Conference on Tools with Artificial Intelligence (ICTAI 2010), Arras, France, vol. 1, pp. 287-294.
Le Hegarat-Mascle S., 1997. Application of Dempster-Shafer evidence theory to unsupervised classification in multisource remote sensing. IEEE Trans. Geosci. Remote Sens., 35(4), pp. 1018-1031.
Le Hegarat-Mascle S., 1998. Introduction of neighborhood information in evidence theory and application to data fusion of Figure 6. Spatial distribution of conflict degrees between the
input images.
radar and optical images with partial cloud cover. Pattern Recogn., 31(11), pp. 1811-1823.
Le Hégarat-Mascle S., 2004. Automatic change detection by evidential fusion of change indices. Remote Sens. Environ., 91(3-4), pp. 390-404.
Le Hegarat-Mascle S., 2006. Performance of change detection using remotely sensed data and evidential fusion: comparison of three cases of application. Int. J. Remote Sens., 27(16), pp. 3515-3532.
Li J., 2003. A shape-based approach to change detection of lakes using time series remote sensing images. IEEE Trans. Geosci. Remote Sens., 41(111), pp. 2466-2477.
Liu Z., 2014. Change detection in heterogeneous remote sensing images based on multidimensional evidential reasoning. IEEE Geosci. Remote Sens. Lett., 11(1), pp. 168-172.
Longbotham N., 2012. Multi-modal change detection, application to the detection of flooded areas: outcome of the 2009–2010 data fusion contest. IEEE J. Sel. Topics Appl. Earth Observ. in Remote Sens., 5(1), pp. 331-342.
Lu D., 2004. Change detection techniques. Int. J. Remote Sens., 25(12), pp. 2365-2401.
Lunetta R. S., 2006. Land-cover change detection using multi-temporal MODIS NDVI data. Remote Sens. Environ., 105(2), pp. 142-154.
Luo Y., 2008. Developing clear-sky, cloud and cloud shadow mask for producing clear-sky composites at 250-meter spatial resolution for the seven MODIS land bands over Canada and North America. Remote Sens. Environ., 112(12), pp. 4167-4185. Meng, Q., 2009. Closest Spectral Fit for Removing Clouds and Cloud Shadows. Photogrammetric Engineering and Remote Sensing, 75(5), pp.569-576.
Nichol J., 2005. Satellite remote sensing for detailed landslide inventories using change detection and image fusion. Int. J. Remote Sens., 26(9), pp. 1913-1926.
Poulain V., 2009. Fusion of high resolution optical and SAR images with vector data bases for change detection. In Proc. Int. Geosci. Remote Sens. Symp. (IGARSS), Cape Town, South Africa, vol. 1, pp. 3336-3339.
Pringle M.J., 2009. Geostatistical interpolation of SLC-off Landsat ETM+ images. ISPRS Journal of Photogrammetry and Remote Sensing, 64(6), pp. 654-664.
Roy D.P., 2008. Multi-temporal MODIS–Landsat data fusion for relative radiometric normalization, gap filling, and prediction of Landsat data. Remote Sens. Environ., 112(6), pp. 3112-3130.
Shafer G., 1976. A Mathematical Theory of Evidence. Princeton, NJ: Princeton University press.
Song M., 2002. A knowledge-based approach for reducing cloud and shadow. In Proc. ASPRS-ACSM Annual Conference and FIG XXII Congress, Washington DC, USA, pp. 22-26.
USGS, 2004. Phase 2 gap-fill algorithm: SLC-off gap-filled products gap-fill algorithm methodology. (28 Nov. 2010). landsat.usgs.gov/documents/L7SLCGapFilledMethod.pdf
Xu M., 2009. Change detection of the tangjiashan barrier lake based on multi-source remote sensing data. In Proc. Int. Geosci. Remote Sens. Symp. (IGARSS), Cape Town, South Africa, vol. 1, pp. 2683-2686.
Zeng C., 2013. Recovering missing pixels for Landsat ETM+ SLC-off imagery using multi-temporal regression analysis and a regularization method. Remote Sens. Environ., 131, pp. 182-194. Zhu, X., 2012a. A new geostatistical approach for filling gaps in Landsat ETM+ SLC-off images. Remote Sens. Environ., 124, pp. 49-60.
Zhu, X., 2012b. A Modified Neighborhood Similar Pixel Interpolator Approach for Removing Thick Clouds in Landsat Images. IEEE Geosci. Remote Sens. Lett., 9(3), pp. 521-525. ISPRS Annals of the Photogrammetry, Remote Sensing and Spatial Information Sciences, Volume III-7, 2016