TESTING THE GENERALIZATION EFFICIENCY OF OIL SLICK CLASSIFICATION
ALGORITHM USING MULTIPLE SAR DATA FOR DEEPWATER HORIZON OIL SPILL
C. Ozkan1, B. Osmanoglu2, F. Sunar3, G. Staples4,K. Kalkan3, F. Balık Sanlı5
1
Erciyes University, Engineering Faculty, Geodesy and Photogrammetry Engineering Dept., 38039 Kayseri, Turkey,
[email protected]
2
University of Alaska - Fairbanks, P.O. Box 757320, Fairbanks AK 99775, [email protected]
3Istanbul Technical University, Civil Engineering Faculty, Geomatics Engineering Dept., 34469 Maslak Istanbul,
Turkey, [email protected], [email protected]
4
MDA,13800 Commerce Parkway, Richmond, V7S 1L5, Canada, [email protected]
5Yıldız Technical University, Civil Engineering Faculty, Geodesy and Photogrammetry Eng
ineering Dept., Davutpasa
Campus, 34220 Esenler, Istanbul, Turkey, [email protected]
Commission VII, WG VII/2
KEYWORDS: Marine pollution, Oil spill classification, Generalization, SAR
ABSTRACT:
Marine oil spills due to releases of crude oil from tankers, offshore platforms, drilling rigs and wells, etc. are seriously affecting the fragile marine and coastal ecosystem and cause political and environmental concern. A catastrophic explosion and subsequent fire in the Deepwater Horizon oil platform caused the platform to burn and sink, and oil leaked continuously between April 20th and July 15th of 2010, releasing about 780,000 m3 of crude oil into the Gulf of Mexico. Today, space-borne SAR sensors are extensively used for the detection of oil spills in the marine environment, as they are independent from sun light, not affected by cloudiness, and more cost-effective than air patrolling due to covering large areas. In this study, generalization extent of an object based classification algorithm was tested for oil spill detection using multiple SAR imagery data. Among many geometrical, physical and textural features, some more distinctive ones were selected to distinguish oil and look alike objects from each others. The tested classifier was constructed from a Multilayer Perception Artificial Neural Network trained by ABC, LM and BP optimization algorithms. The training data to train the classifier were constituted from SAR data consisting of oil spill originated from Lebanon in 2007. The classifier was then applied to the Deepwater Horizon oil spill data in the Gulf of Mexico on RADARSAT-2 and ALOS PALSAR images to demonstrate the generalization efficiency of oil slick classification algorithm.
INTRODUCTION
Marine oil spills, a form of pollution, caused by releases of crude oil from tankers, offshore platforms, drilling rigs and wells, etc. can seriously affect the fragile marine and coastal ecosystem and cause political and environmental concern. The amount of oil spilled annually worldwide has been estimated at more than 4.5 million tons (Bava et al., 2002). The Deepwater Horizon oil spill (also referred to as the Gulf of Mexico oil spill) happened on April 20, 2010, is the largest accidental marine oil spill in the history of the USA petroleum industry. The resulting oil slick quickly expanded to cover hundreds of square miles of ocean surface, being a threat to marine life and adjacent coastal wetlands and to the Gulf's fishing and tourism industries.
For rapid emergency response activities, four basic issues; i) prevention ii) alarm, iii) monitoring and iv) damage quantification, should be planned carefully (Bava et al., 2002). In order to lessen its effect, the improvement of its detection and continuous monitoring are the most important issues to effectively plan countermeasures responses. Today, remote sensing technology is being used for this purpose over the past decade. Synthetic Aperture Radar (SAR) satellites are often preferred to optical sensors due to the all weather and all day capabilities and being used to detect the oil spills discharged into the sea with sufficient accuracies (Solberg et al., 2007). Oil-Spill detection procedures in SAR data generally comprise segmentation, feature extraction and classification stages (Solberg et al., 2007; Brekke and Solberg, 2005).
The backscatter energy level for oil-spilled areas received in SAR systems is too low since the oil dampens the capillary waves of the sea surface. However, there is a serious problem that the other natural phenomenas also dampen the short waves and create dark areas on the sea surface due to suspension of Bragg scattering mechanism depending to ocean and/or atmospheric conditions, (Solberg et al. 2007). Thus, the dark image regions of which the probabilities of being either oil spill or alike are high must be segmented. These segmented parts of original images are used to obtain the features of shape, contrast and textural characteristics. In terms of these features, some classification algorithms based on statistical, neural, fuzzy, rule based, boosting algorithms etc. are used for identification of the dark areas in a manner of binary classification, i.e. oil or alike (Fiscella et al., 2000; Del Frate et al., 2000; Solberg et al., 1999; Keramitsoglou et al., 2006; Ramalho and Medeiros, 2006).
images to demonstrate the generalization efficiency of oil slick classification algorithm.
STUDY AREA and DATA USED
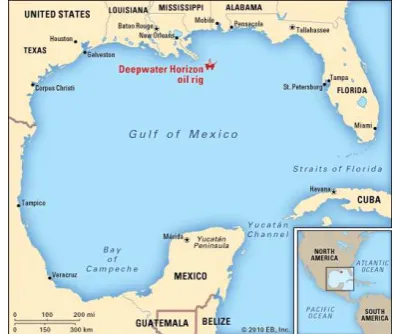
The Deepwater Horizon is a 9-year-old semi-submersible mobile offshore drilling unit that could operate in waters up to 2,400 m deep and drill down to 9,100 m. At the time of the explosion, it was drilling an exploratory well at a water depth of approximately 1,500 m in the Gulf of Mexico about 66 km off the Louisiana coast of the United States (Figure 1).
Figure 1. Map of the study area (Encyclopaedia Britannica).
In this study, as an active sensing system, 2 SAR (Radarsat -2 and ALOS PALSAR) images acquired on the same date were used in the analyses (Table 1).
Table 1. The characteristics of the radar dataset used.
METHODOLOGY
Radar images have an advantage for oil spill detection due to the dampening effect of oil on capillary waves causing them to be detectable as black patches on images. However, SAR images must be processed carefully since the dark areas might occur because of some natural phenomena without oil like smooth water (low wind areas), organic films, wind front areas, areas sheltered by land, rain cells, grease ice, internal waves and shallow bathymetric features (Sabins, 1997; Alpers et al., 1991; Hovland et al., 1994). The procedure steps of oil spill detection in SAR data can be generalized as segmentation (dark object extraction), feature extraction and classification (determination oil) stages (Pavlakis et al., 2001; Brekke and Solberg, 2005; Solberg et al., 2007; Shi et al., 2008; Topouzelis et al., 2009).
Before the procedure steps, all SAR imagery used in this study was calibrated to obtain Normalized Radar Cross
Section (NRCS, σ0) values. The NRCS calibrations correct
the radar imagery for the effects of antenna pattern and local incidence angle. Calibration of ALOS SAR images was done using Gamma Interferometric SAR Processor, while the RADARSAT-2 images were calibrated using the look-up table provided in the products meta-data.
Segmentation
Segmentation can be defined as the subdivision of original image into small and homogeneous regions that correspond to individual surfaces, objects, or natural parts of objects (Figure 2). Since the segments, composed by pixels, provide spectral and geometric information, the parameters extracted
from shape (area, length, etc.) and neighbor’s relationship can
be included on classification strategies to promote better discrimination of objects with similar spectral responses. In this study, segmentation of dark objects from the others was done by object-based classification using eCognition software.
Figure 2. Objects from ALOS PALSAR (left) and RADARSAT-2 (right).
In the segmentation process, “multi-resolution segmentation” procedure of object based image analysis concept (OBIA) was applied. For the SAR images used, scale factor was chosen very small to obtain correct oil spill features in the images; (25 for ALOS and 15 for RADARSAT-2). After segmentation process, classification process was done by using class features defined in class hierarchy. For classifications of the oil objects, mean layer value of each object was used with a defined threshold. By using process based classification tree, all processes were programmed in a suitable order and then the mask image of oil objects was exported as a final step.
Feature ExtractionIn general, the features of oil spill are its geometric characteristics (such as area, perimeter, complexity), physical behaviours (such as mean, standard deviation or max backscatter value) and context (such as number of other dark formations, presence of ships and proximity to and route of ships) (Del Frate et al., 2000, Karathanassi et al., 2006, Brekke and Solberg, 2005). Moreover, Haralick textural features computed based on Haralick's cooccurence matrix are widely used (Haralick, 1979), such as angular second moment, contrast, correlation, dissimilarity, entropy, mean and standard deviation (Assilzadeh and Mansor, 2001).
The widely used textural features are;
- SP2 (Shape factor 2) describes the general shape of the
object which is also called as ‘first invariant planar moment’, ‘form factor’, and ‘asymmetry’.
- BSd (Background Standard deviation) is the standard deviation of the intensity values of the pixels belonging
to the region of interest, selected by the user surrounding the object.
- ConLa (Local area contrast ratio) is the ratio between the mean backscatter value of the object and the mean backscatter value of a window centred at the region. - Opm (Object power to mean ratio) is the ratio between
standard deviation of the object and the mean of the object.
- Opm/Bpm (Power to mean ratio) is the ratio between the object power to mean ratio and the background power to mean ratio.
- OSd (Object standard deviation) is the standard deviation of the object.
- P/A (Perimeter to area ratio) which is the ratio between the perimeter (P) and the area (A) of the object.
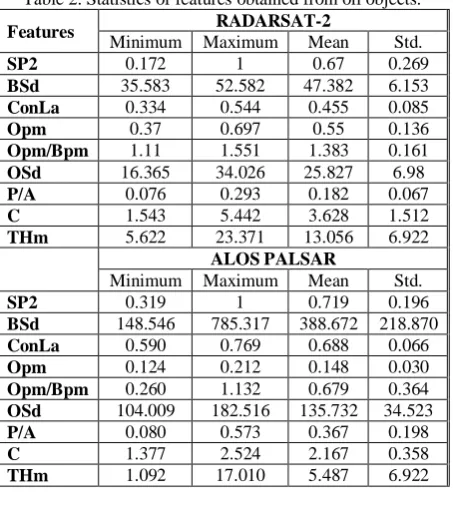
- C (Object complexity) describes how simple (or complex) characteristics; BSd, ConLa, Opm, Opm/Bpm, and OSd were used for physical characteristics, and THm was used for textural characteristic (Topouzelis et al., 2009, Ozkan et al., 2011). Totally 7 oil objects from RADARSAT-2 and 8 oil objects from ALOS PALSAR were extracted. All of these objects are used for the testing purpose. The statistics of oil objects are given in Table 2.
Table 2. Statistics of features obtained from oil objects.
Features RADARSAT-2
Artificial neural networks are computational systems based on the principles of biological neural systems, i.e. it is a mathematical model composed of many neurons operating in parallel. These networks have the capacity to learn, memorize and create relationships amongst data. They have some advantages such as their non-parametric and non-linear nature, arbitrary decision boundary capabilities, easy adaptation to different types of data and input structures, and good generalization capabilities over classical statistic and analytic approaches. Although the network design as a
classifier is a hard task despite the increment in the performance of classification, an approach for oil spill detection based on a Multilayer Perceptron (MLP) neural network are described in recent research studies (Del Frate et al., 2000), (Topouzelis et al., 2005). The optimization process to determine weight and bias parameters of ANN is called learning. Backpropagation Delta rule (BP) is the most well known learning algorithm. Besides to derivative based conventional approaches such as Levenberg-Marquardt (LM), some heuristic optimization methods such as Genetic Search have been used in learning phase of ANN, as well. Artificial Bee Colony (ABC) is such an optimization method that can be used for ANN. Artificial Bee Colony algorithm is a new meta-heuristic population based swarm intelligence algorithm developed by Karaboga (2005). The ABC algorithm mimics the intelligent foraging behaviour of honeybee swarms. The first researches about ABC algorithm focused into examining the effectiveness of ABC for constrained and unconstrained problems against other well-known modern heuristic algorithms such as Genetic Algorithm (GA), Differential Evolution (DE), and Particle Swarm Optimization (PSO) (Karaboga and Basturk, 2007; Karaboga and Akay, 2009). Later on, ABC has been used for ANN classifier training and clustering problem (Karaboga and Ozturk, 2009) where some benchmark classification problems were tested and the results were compared with those of other widely-used techniques.
APPLICATION and RESULTS
The artificial neural network models used in this study are the ones that were used in the earlier study (Ozkan et al., 2011) related to oil spill detection in the Lebanon coast in 2007. Since the main purpose of the paper is to examine the generalizing capability of different ANN learning algorithms, no training process was applied. The network topology used is 9-6-2 consisting one hidden layer with 6 neurons. Input and output layers are fixed by the dimension of input and output patterns. Two classes (oil and look-alike) are represented by 2 neurons in the output layer and nine different features are represented by 9 neurons in the input layer. The logarithmic sigmoid transfer function is employed at hidden and output layer neurons. In total, 74 parameters are used. The details of the parameters of the optimization algorithms ABC, LM and BP and other application features can be found in Ozkan et al. (2011).
Table 3. Classification accuracies of ABC, LM and BP through 1000 epochs.
Run RADARSAT-2 ALOS PALSAR
ABC LM BP ABC LM BP
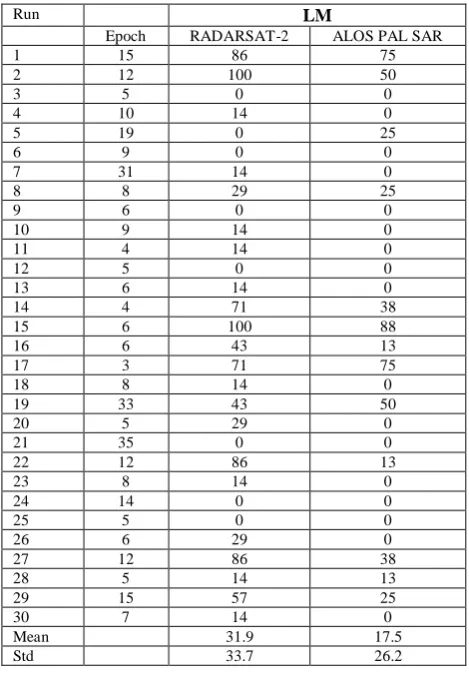
Table 4. Classification accuracies of ABC, LM and BP through optimum epochs.
Run ABC
Epoch RADARSAT-2 ALOS PAL SAR
1 457 100 88
Epoch RADARSAT-2 ALOS PAL SAR
1 15 86 75
Epoch RADARSAT-2 ALOS PAL SAR
CONCLUSIONS
For the rapidly-growing oil spill as is in the Gulf of Mexico, the improvement of detection and continuous monitoring are the most important issues to effectively plan rapid emergency response activities, and lessen its effects. In this context, remote sensing technology is being used as an important tool for both oil spill detection and monitoring the changes in its direction.
In this study, testing the generalization ability of ANN MLP classifier for oil spill classification and examining the capacity of a very new heuristic optimization technique (ABC) were aimed. The generalization ability of the classifier was tested using a different regional SAR data. While the training phase (optimization of model parameters) of the ANN was done by using the objects extracted from the Lebanon oil spill event, the objects from a different case area, Gulf of Mexico, were used in the testing phase. In addition to the regional variation, the effect of using different SAR sensor (i.e. ALOS PALSAR) was also taken into consideration.
The conclusions are mainly based on the means of the producer accuracies computed from 30 different runs. The multiple runs are significant for the algorithms initialized randomly as in ANN in order to determine the robustness. Each run was iterated both 1000 epochs and predetermined optimum epochs. The means of the procedure accuracies show that the generalization ability of ANN with LM and BP for unseen oil data is not good enough. The best results from optimum epochs are 41.9% for RADARSAT- 2 and 35.4% for ALOS PALSAR. But, ANN with ABC is relatively the best algorithm and gave moderate results, i.e. 72.4% for RADARSAT-2 and 57.9% for ALOS PALSAR. Although LM and BP are the well known algorithms, showing off the capacity of the ABC which is the first time used for oil spill classification is very important.
Since the oil slicks imaged with C- and L-band sensors show different amounts of dampening under the same imaging conditions, this will reduce the effect of look-alikes and false positive alarms. The differences in Bragg scattering at different microwave bands will allow for development of better oil spill detection algorithms. In this paper, RADARSAT-2 and ALOS PALSAR data were compared showing different performances of the sensors for oil spill detection. The results are attractive because the difference between RADARSAT-2 and ALOS PALSAR is so evident. The reason might be due to the original training data extracted from RADARSAT-1 data, i.e. it works in same band (C band, whereas ALOS PALSAR works in L band) and have similar calibration parameters and similar normalized radar cross section values.
Although results from ANN with ABC are significant enough for oil data, since look-alike data is absent, which is the main drawback of the study, it cannot be easily concluded that ANN with ABC method could be effectively used in a semi-automatic determination process of any oil spill data.
ACKNOWLEDGEMENTS
The authors would like to thank MDA and ASF for providing SAR data.
REFERENCES
Alpers, W., Wismann, V., Theis, R., Huhnerfuss, H., Bartsch, N., Moreira, J. and Lyden, J., 1991. The damping of ocean surface waves by monomolecular sea slicks measured by airborne multi-frequency radars during the SAXON-FPN experiment. Proceedings of the International Geoscience and Remote Sensing Symposium, Helsinki, Finland, pp. 1987– 1990. observation applications through systems and instruments of high performance computer. ASI/CONEA training course, September-December, Matera, Italy.
Brekke, C., and Solberg, A.H.S., 2005. Feature extraction for oil spill detection based on SAR images. SCIA 2005, LNCS, International Journal of Remote Sensing, 21, pp. 3561–3566.
Haralick, R., 1979. Statistical and structural approaches to texture. Proceedings of IEEE, 5, pp. 786–803.
Hovland, H.A., Johannessen, J.A. and Digranes, G., 1994. Slick detection in SAR images. Proceedings of the International Geoscience and Remote Sensing Symposium, Pasadena CA, pp. 2038–2040.
Karaboga, D., 2005. An idea based on honey bee swarm for numerical optimization. Technical Report-TR06, Erciyes University, Computer Engineering Department.
Karaboga, D. and Basturk, B., 2007. A powerful and efficient algorithm for numerical function optimization: Artificial Bee Colony (ABC) algorithm. Journal of Global Optimization, 3, pp. 459-171.
Karaboga, D. and Akay, B., 2009. Comparative study of Artificial Bee Colony algorithm. Applied Mathematics and Computation, 214, pp. 108-132.
Karaboga, D. and Ozturk, C., 2009. Neural networks training by Artificial Bee Colony algorithm on pattern classification. Neural Network World, 3, pp. 279–292.
Karathanassi, V., Topouzelis, K., Pavlakis, P. and Rokos, D., 2006. An object-oriented methodology to detect oil spills. International Journal of Remote Sensing, 27, pp. 5235–5251.
Keramitsoglou, I., Cartalis, C. and Kiranoudis, C., 2006. Automatic identification of oil spills on satellite images. Environmental Modeling and Software, 21(5), pp. 640–652.
Pavlakis, P., Tarchi, D. and Sieber, A., 2001. On the monitoring of illicit vessel discharges, A reconnaissance study in the Mediterranean Sea. European Commission, EUR 19906 EN.
Ramalho, G.L.B. and Medeiros, F.N.S., 2006, Using boosting to improve oil spill detection in SAR images. The 18th International Conference on Pattern Recognition (ICPR'06).
Sabins, F.F. (3rd Ed.), 1997. Remote Sensing, Principles and Interpretation (W.H. Freeman and Company, New York).
Solberg, A., Storvik, G., Solberg, R. and Volden, E., 1999. Automatic detection of oil spills in ERS SAR images. IEEE Transactions on Geoscience and Remote Sensing, 37, pp. 1916–1924.
Solberg, A., Brekke, C. and Husoy, P.O., 2007. Oil spill detection in Radarsat and Envisat SAR images. IEEE Transactions on Geoscience and Remote Sensing, 45, pp. 746–755.
Shi, L., Ivanov, A. Yu., H.M. and Zhao, C., 2008. Oil spill mapping in the western part of the East China Sea using synthetic aperture radar imagery. International Journal of Remote Sensing, 21, pp. 6315-6329.
Topouzelis, K., Karathanassi, V., Pavlakis, P. and Rokos, D., 2005. Oil spill detection using RBF neural networks and SAR data. Proceedings on ISPRS, July, 2005: 724–729.