MAPPING TROPICAL FOREST FOR SUSTAINABLE MANAGEMENT USING SPOT 5
SATELLITE IMAGE
Huong Thi Thanh Nguyen
Department of Forest resource & Environment management (Frem), Faculty of Agriculture and Forestry, Tay Nguyen University, Le Duan Str. 567, Buon Ma Thuot City, Daklak Province, Vietnam
Commission VII, WG VII/4
KEY WORDS: SPOT 5, tropical forest, stand volume, supervised classification, unsupervised classification
ABSTRACT:
This paper describes the combination of multi-data in stratifying the natural evergreen broadleaved tropical forest of the Central Highlands of Vietnam. The forests were stratified using both unsupervised and supervised classification methods based on SPOT5 and field data. The forests were classified into 3 and 4 strata separably. Correlation between stratified forest classes and forest variables was analyzed in order to find out 1) how many classes is suitable to stratify for the forest in this area and 2) how closely the forest variables are related with forest classes. The correlation coefficient shows although all forest variables did have a significant correlation with the forest classes, stand volume appeared to have the strongest correlation with forest classes. These are 0.64 and 0.59 for four and three strata respectively. The results of supervised classification also show the four strata of heavily degraded forest, moderate disturbance, insignificant disturbance, and dense forest were discriminated more clearly comparing to the forest stratified into three classes. The proof is that overall accuracy of supervised classification was 86% with Kappa of 0.8 for four classes, meanwhile, these are 77% and 0.62 respectively for forest area classified into 3 classes
.
1. INTRDUCTION
The combination of spatial data sources and various non-spatial in the inventory and monitoring of forest resources such as satellite imagery, field data or other digital data sources e.g. topographical map, land use maps and so on known as a multi-data.
Establishment of forest thematic maps using satellite image data is common application in forestry management. Numerous studies have used different remote sensing data with different methods to build the different forest maps. Several studies have attempted to discriminate the tropical forests into distinguishing classes such as floristic variance (Thessler et.al, 2008; Slovaara, 2005); forest status (Nguyen, 2008; Souza, 2003); forest types (Kong et al., 2008); or successional stages (Hartter et al., 2008; Lu et al., 2003). However, there is no ideal classification for all users (Anderson et al., 1976, Brown et al., 1999; Lark, 1995) as well as no generally accepted limits on how accurate a classification should be in order to qualify as reliable (Foody, 2002).
There are certain factors that influence the accuracy of a classification result; type of sensor, used method or number of required classes are among them. In order to evaluate the reliability of satellite data, Brockhaus and Khorram (1996) used three different images for classification, SPOT XS, Landsat TM only using bands that are corresponding to SPOT, and Landsat TM with all bands. The overall classification accuracy for seven forest cover types was 74.4%, 70.8% and 88.5%, respectively. When more vegetation classes are involved, the probability of erroneous class assignments increases. In a Brazilian study, Souza et al. (2003) reported an overall accuracy of 93% in a classification of forest/ non-forest in a study in tropical forest, but that was
86% (range of producer’s and user’s accuracy 66-95%) when classified into three classes including non-forest, degraded and logged class. Even though more vegetation classes are included, the presence of the non-forest class may obtain higher accuracy. Lu et al. (2003) reported an overall accuracy of 78% (range of producer’s and user’s accuracy 58– 99%) when classifying only three successional and one mature forest class in the Brazilian Amazonia. However, Trisurat et al. (2000) used supervised classification of Landsat TM data to discriminate grassland and six forest classes (e.g., mixed deciduous, dry evergreen and tropical rain forest) with an overall accuracy of 79% (range 50–100%). Mallinis and Koutsias (2008) used logistic regression for broad-scale land cover classification and presented higher overall accuracy (76%) compared to the maximum likelihood algorithm (64%) and Mahalanobis distance (67%), although it was not statistically significant. However, the consideration of the spatial autocovariate in the logistic models significantly improved the fit of the models and increased the overall accuracy from 76% to 81%. Nguyen (2011) classified disturbed natural forest into four classes of dense, medium, poor and regeneration forest using SPOT 5 image. The overall obtained in this study is 82%.
The studies as mentioned above usually focused on land cover forest type, or forest state. There have been not many attempts to combine image classification with a specific characteristics of the forest stand as criteria to quantify forest stands, especially for tropical forests which are inherently complex in terms of species. This is even more difficult when forests have been under mainly impacts from human activities.
2. METERIALS AND METHODS
2.1 Study area
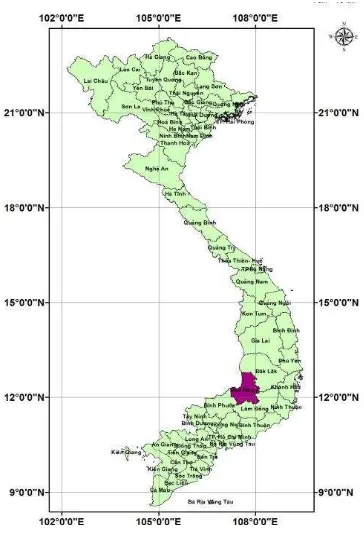
The study was conducted in Daknong province. This forest site belongs to the Central Highlands of Vietnam. The study area is located between in 11059’ to 12016’ latitude North and 107013’ to 107028’ longitude East. The size of study area is about 500 square km (20 x 25km). The forest is dominated by evergreen broad-leaved tropical natural forest but disturbed by human over time at different levels. Many of valuable species trees have been selectively logged. The Figure below shows site study (in pink colour area).
Figure 1. The area of study site
2.2 Data
Different data sources including satellite image, digital data, existing forest such as field data, forest map and data recorded from sample plots were used under the study. The required satellite imagery product was SPOT 5, which is a multi-spectral optical image which was captured using the High Resolution Geometric (HRG) instrument onboard the satellite. The radiometric resolution is 256 bright levels, the spatial resolution is 10m x10m and the images cover 60km x 60km. A set of available data such as, digital contour lines at a scale of 1:10 000, and land use maps were employed for image processing and classification. The SPOT 5 image was rectified using GCPs (ground control points) and the elevation information was captured from a DEM created from an available 10m contour line GIS shapefile. The SPOT image was projected to UTM 48N, WGS84 to ensure compatibility between images and available digital data. A nearest neighbour re-sampling method was applied during this process with a pixel spacing of 10m x 10m in order to maintain the integrity of the pixel values.
Because of the topographic effect of bright values of the images in some locations, some normalization algorithms were tested to remove this effect. The methods of Cosine,
Minnaert method and C-correction were used to topographically correct the images (Blesius et al. 2005; Jones et al., 1988; Smith et al., 1980; Teillet et al.,1982). The C-correction was used since it presented as the best one for topographic normalization for this area with the lowest determination of coefficient (R2) (Nguyen, 2015).
A total of 111 sample plots with an approximate area of 0.1ha with size similar to the SPOT 5 imagery pixel (10 x10 m) for each plot was sampled in the field. The stratified random sampling procedure was applied to assure that the sampling measurements captured all possible variability of forest conditions. Dense, moderate, open or/and very open forest structures were delineated during the field survey. Within the plots the forest variables measured were breast height diameter (Dbh), tree height (H) and tree density (N), and crown area (CA). Sample coordinates were recorded in the centroid position by GPS Map 60CSx. The standing volume equation was referred from previous research conducted by Nguyen (2011) for this area. This equation was then applied for all trees in all sample plots. For each plot, the mean forest parameters of sample plots and the 9-pixel means of SPOT 5 bands were calculated. The measured forest stand parameters were aggregated from 111 sample plots to represent forest stand conditions for forest classes. The average basal area was calculated based on Dbh (BA = (Dbh/2)2. The standing volume equation was following:
Ln(V) =-10.0094+1.066*Ln(Dbh)+1.933*Ln(H) (1)
With R2 = 0.982, P < 0.05
Where V is the stand volume, Dbh is the diameter at breast height, and H the tree height.
2.3 Hybrid classification of image to stratify the forests
using satellite image data can produce maps that are consistently correlated to the various forest characteristics that might represent a stratified forest.
Overall accuracy between classified SPOT 5 images and the reference data was presented as follows:
Overall accuracy = ∑ (2)
Where: k = the number of categories
n ij= total number of samples classified into category i (i = 1,2,…,k) in remotely sensed image and category j (j = 1,2,…,k) in the reference data set.
n = total number of observations
The producer’s accuracy was computed by
Producer’s accuracy =
(3)
and the user’s accuracy was computed by
User’s accuracy =
(4)
In addition, the Kappa coefficient is used to statistically test for agreement between two contingency matrices. The result of performing a Kappa analysis is a KHAT statistic which is another measure of agreement or accuracy (Cohen, 1960). Kappa is computed from
Kappa K = –
(5)
Where P0is the observed proportion of agreement (i.e., the actual agreement),
Pe is the proportion of agreement that is expected to occur by chance.
The Pe is determined by multiplying the marginal total of row i (ni+) and of column i (n+i) and dividing the sum of the resulting chance value in the agreement diagonal by N2. The Pe value was calculated as follows:
∑ (6)
If the two response variables are viewed as two independent ratings of the n subjects, the kappa coefficient equals +1 when there is complete agreement of the raster. When the observed agreement exceeds chance agreement, Kappa is positive, with its magnitude reflecting the strength of agreement. Although this is unusual in practice, Kappa is negative when the observed agreement is less than the chance agreement.
3. RESULTS AND DISCUSSION
3.1 Stratify the forest using unsupervised classification
The satellite imagery was classified into three and four forest classes because the primary aim of the classification procedure was the identification and the discrimination of the forested areas. The relationship between forest variables and reflectance responses was developed using the correlation of forest stand parameters with forest classes. In order to test whether or not the variables are related and how closely the
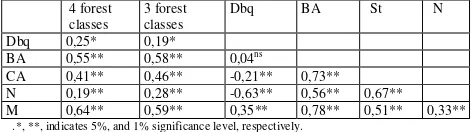
two variables are related, correlation analysis was computed; and the result obtained in a matrix of estimated correlation coefficients for every pair of variables is presented in Table 1. This table shows Pearson product moment correlations between each pair of variables and their P-value.
The second column indicates the correlation between forest classes and forest variables, while the values from the fourth column to seventh show the correlation among independent forest variables.
All forest variables of Dbh, N, BA, CA, and V did have a significant correlation with the forest classes and had a positive relationship with the forest classes. The Table 1 indicates that most independent variables (forest parameters) were in relation with response variables (forest classes) at P<0.05, simultaneously, they also correlated mutually. This means a certain independent variable can have a correlation with a response variable but it may be in an indirect way or reflected through other variables.
Correlation coefficients between forest class and surveyed variables varied from 0.19 to 0.64 in absolute value. Among the forest variables the three variables of BA, crown area especially stand volume exhibited to have higher correlation with the forest classes compared to the others. In both cases of 3 classes and 4 classes the stand volume had the strongest correlations with forest classes, which suggests that stand volume has the potential variable to analysis the relationship between digital number with forest characteristics. The correlation coefficients were 0.59 and 0.64 for 3 classes and 4 classes respectively. Compared to the 3 forest classes, the correlation between 4 forest classes and stand volume was higher. This indicated the tropical forest which impacted under different levels in this area is suitable to classify into 4 strata using SPOT 5 image.
Table 1. Pearson correlation matrix for forest variables and classified forest classes
4 forest classes
3 forest classes
Dbq BA St N
Dbq 0,25* 0,19*
BA 0,55** 0,58** 0,04ns
CA 0,41** 0,46** -0,21** 0,73** N 0,19** 0,28** -0,63** 0,56** 0,67** M 0,64** 0,59** 0,35** 0,78** 0,51** 0,33**
.*, **, indicates 5%, and 1% significance level, respectively.
3.2 Stratify the forest using Maximum likelihood classification
Although the result obtained from unsupervised classification was quite convincing basis to decide the number of classes to stratify the forests. However, to ensure more reality, the supervised classification was applied to stratify the forests. The training sites were based on sample plots which were defined in the result of unsupervised classification along with visual observation on the image with prior knowledge. The training sites were created for both tests of three forest classes and four forest classes. The training sites included dense, moderate, open or/and very open forest.
3.3 Accuracy assessment of classification result
other words, no classification will be optimal from the viewpoint of each different user (Brown et al., 1999; Lark, 1995; Salovaara, 2005).
The accuracy assessment was performed both 2 classification results using independent samples. The evaluations were presented in Table 2 and Table 3.
Table 2. Confusion matrix of the Maximum Likelihood classification (for 4 classes)
The overall accuracy achieved for two tests of 3 and 4 forest classes were of 85.69 % and 77.78% and their kappa coefficients are 0.79 and 0.62 respectively, indicating the substantial agreement between classification result and observations. Although substantial agreement was found in both tests, the higher agreement was exhibited by the test of 4 forest classes. This indicates that the natural forests which have been impacted to different degrees as Vietnamese forest, should be classified into four strata using SPOT 5 data.
3.4 Characteristics of forest classes
Based on field data and result of classification, summary statistics for field sample data in the four forest classes was shown in Table 4. Skewness and Kurtosis are two should be standardized with a constant, depending on the sample size. The standardized skewness and standardized Kurtosis in this case were in the range from -2 to + 2. This means the samples collected was able to represent for each stratum.
Table 4. Sample characteristics of forest classes
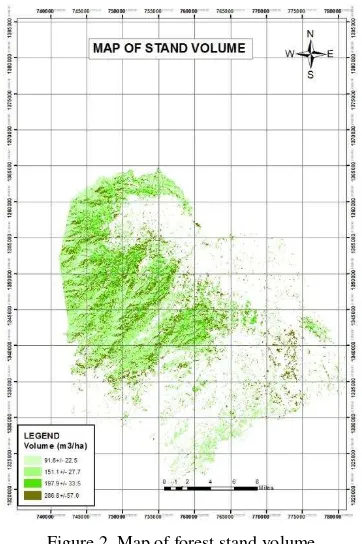
Class 1 Class2 Class3 Class4 heavily degraded forest, moderate disturbance, insignificant disturbance, and dense forest. Based on classification result and field data, stand volume was estimated for each stratum
and the whole area as presented in Table 5 and forest volume map was shown in Figure 2.
Table 5. Characteristics of stand volume of forest strata
C This is useful to quantify the forest resource especially in the calculation of forest carbon or biomass through standing volume. This information also may be helpful in the forest management and monitoring.
Figure 2. Map of forest stand volume
4. CONCLUSION
which impacted at different levels as the study area, the use of satellite imagery medium resolution like SPOT 5 can discriminate the forests into 4 strata with accuracy> 80%. Based on the classification results and field data the average stand volume for each strata will be estimated, accordingly, the whole forest area will be predicted.
REFERENCES
Andersen G. L. 1998. Classification and estimation of forest and Vegetation variables in optical high resolution satellites: A Review of Methodologies. International Institute for Applied Systems Analysis IIASA, Austria.
Blesius, L., and Weirich, F. 2005. The use of the Minnaert correction for land-cover classification in mountainous terrain. International Journal of Remote Sensing, 26(17), pp. 3831–3851.
Brockhaus, J.A. and Khorram, S. 1996. A comparison of SPOT and Landsat-TM data for use in conducting inventories of forest resources. International Journal of Remote Sensing, 13(16), pp. 3035-3044.
Brown, J. F., Loveland, T. R., Ohlen, D. O., and Zhu, Z. 1999. The global land-cover characteristics database: the user’s perspective. Photogrammetric Engineering and Remote Sensing, 65: 1069–1074.
Cohen, W.B. and Spies, T.A. 1992. Estimating structural attributes of douglas-fir Western Hemlock forest stands from Landsat and SPOT imagery. Remote Sensing of Environment, 41(1), pp.1-17.
Congalton, R. G. and Green, K. 1999. Assessing the accuracy of remotely sensed data: Principles and practices, Boca Raton, Lewis Publishers.
Foody, G.M. 2002. Status of land cover classification accuracy assessment. Remote Sensing of Environment, 80, pp.185– 201.
Hartter, J., Lucas, C., Gaughan, A.E, and Aranda, L.L. 2007. Detecting tropical dry forest succession in a shifting cultivation mosaic of the Yucata´n Peninsula, Mexico.
Applied Geography 28, pp.134–149. Elsevier Ltd.
Jones, A.R., Settle, J.J. and Wyatt, B.K., 1988, Use of digital terrain data in the interpretation of SPOT-1 HRV multispectral imagery. International Journal of Remote Sensing, 9, pp. 669-682.
Kong, N., Fei, S., Lynne Rieske-Kinney, and Obrycki, J. 2008. Mapping hemlock forests in Harlan county, Kentucky. In Proceedings of the 6th Southern Forestry and Natural Resources GIS Conference. Warnell School of Forestry and Natural Resources, University of Georgia, Athens, GA.
Lark, R. M. 1995. Components of accuracy of maps with special reference to discriminant analysis on remote sensor data. International Journal of Remote Sensing, 16, pp.1461–
1480.
Lu, D., Moran, E., and Batistella, M. 2003. Linear mixture model applied to Amazonian vegetation classification.
Remote Sensing of Environment, 87: 456-469.
Mallinis, G. and Koutsias, N. 2008. Spectral and spatial-based classification for broad-scale land cover mapping spatial-based on logistic regression. Sensors, 8, pp. 8067-8085.
Nguyen, T.T.Huong, 2015. Topographical correction of SPOT 5 data. Scientific Journal of Tay Nguyen University. ISSN 1859-4611 (14), pp. 27-33.
Nguyen, T.T. Huong, 2011. Forestry Remote Sensing: Using multidata sources for inventory of Natural broad leaved ever-green forests in the Central Highlands of Vietnam. Lambert Academic Publishing, Germany. 125p.
Nguyen, V. L. 2008. Use of GIS modelling in assessment of forestry land’s potential in Thua Thien Hue province of Central Vietnam. Doctoral thesis. Department of Mathematic-natural science. Georg-August-Universität zu Göttingen. Germany. 202p.
Salovaara, K.J., Thessler, S., Malik, R.N., and Tuomisto, H. 2005. Classification of Amazonian primary rain forest vegetation using Landsat ETM+ satellite imagery. Remote Sensing of Environment, 97, pp. 39 – 51.
Smith, J., Lin, T., and Ranson, K. 1980. The Lambertian assumption and Landsat data. Photogrammetric Engineering and Remote Sensing, 46: 1183–1189.
Souza, C.J., Firestone, L., Silva, L.M., and Roberts, D. 2003. Mapping forest degradation in the Eastern Amazon from SPOT 4 through spectral mixture models. Remote Sensing of Environment, 87, pp. 494–506.
Teiller P. M., Guindon, B., Goodenough, D. G., 1982. On the slope-aspect correction of multispectral scanner data.
Canadian Journal of Remote Sensing, 8 (2), pp. 84-106.
Thessler, S., Sesnie, S., Bendaña, Z.S.R., Ruokolainen, K., Tomppo, E., and Finegan, B. 2008. Using k-nn and discriminant analyses to classify rain forest types in a Landsat TM image over northern Costa Rica. Remote Sensing of Environment, 112, pp. 2485–2494.