EXTRACTING ROOF PARAMETERS AND HEAT BRIDGES OVER THE CITY OF
OLDENBURG FROM HYPERSPECTRAL, THERMAL, AND AIRBORNE LASER
SCANNING DATA
L. Bannehr a, Th. Luhmann b, J. Piechel b, T. Roelfs b, A. Schmidt a
a Hochschule Anhalt, Institut für Geoinformation und Vermessung, Bauhausstraße 8, 06846 Dessau-Roßlau;
Germany- (l.bannehr, and.schmidt) @afg.hs-anhalt.de
b Jade Hochschule Oldenburg, Institut für Angewandte Photogrammetrie u. Geoinformatik, Ofener Str. 16, 26121
Oldenburg, Germany- (thomas.luhmann, johannes.piechel, thorsten.roelfs) @jade-hs.de
ISPRS Hannover Workshop 2011
KEY WORDS: Hyperspectral Imaging, Airborne Laser Scanning, Thermal Imaging, Classification, Support Vector Machine, Decision Tree
ABSTRACT:
Remote sensing methods are used to obtain different kinds of information about the state of the environment. Within the cooperative research project HiReSens, funded by the German BMBF, a hyperspectral scanner, an airborne laser scanner, a thermal camera, and a RGB-camera are employed on a small aircraft to determine roof material parameters and heat bridges of house tops over the city Oldenburg, Lower Saxony.
HiReSens aims to combine various geometrical highly resolved data in order to achieve relevant evidence about the state of the city buildings. Thermal data are used to obtain the energy distribution of single buildings. The use of hyperspectral data yields information about material consistence of roofs. From airborne laser scanning data (ALS) digital surface models are inferred. They build the basis to locate the best orientations for solar panels of the city buildings.
The combination of the different data sets offers the opportunity to capitalize synergies between differently working systems. Central goals are the development of tools for the collection of heat bridges by means of thermal data, spectral collection of roofs parameters on basis of hyperspectral data as well as 3D-capture of buildings from airborne lasers scanner data.
Collecting, analyzing and merging of the data are not trivial especially not when the resolution and accuracy is aimed in the domain of a few decimetre. The results achieved need to be regarded as preliminary. Further investigations are still required to prove the accuracy in detail.
1. INTRODUCTION
Urban development plays an important role in our modern time. Humans live together ever more closely. The natural resources become less and energy related questions arise worldwide. The steady progress of urban sealing has influence on our well-being, the health and local climate. Remote sensing techniques may assist to obtain necessary information to sustain or even improve the quality of our environment. In order to address these issues from a planning point of view, spatially high resolved 3D data at different wavelengths is needed. Airborne data are mostly suitable for these purposes. Especially when using more than one sensor at a flight, airborne methods become fairly cost efficient and can cover large areas.
Hyperspectral data can be used to differentiate various urban surface cover types. Due to the strong heterogeneity of urban areas, geometrically high resolved data is required. For many applications a resolution of 50 cm or even better are desirable. With a coarse resolution of 1m or even less mixed pixels do not allow to separate details. Roesner et al. (2010) used a spectral
unmixing algorithm to reduce the problem with the low resolution 7m pixel size DAIS hyperspectral data.
Mori et al. (2008) classified and analysed roof materials in
Japan based on a handheld spectrometer using the reflectance between 350 – 2500 nm as a basis. But only single spots can be
handled by this method. Bähr et al. (2005) and Lemp and
Weidner (2004) developed an automatic procedure to determine roof parameters from hyperspectral and lidar data. They subdivided five roof classes. For the classification a partly object-oriented approach was implemented.
Klärle (2009) used a Riegl LMS Q560 airborne laser scanner (ALS) within the project SUN-AREA to infer the optimal location for photo voltaic solar panels for the test site of the city Osnabrück, Germany.
For the project HiReSens hyperspectral data in the visible to near infrared region are collected to derive roof parameters of Oldenburg. The processed hyperspectral data have a spatial resolution of 0.5 m. Details, such as chimneys, dormers, etc., are detected and can be excluded from the classification. In addition to the hyperspectral measurements, thermal and airborne laser scanner data are gathered to address energy related issues. The merging of all these different kinds of data results in a vast pool of information. Generally one can say that the exactness of classification results increases considerable by synergy effects. For the classification a decision tree and support vector machine algorithm are used.
The innovative core of the project lies, among other things, in the challenging data acquisition of high spectral and spatial resolved data, an accuracy of all georeferenced within a few International Archives of the Photogrammetry, Remote Sensing and Spatial Information Sciences, Volume XXXVIII-4/W19, 2011
decimetre, and the fusion of the different complex sensor data. The products serve as additional input data for 3D city models as well as for a GIS database.
2. OBSERVATIONS
Within the project HiReSens three flights at different times are performed over the city of Oldenburg, Germany. The total project area size is 3.8 km x 1.8 km. Within this district it is focused on a core area of 1.8 km x 1.0 km where the diversity of city of Oldenburg is reflected mostly.
The operated FLIR SC3000 thermal camera and the hyperspectral system AISA+ is owned by the Anhalt University of Applied Sciences. The Riegl LMS Q560 airborne laser scanner and IGI INS/GPS AeroControl system are provided by the project partner Milan Geoservice.
Alpha Luftbild, another project partner, provided kindly the RGB camera Rollei AIC P45 with 39 megapixels and performed the measurement flight on 25 March 2010. The flight altitude of 580 m results in a ground resolution of about 8.5 cm. The data were georeferenced by the traditional method of triangulation. The end lap was 68%, the side lap 80%. Due to the high spatial resolution, the RGB data is used as reference for the co-registration of the other sensors. Furthermore, they provide a reference for the training areas for later support vector machine classification.
More than 60 GBytes hyperspectral, thermal and airborne laser scanner raw data are collected. The observations were carried out using the Cessna 207 aircraft of Milan Geoservice. A system description is given in detail by Bannehr et al. (2006).
The weather conditions required are different for the individual sensors. For the hyperspectral analysis clear skies and a high sun elevation is wanted. Similar conditions are needed for RGB measurements. When collecting thermal data the most suitable weather conditions are low temperatures in the morning, no snow, no dew, and a uniform cloud cover. For a detailed energy analysis the heating of the buildings is important. Unheated, cold buildings show a mostly uniform temperature distribution compared to heated buildings.
Airborne laser scanner can be operated under most weather conditions unless it is raining or snowing. Fog and dew also prevent the measurements.
Beside the RGB flight two additional flights are carried out. For the second research flight the thermal camera FLIR SC3000 was mounted together with the Riegl LMS Q560 airborne laser scanner in the aircraft. The observations carried out closely before sunrise at an altitude of approximately 500 m on 28 April 2010. The third flight with the hyperspectral sensor AISA+ was performed on 16 June 2010.
The infrared camera allows detecting small differences in temperature. Thus it is most suitable to detect thermal bridges and energy loss of buildings. The employed infrared camera has a detector size of 320 x 240 pixels (76.800 pixels). Its spectral response lies between 8 and 9 µm. Up to 50 images per second can be taken. For the present project the data acquisition rate was set to 10 Hz. This high sampling rate assures a high overlapping in flight direction and hence minimizes the angular effect of emissivity. During the measurement the standard
This temperature range is resolved with 16 bit and results in temperature resolution of 30 mK.
The thermal camera was geometrically calibrated in the laboratory with a 3D test field (Luhmann et al. 2011) and
radiometrically with a standard black body calibrator.
The imaging spectrometer AISA+ is a non cooled system. It serves for monitoring and detection of environmental damages, determination of water constituents of lakes and rivers, forest state examination, and atmosphere research. Up to 244 spectral channels with a bandwidth of 2.5 nm wavelength can be defined within the spectral range from 400 nm to 980 nm. For the project HiReSens 107 spectral channels with a bandwidth of about 5 nm are preset as tradeoff between noise, exposure time and channel bandwidth.
The AISA+ system was radiometrically calibrated by the manufacture Specim. According to Specim is the accuracy over the whole spectrum about 10%. This accuracy is not critical for the current investigation.
3. PROCESSING
The AISA+ hyperspectral system and the Riegl airborne laser scanner LMS-Q560 are connected to an IGI CCNS4 AeroControl INS/GPS. This system samples the aircraft motion data (roll, yaw, pitch) with 256 Hz and the GPS data with 10 Hz. In post processing using SAPOS correction data the accuracy for the direct rectification of the georeferenced hyperspectral scanner varies between 0.0 to 2.0 m. For the ALS an accuracy of 0.5 m is achieved. About the discrepancies can only be speculated at the moment. It is likely that boresight rest errors or time drifts of the AISA+ system may cause the problem. In order to minimize the errors the hyperspectral data were co-registered to the RGB data to minimize the deviation. All data were finally transformed into UTM 32N, WGS 84.
3.1 Rollei AIC-P45
The Rollei RGB data serve from the georeferenced point of view as reference data because of their high spatial resolution. Furthermore, they provide a basis for collecting visually different roof types for a subsequent classification.
For the core region 8 flight legs with 56 images were processed. In total 18 manhole covers are taken as ground control points. They were collected with DGPS. More than 700 matching points were selected. Two to three points were picked manually for each image. The rest were picked automatically. An underlying digital surface model is used to generate a mosaiced orthophoto.
3.2 FLIR SC3000
The temperature range measured during the field experiment was between 3.5°C and 9.5°C. For this temperature range an iron color table with 8 bit is applied to visualize the measured temperatures (see figure 1).
Since the thermal camera was not connected to a GPS/INS, the data were georeferenced by means of control points and matching points using the Erdas LPS software in the same manner as the RGB data processing was done.
The result of the preprocessed data is presented in figure 1. Some thermal features of the roof tops are already visible. International Archives of the Photogrammetry, Remote Sensing and Spatial Information Sciences, Volume XXXVIII-4/W19, 2011
surrounding roads and free areas. One also can see a coarse variation in blue of the individual buildings. For a more deepen analysis it is necessary to extract the thermal features in detail.
3.5 °C 9.5° C
Figure 1: A 500 m x 500 m subset thermal infrared orthorectified image section of Oldenburg, Lower Saxony. The
spatial resolution is about 50 cm.
One must be very careful with the interpretation of the thermal images because the temperatures displayed depend on the emissivity ε of the roof materials which are very different in general. Variations of ε between 0.80 – 0.94 and more are very common. This can result in a temperature difference of several Kelvin, depending on the temperature level itself.
Without any further information, it is not possible to decide whether the different temperatures are due to the variation of the emissivity or arise from different surface temperatures of the buildings.
Later on, a decision tree algorithm is presented to emphasize the thermal energy distribution of the individual buildings.
In the spectral response region of the infrared camera (8-9 µm) an atmospheric window (8-14 µm) exists. Hence the expected influence of the atmosphere on the signal should be rather low. Nevertheless, Modtran radiative transfer calculations are carried out for a flight altitude of 500 m assuming a standard aerosol size distribution and a standard atmospheric profile. By not regarding the atmospheric effect, a possible error of 0.5 K may be introduced as a result from the radiative transfer calculations. In this case the introduced error is small and uniform over all the area. Hence it was neglected for further processing. Also not the absolute but the relative temperature distribution is mainly of interest.
In situ measurements confirm the result. They were taken at several places during the overpass of the aircraft.
3.3 AISA+
The processing of the hyperspectral data includes the boresight calibration, radiometric correction, rectification, georeferencing, orthorectification, and mosaicing. Eleven flight legs are required to cover the region.
Due to not ideal weather conditions it was decided to use the so called FODIS ratio as reflectance rather than applying an atmospheric correction. The FODIS ratio is the ratio of the downwelling irradiance (measured by the FODIS detector) and upwelling radiance (measured by AISA sensor). Under partial cloudiness and diffuse illumination the ratio of the upwelling to downwelling radiation provides better results.
In order to achieve a high geometric accuracy, the hyperspectral sensor AISA was calibrated using a newly procedure developed by the project group (Piechel et al., 2011). It turned out, that the
results from this calibration cannot be used in the CaliGeo tool, despite the documentation saying it possible to use a factor for radial distortion. Figure 2 shows the preprocessed reflectance CIR color image of the hyperspectral sensor AISA+. Some dark and bright spots within the image are caused by the cloudiness. To verify the measured data, in situ measurements with a field spectrometer are carried out. The reflectance of different roof tops was collected during the over passes of the aircraft using a hand spectrometer. The comparison indicates a satisfactory agreement of airborne and ground truth spectra.
Figure 2: A 500 m x 500 msubset of the preprocessed CIR reflectance image of the hyperspectral scanner AISA+. The
spatial resolution is 50 cm.
3.4 Airborne Laser Scanner LMS Q560
The preprocessing of the laser data with a spatial resolution of about 25 cm were made by the Milan Geoservice. The data were resampled to 50 cm. It consists of the digital terrain model (DTM) and the digital surface model (DSM). Beside these rasterized data, the point cloud data was also available. Its resolution is about 23 points per square meter.
Figure 3 shows a shaded relief of Oldenburg. The spatial resolution is 50 cm. Oldenburg is can be characterized by mostly small buildings.
Figure 3: A 500 m x 500 m subset of the shaded relief digital surface model derived from a Riegl LMS Q560 airborne laser
scanner of Oldenburg.
4. PRODUCTS AND ANALYSIS
After preprocessing the ALS, hyperspectral, thermal, and RGB data various products can be derived.
In most cases rather than the absolute temperature the relative differences of the roof temperatures already indicate heat bridges or heat losses. In order to highlight these features a decision tree algorithm was setup.
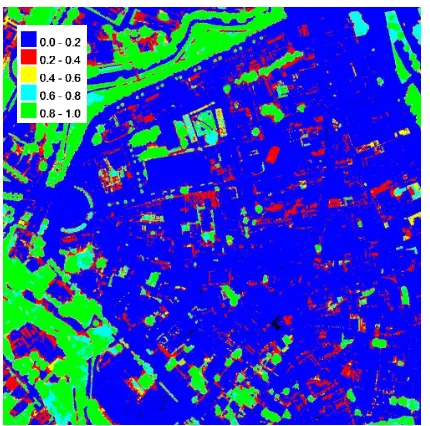
In a first step the NDVI is calculated from the hyperspectral data. These data are used to discriminate similar temperatures of the roofs from the vegetation. The vegetation was coloured black if the NDVI was greater than 0.35. The calculated NDVI is presented in Figure 4.
Figure 4: Calculated NDVI from the wavelengths of 673 nm and 849 nm, 500 m x 500 m subset.
The height of the buildings above ground was calculated by
model. All data are excluded from further processing if the height is less than 7 m. They are also marked black. In doing so the road temperatures are separated from the roof temperatures. In the last step the color was assigned to the corresponding temperature in steps of 1 K. Figure 5 shows the temperature differences. As mentioned earlier, only the relative variations are of interest, since they provide information about the potential heat bridges. In figure 5 chimneys and dormers are still included.
Figure 5: Individual temperature differences of the city buildings of Oldenburg extracted from hyperspectral, laserscan,
and thermal data using a decision tree algorithm, 500 m x 500 m subset.
For solar potential it is interesting to know the alignment of roofs within a city. In order to estimate the potential of solar energy, in general the number of flat roofs, roofs with a certain angle and the total area has to be known.
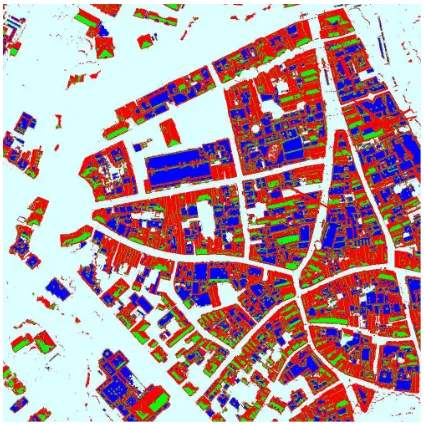
For solar collectors the most suitable orientation is south with a pitch of about 30°. These data are valid for Germany and vary slightly depending on the local weather conditions (eg. clouds). Regarding these constraints, the roof orientations of Oldenburg, which are highly valuable for installing solar panels, are derived. The method employed is also based on a simple decision tree algorithm. In this case the difference of the digital surface model minus digital terrain model plus NDVI data were employed. Using the NDVI makes it is easier to discriminate trees from buildings. In the present case the threshold for the NDVI was set to 0.35 and the threshold for the object height was set to 7 m. A building or roof is detected if the NDVI is less than 0.35 and the height is more than 7 m. In a next step, the slope is computed. If the slope is less than 10°, the building’s roof is regarded as flat roof and marked blue. In case the slope is found between 10° and 50° and also the orientation of the roof is between 120° and 240°, then the buildings are marked green. This orientation is regarded as optimal for installing solar panels. The red marked areas indicate no suitable places for a potential use of solar panels. The result of the decision tree classification is shown in Figure 6. Due to the alignment, only a relative small number of mostly private houses is suitable for installing solar panels. Most appropriate are the public buildings with flat roofs. They are marked blue.
Figure 6: Potential for the use of solar panels of Oldenburg, 500 m x 500 m subset. Blue are flat roofs. Green marked areas are roofs with a slope between 10°-50° and an orientation between 120°-240°. Red marked areas are houses which are not suitable
for installing solar cells.
4.1 Roof Classification
The roof classification is aiming for separating different roof surface materials. The classification consists of two parts. One part is the binary classification of roofs itself. The other part is then to classify the surface material within these roofs.
The first step, the roof classification, is based on the rasterized ALS-data and the NDVI calculated from the hyperspectral data. Also the plane normals are calculated within in a 1x1 m raster from the original point cloud. This is done using the robust least median of squares technique for plane fitting within the 1x1 m cells. These 1m raster cells are resampled to 50 cm to the match the other data.
The normalized digital surface model (nDSM = DSM – DTM) and rasterized normals are used for a segmentation (using eCognition). This segmentation is set to be over segmented in order to get the proper building boundaries. A higher segment size results in a higher risk to miss a building boundary. The left image of figure 7 shows the initial segmentation.
Then the roof segments are classified via a threshold in nDSM-height (higher than 2.5m) and NDVI (less than 0.42), see the middle image of figure 7.
Further on, some refinements are done using a rule set for the image objects. The resulting roof mask is shown in the right part in Figure 7.
Figure 7: From left to right: basic eCognition segmentation (yellow = segment boundary), initial classification (roofs = red), classification after rule set
and merging; background is the nDSM image
The second step is the classification of the roof materials. In the literature support vector machine classification proved to be very suitable for classifying hyperspectral data (Melgani & Bruzzone, 2004; Plaza et al., 2009; Waske et al. 2009).
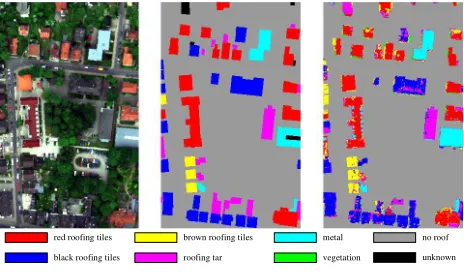
A manual classification serves as reference data. It is done using a true orthofoto mosaic, calculated by Heiko Hirschmüller (Hirschmüller, 2008) and the DSM extracted from the ALS data. At this time, the manual classification only consists of roof outline polygons with the material and homogeneity as attribute. Roof polygons are recognized as homogenous, if the covering surface material is only one material, and if there are only few areas (less than about 10% in area) of disturbing objects like dormers and chimneys. Only these homogenous roof polygons are used as training candidates for the classification. From these training candidates, a subset of 100 random pixels per class is selected. These pixels serve as the training data for the SVM classification. The SVM classification result is then masked by the roof outline mask, which was generated in the step before. Results are shown in figure 8. There, the left image shows the RGB channel combination of the AISA hyperspecttral data. The middle image shows the reference classification consisting of homogenous and nonhomogenous roof polygons. And the right image shows the classification result as a combination of SVM classification and eCognition roof mask.
Up to now, the manual classification lacks in detail and completeness. Furthermore, not all material classes are assigned correctly within the manual classification. More knowledge of the local environment is needed for a detailed manual classification.
Some georectification errors still left in the hyperspectral data lead to misclassifications at the building boundaries. In addition, some misclassifications are induced by different solar illumination angles, mainly north vs. south aligned roof planes. Minimizing these errors is part of the ongoing research. International Archives of the Photogrammetry, Remote Sensing and Spatial Information Sciences, Volume XXXVIII-4/W19, 2011
red roofing tiles
black roofing tiles
brown roofing tiles
roofing tar
metal
vegetation
no roof
unknown
Figure 8: Preliminary classification example; left: AISA+ RGB image,
middle: generalized reference image, right: SVM classification result using masked by the
eCognition roof mask
5. CONCLUSIONS AND OUTLOOK
From different kinds of remote sensing data products, such as the temperature distributions of roof tops and the alignments of the roofs suitable for installing solar panels, were derived applying a decision tree algorithm.
From the hyperspectral data the roof material characteristics are inferred using a support vector machine classification. The fusion of different data sets makes it possible to obtain more information by synergic effects as indicated by the derived quantities. It also shows that precise georectification of all data is the basis for reliable results.
Due to the lack of a thorough quality check some of the results achieved regarded as preliminary. Further investigations are still required to refine the algorithms applied.
ACKNOWLEDGEMENTS
The authors are very grateful for the financial support by the German AIF/BMBF; project funding reference number 1717B09.
REFERENCES
Bähr, H.-P., Lemp, D., and Weidner, U., 2005. Hyperspectral meets Laserscanning: Image Analysis of Roof Surfaces. Tagungsbeitrag “High-Resolution Earth Imaging for Geospatial Information”. ISPRS Hannover Workshop
Bannehr, L., Hannusch, D., Jany, S., Runne, H., 2006. Komplexes modulares System zur Ableitung von Umweltparametern. DGPF, Geoinformatik und Erdbeobachtung, Hrsg. E. Seifert
Heldens, W., Heiden, U., Esch, Th., and Dech, S., 2010, Potential of Hyperspectral Data for Urban Micro Climate Analysis. Proc. Hypersepctral 2010 Workshop, Frascati, Italy
Hirschmüller, H., 2008. Stereo Processing by Semiglobal Matching and Mutual Information. IEEE Transactions on
Pattern Analysis and Machine Intelligence, vol. 30, no. 2, pp.
328-341
Klärle, M., Ludwig, D. & Lanig, S., 2009. SUN-AREA - Ein Beitrag der Fernerkundung gegen den Klimawandel. In: ZfV, pp. 71-78, 2/2009.
Lemp, D. and Weidner, U. 2004. Use of Hyperspectral and Laser Scanning data for the Charaterization of Surfaces in urban Areas. XXth ISPRS Congress ISPRS, Comm. VII, Proceedings
Luhmann, T., Ohm, J., Piechel, J., Roelfs, T., 2011. Geometrische Kalibrierung von Thermografiekameras.
Photogrammetrie - Fernerkundung - Geoinformation (PFG),
2011 (1), S. 5-15.
Melgani, F. & Bruzzone, L., 2004. Classification of hyperspectral remote sensing images with support vector machines. IEEE Transactions on Geoscience and Remote
Sensing, IEEE, 42, 1778-1790
M. Mori a, T. Iwata, Y. Minami, S. Kato, Y. Akamatsu, 2008. Spectral Analysis of Building Materials Used in Japan. The International Archives of the Photogrammetry, Remote Sensing and Spatial Information Sciences, ISPRS Congress Beijing 2008. Vol. XXXVII. Part B8. Beijing 2008
Piechel, J., Bannehr, L., Luhmann, Th., Roelfs T. and Schmidt, A., 2011. Geometrische Kalibrierung von Hyperspektralsensoren, Proc. DGPF-Jahrestagung, Mainz,
Germany
Plaza, A.; Benediktsson, J.; Boardman, J.; Brazile, J.; Bruzzone, L.; Camps-Valls, G.; Chanussot, J.; Fauvel, M.; Gamba, P.; Gualtieri, A.; Marconcini, M.; C. Tilton, J., Trianni, T., 2009. Recent advances in techniques for hyperspectral image processing. Remote Sensing of Environment, Elsevier, 113, S110-S122
Roessner, S., Segel, K., Heiden, U. and Kaufmann, H., 2001. Automated Differentiation of urban Surfaces Based on Airborne Hyperspectral Imagery. IEEE Transaction on Geosciences and
remote Sensing, vol. 39, p 1525-1532
Waske, B.; Benediktsson, J.; Árnason, K.; Sveinsson, J., 2009. Mapping of hyperspectral AVIRIS data using machine-learning algorithms. Can. J. Remote Sensing, 35, S106-S116