Microsoft SQL Server 2012
with Hadoop
Integrate data between Apache Hadoop and SQL
Server 2012 and provide business intelligence on the
heterogeneous data
Debarchan Sarkar
Copyright © 2013 Packt Publishing
All rights reserved. No part of this book may be reproduced, stored in a retrieval system, or transmitted in any form or by any means, without the prior written permission of the publisher, except in the case of brief quotations embedded in critical articles or reviews.
Every effort has been made in the preparation of this book to ensure the accuracy of the information presented. However, the information contained in this book is sold without warranty, either express or implied. Neither the author, nor Packt Publishing, and its dealers and distributors will be held liable for any damages caused or alleged to be caused directly or indirectly by this book.
Packt Publishing has endeavored to provide trademark information about all of the companies and products mentioned in this book by the appropriate use of capitals. However, Packt Publishing cannot guarantee the accuracy of this information.
First published: August 2013
Production Reference: 1200813
Published by Packt Publishing Ltd. Livery Place
35 Livery Street
Birmingham B3 2PB, UK.
About the Author
Debarchan Sarkar
is a Microsoft Data Platform engineer who hails from Calcutta, the "city of joy", India. He has been a seasoned SQL Server engineer with Microsoft, India for the last six years and has now started venturing into the open source world, specifically the Apache Hadoop framework. He is a SQL Server Business Intelligence specialist with subject matter expertise in SQL Server Integration Services.Debarchan is currently working on another book with Apress on Microsoft's Hadoop distribution, HDInsight.
About the Reviewer
Atdhe Buja Msc is a Certified Ethical Hacker, Database Administrator (MCITP,
OCA11g) and a developer with good management skills. He is a DBA at Ministry of Public Administration, Pristina, RKS, where he also manages some projects of E-Governance and eight years' experience in SQL Server.Atdhe is a regular columnist for UBT News, currently he holds a MSc. in Computer Science and Engineering, has a Bachelor in Management and Information and continues studies for a Bachelor degree in Political Science in UP.
Specialized and Certified in many technologies such as SQL Server 2000, 2005, 2008, 2008 R2, Oracle 11g, CEH-Ethical Hacker, Windows Server, MS Project, System Center Operation Manager, and Web Design.
His capabilities go beyond the above mentioned knowledge!
www.PacktPub.com
Support files, eBooks, discount offers
and more
You might want to visit www.PacktPub.com for support files and downloads related to your book.
Did you know that Packt offers eBook versions of every book published, with PDF and ePub files available? You can upgrade to the eBook version at www.PacktPub.com and as a print book customer, you are entitled to a discount on the eBook copy. Get in touch with us at [email protected] for more details.
At www.PacktPub.com, you can also read a collection of free technical articles, sign up for a range of free newsletters and receive exclusive discounts and offers on Packt books and eBooks.
TM
http://PacktLib.PacktPub.com
Do you need instant solutions to your IT questions? PacktLib is Packt's online digital book library. Here, you can access, read and search across Packt's entire library of books.
Why Subscribe?
• Fully searchable across every book published by Packt • Copy and paste, print and bookmark content
• On demand and accessible via web browser
Free Access for Packt account holders
If you have an account with Packt at www.PacktPub.com, you can use this to access PacktLib today and view nine entirely free books. Simply use your login credentials for immediate access.
Table of Contents
Preface 1
Chapter 1: Introduction to Big Data and Hadoop
5
Big Data – what's the big deal? 5 The Apache Hadoop framework 9
HDFS 10
Chapter 2: Using Sqoop – The SQL Server Hadoop Connector
15
The SQL Server-Hadoop Connector 16
Installation prerequisites 17
A Hadoop cluster on Linux 17
Installing and configuring Sqoop 17
Setting up the Microsoft JDBC driver 18
Downloading the SQL Server-Hadoop Connector 18 Installing the SQL Server-Hadoop Connector 19 The Sqoop import tool 19
The Sqoop export tool 23
Data types 24
Summary 27
Chapter 3: Using the Hive ODBC Driver
29
The Hive ODBC Driver 30
SQL Server Integration Services (SSIS) 36
SSIS as an ETL – extract, transform, and load tool 36
Developing the package 37
Creating the project 37 Creating the Data Flow 39 Creating the source Hive connection 39 Creating the destination SQL connection 42 Creating the Hive source component 44 Creating the SQL destination component 46 Mapping the columns 48 Running the package 49
Summary 51
Chapter 4: Creating a Data Model with SQL Server
Analysis Services
53
Configuring the SQL Linked Server to Hive 54
The Linked Server script 58 Using OpenQuery 59 Creating a view 59
Creating an SSAS data model 60
Summary 70
Chapter 5: Using Microsoft's Self-Service Business
Intelligence Tools
71
PowerPivot enhancements 72
Power View for Excel 79
Summary 80
Preface
Data management needs have evolved from traditional relational storage to both relational and non-relational storage and a modern information management platform needs to support all types of data. To deliver insight on any data, you need a platform that provides a complete set of capabilities for data management across relational, non-relational, and streaming data while being able to seamlessly move data from one type to another and being able to monitor and manage all your data regardless of the type of data or data structure it is. Apache Hadoop is the widely accepted Big Data tool, similarly, when it comes to RDBMS, SQL Server 2012 is perhaps the most powerful, in-memory and dynamic data storage and management system. This book enables the reader to bridge the gap between Hadoop and SQL Server, in other words, between the non-relational and relational data management worlds. The book specifically focusses on the data integration and visualization solutions that are available with the rich Business Intelligence suite of SQL Server and their seamless communication with Apache Hadoop and Hive.
What this book covers
Chapter 1, Introduction to Big Data and Hadoop, introduces the reader to the Big Data and Hadoop world. This chapter explains the need for Big Data solutions, the current market trends, and enables the user to be a step ahead during the data explosion that is soon to happen.
Chapter 2, Using Sqoop – SQL Server Hadoop Connector, covers the open source
Sqoop-based Hadoop Connector for Microsoft SQL Server. This chapter explains the basic Sqoop commands to import/export files to and from SQL Server and Hadoop.
Chapter 4, Creating a data model with SQL Server Analysis Services, illustrates how to consume data from Hadoop and Hive from SQL Server Analysis Services. The reader will learn to use the Hive ODBC driver to create a Linked Server from SQL to Hive and build an Analysis Services multidimensional model.
Chapter 5, Using Microsoft's Self-Service Business Intelligence Tools, introduces the reader to the rich set of self-service BI tools available with SQL Server 2012 BI suite. This chapter explains how to build powerful visualization on Hadoop data quickly and easily with a few mouse clicks.
What you need for this book
Following are the software prerequisites for running the samples in the book: • Apache Hadoop 1.0 cluster with Hive 0.9 configured
• SQL Server 2012 with Integration Services and Analysis Services installed • Microsoft Office 2013
Who this book is for
This book is for readers who are already familiar with Hadoop and its supporting technologies and are willing to cross pollinate their skills with Microsoft SQL Server 2012 Business Intelligence suite. The readers will learn how to integrate data between these two ecosystems to provide more meaningful insights while visualizing the data. This book also gives the reader a glimpse of the self-service BI tools available with SQL Server and Excel and how to leverage them to generate powerful
visualization of data in a matter of few clicks.
Conventions
In this book, you will find a number of styles of text that distinguish between different kinds of information. Here are some examples of these styles, and an explanation of their meaning.
Preface
[ 3 ]
Any command-line input or output is written as follows:
$bin/ sqoop import --connect
"jdbc:sqlserver://<YourServerName>;username=<user>;password=<pwd>; database=Adventureworks2012" --table ErrorLog --target-dir
/data/ErrorLogs –-as-textfile
New terms and important words are shown in bold. Words that you see on the screen, in menus or dialog boxes for example, appear in the text like this: "First, create a System DSN. In ODBC Data Sources Administrator, go to the System DSN
tab and click on the Add Button as shown in the following screenshot".
Warnings or important notes appear in a box like this.
Tips and tricks appear like this.
Reader feedback
Feedback from our readers is always welcome. Let us know what you think about this book—what you liked or may have disliked. Reader feedback is important for us to develop titles that you really get the most out of.
To send us general feedback, simply send an e-mail to [email protected], and mention the book title via the subject of your message.
If there is a topic that you have expertise in and you are interested in either writing or contributing to a book, see our author guide on www.packtpub.com/authors.
Customer support
Errata
Although we have taken every care to ensure the accuracy of our content, mistakes do happen. If you find a mistake in one of our books—maybe a mistake in the text or the code—we would be grateful if you would report this to us. By doing so, you can save other readers from frustration and help us improve subsequent versions of this book. If you find any errata, please report them by visiting http://www.packtpub.com/ submit-errata, selecting your book, clicking on the erratasubmissionform link, and entering the details of your errata. Once your errata are verified, your submission will be accepted and the errata will be uploaded on our website, or added to any list of existing errata, under the Errata section of that title. Any existing errata can be viewed by selecting your title from http://www.packtpub.com/support.
Piracy
Piracy of copyright material on the Internet is an ongoing problem across all media. At Packt, we take the protection of our copyright and licenses very seriously. If you come across any illegal copies of our works, in any form, on the Internet, please provide us with the location address or website name immediately so that we can pursue a remedy.
Please contact us at [email protected] with a link to the suspected pirated material.
We appreciate your help in protecting our authors, and our ability to bring you valuable content.
Questions
Introduction to Big Data
and Hadoop
Suddenly, Big Data is the talk of the town. Every company ranging from enterprise-level to small-scale startups has money for Big Data. The storage and hardware costs have dramatically reduced over the past few years enabling the businesses to store and analyze data, which were earlier discarded due to storage and processing challenges. There has never been a more exciting time with respect to the world of data. We are seeing the convergence of significant trends that are fundamentally transforming the industry and a new era of tech innovation in areas such as social, mobile, advanced analytics, and machine learning. We're seeing an explosion of data where there is an entirely new scale and scope to the kinds of data we are trying to gain insights from. In this chapter, we will get an insight on what Big Data is and how the Apache Hadoop framework comes in the picture when implementing Big Data solutions. After reading through the chapter, you will be able to understand:
• What is Big Data and why now • Business needs for Big Data • The Apache Hadoop framework
Big Data – what's the big deal?
However, having a platform that supports the data trend is only a part of today's challenge; you need to also make it easier for people to access so that they can gain insight and make better decisions. If you think about the user experience, with everything we are able to do on the Web, our experiences through social media sites, how we're discovering, sharing, and collaborating in new ways, user expectations of their business, and productivity applications are changing as well.
One of the first questions we should set out to answer is a simple definitional one: how is Big Data different from traditional large data warehouses? International Data Corporation has the most broadly accepted theory of classifying Big Data as the three Vs:
• Volume: Data volume is exploding. In the last few decades, computing and storage capacity have grown exponentially, driving down hardware and storage costs to near zero and making them a commodity. The current data processing needs are evolving and are demanding analysis of petabytes and zetabytes of data with industry standard hardware within minutes if not seconds.
• Variety: The variety of data is increasing. It's all getting stored and nearly
85 percent of new data is unstructured data. The data can be in the form of tweets, JSONs with variable attributes and elements of which users may want to process selective ones.
• Velocity: The velocity of data is speeding up the pace of business. Data
capture has become nearly instantaneous, thanks to new customer interaction points and technologies. Real-time analytics is more important than ever. The ratio of data remittance rate continues to be way higher than the data consumption rate; coping with the speed of data continues to be a challenge. Think about a software that can let you message or type as fast as the speed of your thought.
Chapter 1
[ 7 ]
To answer today's types of question, you need new ways to discover and explore data. By this we mean, data that may reside in a number of different domains such as:
• Personal data: This is data created by me, or by my peers, but relevant for the task at hand.
• Organizational data: This is data that is maintained and managed across the organization.
• Community data: This is external data such as curated third party datasets
that are shared into the public domain. Examples include Data.gov, Twitter, Facebook, and so on.
• World data: This is all the other data that is available on the global stage, for
example, data from sensors or logfiles, and for which technologies such as Hadoop for Big Data have emerged.
You could derive much deeper business insight and trends by combining the data you need across personal, corporate, community, and world data. You can connect and combine data from hundreds of trusted data providers—data includes demographic data, environment data, financial data, retail and sports data, social data such as twitter and facebook as well as data cleansing services. You can combine this data with your personal data through self-service tools, for example, PowerPivot, you can use reference data for cleansing your corporate data with SQL Server 2012, or you can use it in your custom applications.
In a traditional business environment, the data to power your reporting mechanism will usually come from tables in a database. However, it's increasingly necessary to supplement this with data obtained from outside your organization. This may be commercially available datasets, such as those available from Windows Data Market and elsewhere, or it may be data from less structured sources such as feeds, e-mails, logfiles, and more. You will, in most cases, need to cleanse, validate, and transform this data before loading it into an existing database. Extract, Transform, and Load
(ETL) operations can use Big Data solutions to perform pattern matching, data categorization, deduplication, and summary operations on unstructured or semi-structured data to generate data in the familiar rows and columns format that can be imported into a database table. The following figure will give you a conceptual view of Big Data:
BIG DATA
Petabytes
Terabytes
Gigabytes
Megabytes
Data Complexity: Variety and Velocity
Social
Sentiments Log Files Signals
Clickstream Audio/Video Feeds
Traditional ERP/CRM Business
Emails Blogs/Wikis Weather
Chapter 1
[ 9 ]
The data store in a Big Data implementation is usually referred to as a NoSQL store, although this is not technically accurate because some implementations do support a SQL-like query language. NoSQL storage is typically much cheaper than relational storage, and usually supports a write-once capability that allows only for data to be appended. To update data in these stores you must drop and recreate the relevant file. This limitation maximizes performance; Big Data storage implementations are usually measured by throughput rather than capacity because this is usually the most significant factor for both storage and query efficiency. This approach also provides better performance and maintains the history of changes to the data.
However, it is extremely important to note that, in addition to supporting all types of data, moving data to and from a non-relational store such as Hadoop and a relational data warehouse such as SQL Server is one of the key Big Data customer usage patterns. Throughout this book, we will explore how we can integrate Hadoop and SQL Server and derive powerful visualization on any data using the SQL Server BI suite.
The Apache Hadoop framework
Hadoop is an open source software framework that supports data-intensive distributed applications available through the Apache Open Source community. It consists of a distributed file system HDFS, the Hadoop Distributed File System and an approach to distributed processing of analysis called MapReduce. It is written in Java and based on the Linux/Unix platform.
It's used (extensively now) in the processing of streams of data that go well beyond even the largest enterprise datasets in size. Whether it's sensor, clickstream, social media, location-based, or other data that is generated and collected in large gobs, Hadoop is often on the scene in the service of processing and analyzing it. The real magic of Hadoop is its ability to move the processing or computing logic to the data where it resides as opposed to traditional systems, which focus on a scaled-up single server, move the data to that central processing unit and process the data there. This model does not work on the volume, velocity, and variety of data that present day industry is looking to mine for business intelligence. Hence, Hadoop with its powerful fault tolerant and reliable file system and highly optimized distributed computing model, is one of the leaders in the Big Data world.
HDFS
Hadoop Distributed File System is a program level abstraction on top of the host OS file system. It is responsible for storing data on the cluster. Data is split into blocks and distributed across multiple nodes in the cluster.
MapReduce
MapReduce is a programming model for processing large datasets using distributed computing on clusters of computers. MapReduce consists of two phases: dividing the data across a large number of separate processing units (called Map), and then combining the results produced by these individual processes into a unified result set (called Reduce). Between Map and Reduce, shuffle and sort occur. Hadoop cluster, once successfully configured on a system, has the following basic components:
NameNode
This is also called the Head Node/Master Node of the cluster. Primarily, it holds the metadata for HDFS during processing of data which is distributed across the nodes; it keeps track of each HDFS data block in the nodes.
The NameNode is the single point of failure in a Hadoop cluster.
Secondary NameNode
This is an optional node that you can have in your cluster to back up the NameNode if it goes down. If a secondary NameNode is configured, it keeps a periodic snapshot of the NameNode configuration to serve as a backup when needed. However, there is no automated way for failing over to the secondary NameNode; if the primary NameNode goes down, a manual intervention is needed. This essentially means that there would be an obvious down time in your cluster in case the NameNode goes down.
DataNode
Chapter 1
[ 11 ]
JobTracker
This is a service running on the NameNode, which manages MapReduce jobs and distributes individual tasks.
TaskTracker
This is a service running on the DataNodes, which instantiates and monitors individual Map and Reduce tasks that are submitted.
Additionally, there are a number of supporting projects for Hadoop, each having their unique purpose for example, to feed input data to Hadoop system, a data warehousing system for ad hoc queries on top of Hadoop, and many more. The following are a few worth mentioning:
Hive
Hive is a supporting project for the main Apache Hadoop project and is an abstraction on top of MapReduce, which allows users to query the data without developing MapReduce applications. It provides the user with a SQL-like query language called Hive Query Language (HQL) to fetch data from Hive store. This
makes it easier for people with SQL skills to adapt to Hadoop environment quickly.
Pig
Pig is an alternative abstraction on MapReduce, which uses dataflow scripting
language called PigLatin. This is favored by programmers who already have scripting skills. You can run PigLatin statements interactively in a command line Pig shell named Grunt. You can also combine a sequence of PigLatin statements in a script, which can then be executed as a unit. These PigLatin statements are used to generate MapReduce jobs by the Pig interpreter and are executed on the HDFS data.
Flume
Flume is another open source implementation on top of Hadoop, which provides a data-ingestion mechanism for data into HDFS as data is generated.
Sqoop
Sqoop provides a way to import and export data to and from relational database tables (for example, SQL Server) and HDFS.
Oozie
Oozie allows creation of workflow of MapReduce jobs. This is familiar with developers who have worked on Workflow and communication foundation based solutions.
HBase
Chapter 1
[ 13 ]
Mahout
Mahout is a machine-learning library that contains algorithms for clustering and classification. One major focus of machine-learning research is to automatically learn to recognize complex patterns and make intelligent decisions based on data.
The following figure gives you a 1000 feet view of the Apache Hadoop and the various supporting projects that form this amazing ecosystem:
Data Access Layer (ODBC/SQOOP/REST)
Scripting (Pig) Query (Hive) Machine Learning (Mahout)
Distributed Processing (Map Reduce)
Distributed Storage (HDFS)
Business Intelligence (Excel, Powerview...)
We will be exploring some of these components in the subsequent chapters of this book, but for a complete reference, please visit the Apache website http://hadoop.apache.org/.
Summary
In this chapter, we went through what Big Data is and why it is one of the
compelling needs of the industry. The diversity of data that needs to be processed has taken Information Technology to heights that were never imagined before. Organizations that are able to take advantage of Big Data to parse any and every data will be able to more effectively differentiate and derive new value for the business, whether it is in the form of revenue growth, cost savings, or creating entirely new business models. For example, financial firms using machine learning to build better fraud detection algorithms, go beyond the simple business rules involving charge frequency and location to also include an individual's customized buying patterns ultimately leading to a better customer experience.
When it comes to Big Data implementations, these new requirements challenge traditional data management technologies and call for a new approach to enable organizations to effectively manage, enrich, and gain insights from any data. Apache Hadoop is one of the undoubted leaders in the Big Data industry. The entire ecosystem, along with its supporting projects provides the users a highly reliable, fault tolerant framework that can be used for massively parallel distributed processing of unstructured and semi-structured data.
Using Sqoop – The SQL
Server Hadoop Connector
Sqoop is an open source Apache project, which facilitates data exchange between Hadoop and any traditional Relational Database Management System (RDBMS). It uses the MapReduce framework under the hood to perform the import/export operations and often is a common choice for integrating data from relational and non-relational data stores.
Microsoft SQL Server Connector for Apache Hadoop (SQL Server-Hadoop Connector) is a Sqoop-based connector that is specifically designed for efficient data transfer between SQL Server and Hadoop. This connector is optimized for bulk transfer of the data bi-directionally, it does not support extensive formatting or transformation on the data while being imported or exported on the fly. After reading this chapter, you will be able to:
The SQL Server-Hadoop Connector
Sqoop is implemented using JDBC and so it also conforms to the standard JDBC features. The schema or the structure of the data is provided by the data source, and Sqoop generates and executes SQL statements using JDBC. The following table summarizes a few important commands that are available with the SQL Server connector and their functionalities:
Command Function
sqoop import
The import command lets you import SQL Server data into HDFS. You can opt to import an entire table using the --table switch or selected records based on criteria using the --query switch. The data, once imported to the Hadoop file system, are stored as delimited text files or as SequenceFiles for further processing. You can also use the import command to move SQL Server data into Hive tables, which are like logical schemas on top of HDFS.
sqoop export
You can use the export command to move data from HDFS into SQL Server tables. Much like the import command, the export command lets you export data from delimited text files, SequenceFiles, and Hive tables into SQL Server. The export command supports inserting new rows to the target SQL Server table, update existing rows based on an update key column as well as invoking a stored procedure execution. sqoop job The job command enables you to save your import/export
commands as a job for future reuse. The saved jobs remember the parameters that are specified during execution and particularly useful when there is a need to run an import/export command repeatedly on a periodic basis.
sqoop version
To quickly check the version of sqoop you are on, you can run the sqoop version command to print the installed version details in
the console.
The SequenceFiles in Hadoop are binary content that contain serialized data as opposed to delimited text files. Please refer to the Hadoop page http://hadoop. apache.org/docs/current/api/org/apache/hadoop/io/SequenceFile.html for a detailed understanding on how SequenceFiles are structured. Also, we would go through a few sample import/export commands with different arguments in the subsequent sections of this chapter. Please refer to the Apache Sqoop user guide http://sqoop.apache.org/docs/1.4.2/SqoopUserGuide.html for a complete reference on Sqoop commands and their switches.
Chapter 2
[ 17 ]
Installation prerequisites
This chapter assumes that you have a Linux cluster with Hadoop and Hive
configured and a Windows system with SQL Server 2012 running on it. Both of these environments are required to use the SQL Server-Hadoop Connector and to run the sample commands in this chapter.
A Hadoop cluster on Linux
The first step is to have a Hadoop cluster up and running on Linux. We will use this cluster's HDFS to import and export data from SQL Server. The sample commands in this chapter assume that they are run on Hadoop Version 1.1.0, Hive Version 0.9.0 on Red Hat Enterprise Linux 5.8.
Make sure that the HADOOP_HOME environment variable is set to the parent directory, where Hadoop is installed.
Installing and configuring Sqoop
The next step is to install and configure the Sqoop connector, if not already installed, on the NameNode of your Hadoop cluster. I recommend downloading and installing Sqoop 1.4.2 from Apache's website, which is the version used to run the sample commands in this chapter.
After the installation is done, you must verify whether the Sqoop environment variables are set with proper values. They should be set to point to the path as described in the following table for the SQL Server-Hadoop Connector to function correctly. This also relieves you from fully qualifying the path of the various Sqoop command-line utilities each time you need to execute them.
The following table describes Sqoop environment variables:
Environment Variable Value to Assign
SQOOP_HOME Absolute path where you have installed Sqoop. SQOOP_CONF_DIR $SQOOP_HOME/conf assuming that SQOOP_HOME
Setting up the Microsoft JDBC driver
Sqoop and SQL Server-Hadoop Connector uses Java Database Connectivity (JDBC) technology to establish connections to remote RDBMS servers and therefore needs the JDBC driver for SQL Server. This chapter assumes the usage of the SQL Server JDBC driver Version 3.0 (sqljdbc_3.0). To install this driver on the Linux NameNode, where you have just installed Sqoop, perform the following steps:
1. Visit http://www.microsoft.com/en-us/download/details.
aspx?displaylang=en&id=21599 and download sqljdbc_3.0_enu.tar.gz to the NameNode of your cluster.
2. Use the following command to unpack the downloaded file: tar –zxvf sqljdbc_3.0_enu.tar.gz. This will create a directory sqljdbc_3.0 in current directory.
3. Copy the driver jar (sqljdbc_3.0/enu/sqljdbc4.jar) file to the $SQOOP_HOME/lib directory on the NameNode.
Downloading the SQL Server-Hadoop
Connector
If you have reached this point, finally, you are ready to download, install, and configure the SQL Server-Hadoop Connector on the NameNode of your cluster. The Microsoft SQL Server SQOOP Connector for Hadoop is now part of Apache SQOOP 1.4.x series of projects, and Microsoft no longer provides a separate download from their site. The connector is now downloadable from Apache's website: http://sqoop.apache.org/
The following table summarizes the different files that are deployed to the
NameNode once the connector is downloaded. The table contains the SQL Server-Hadoop Connector installer archive:
File/Directory Description
install.sh This is a shell script that has commands to copy the necessary files and directory structure for the SQL Server-Hadoop Connector.
Microsoft SQL
Server-Hadoop
Connector User Guide.pdf
Chapter 2
[ 19 ]
File/Directory Description
lib/ This directory contains the sqoop-sqlserver-1.0.jar file. This is the archive that has most of the Sqoop command definitions.
conf/ This directory contains the configuration files for SQL Server-Hadoop Connector.
THIRDPARTYNOTICES FOR HADOOP-BASED CONNECTORS.txt
This document consists of the third party notices.
SQL Server Connector for Apache Hadoop MSLT.pdf
End User License Agreement for the SQL Server Connector for Apache Hadoop.
Installing the SQL Server-Hadoop
Connector
The following steps need to be performed in order to install SQL Server-Hadoop Connector:
1. Log in to your cluster NameNode using a user credential, which has the permission to install files.
2. Extract the archive with the command: tar –zxvf sqoop-sqlserver-1.0.tar.gz. This will create sqoop-sqlserver-1.0 directory in the present working directory.
3. Ensure that the MSSQL_CONNECTOR_HOME environment variable is set to the absolute path of the sqoop-sqlserver-1.0 directory.
4. Change directory (cd) to the sqoop-sqlserver-1.0 and run the shell scriptinstall.sh without any additional arguments.
5. Installer will copy the connector jar and configuration files under existing Sqoop installation directory.
The Sqoop import tool
When using the sqoop import command, you must specify the following mandatory arguments:
• --connect argument specifying the connection string to the SQL Server database
• --username and --password arguments to provide valid credentials to connect to the SQL Server database
• --table or --query argument to import an entire table or results of a custom query execution
The following command imports data from ErrorLog table in SQL Server Adventureworks2012 database to delimited text files in /data/ErrorLogs directory on HDFS.
Sqoop 1.4.2 does not recognize SQL Server tables, which do not belong to the default dbo schema. This is fixed with the addition of the --schema switch, where you can specify non-default schema names in Sqoop 1.4.3.
The following command describes how to import data to HDFS from SQL Server table:
$bin/ sqoop import --connect
"jdbc:sqlserver://<YourServerName>;username=<user>;password=<pwd>; database=Adventureworks2012" --table ErrorLog --target-dir
/data/ErrorLogs –-as-textfile
Chapter 2
[ 21 ]
You can specify a --split-by argument to the sqoop import command and specify a column to determine how the data is split between the mappers. If you do not specify a split-by column, then, by default, the primary key column is used. The following command specifies split-by column to compute the splits for mappers:
$bin/sqoop import --connect
"jdbc:sqlserver://<YourServerName>;username=<user>;
password=<pwd>;database=Adventureworks2012" --table ErrorLog -- target-dir /data/ErrorLogsSplitBy --split-by ErrorLogID -m 3
Importing the tables in Hive
Sqoop provides you with -hive-import argument to import a SQL Server table directly into a Hive table. The following command shows how to import SQL Server data to Hive:
$bin/ sqoop import --connect
"jdbc:sqlserver://<YourServerName>;username=<user>;password=<pwd>; database=Adventureworks2012" --table ErrorLog -hive-import
Note the difference in the last section of the command line output, which confirms the operation in Hive as shown in the following screenshot:
Chapter 2
[ 23 ]
After running the import commands, you can verify the output folders created in your Hadoop NameNode admin portal as shown in the following screenshot:
The Sqoop export tool
As stated earlier, Sqoop is a bi-directional connector. Sqoop's export process will read a set of delimited text files from HDFS in parallel, parse them into records, and insert them as new rows in a target database table. The following examples export data from HDFS and Hive to SQL Server. The assumption is that you are running the commands from the $SQOOP_HOME directory on the master node of the Hadoop cluster, where Sqoop is installed.
When using the sqoop export command, you must specify the following mandatory arguments:
• --connect argument specifying the connection string to the SQL Server database
• --username and --password arguments to provide valid credentials to connect to the SQL Server database
• --table or --call argument to export to an SQL table or invoke a stored procedure call
• --export-dir argument to specify the HDFS directory to export The following command exports data back from a delimited text file in /data/ErrorLogs on HDFS to ErrorLog table in Adventureworks2012 database on SQL Server:
$bin/ sqoop export --connect
"jdbc:sqlserver://<YourServerName>;username=<user>;password=<pwd>; database=Adventureworks2012" --table ErrorLog-export-dir
You can specify the number of mappers while executing your export command. The following command exports data from a delimited text file on HDFS with user defined number of map tasks:
$bin/sqoop export --connect
"jdbc:sqlserver://<YourServerName>;username=<user>;password=<pwd>; database=Adventureworks2012" --table ErrorLog-export-dir
/data/ErrorLogs-m 3
It is often a practice to use Sqoop to host data in an intermediate staging table to apply some transform and business logic before finally loading the data into the warehouse. The following command uses a staging table and specifies to first clear the staging table before starting the export:
$bin/sqoop export --connect
"jdbc:sqlserver://<YourServerName>;username=<user>;password=<pwd>; database=Adventureworks2012" --table ErrorLog
--export-dir /data/ErrorLogs--staging-table ErrorLog_stage --clear- staging-table
For current release, using --direct option has nothing to do with execution of import/export flow.
Data types
The following table summarizes the data types supported by this version of the SQL Server-Hadoop Connector. You should refer to this guide to avoid any type of compatibility issue during or after migration of data. All other native SQL Server types for example XML, geography, geometry, sql_variant, and so on, which are not mentioned in the following table are not supported as of now:
Data type
Sqoop data type range
Exact numeric bigint -2^63 to 2^63-1 Long Max_value: 2^63-1 (9223372036854775807)
Chapter 2
Sqoop data type range
int -2^31 to 2^31-1 Integer Max_value: 2^31-1
(2147483647)
Date and time date January 1, 1 A.D. through December 31, 9999 A.D
java.sql. Date
int year, int month, int date:
year: the year minus 1900. Must be 0 to 8099(Note that 8099 is 9999 minus 1900)
Data type
Sqoop data type range
Character
String Up to 8,000 characters
varchar Variable-length,
String Up to 8,000 characters
Unicode
String Up to 4,000 Unicode characters
String Up to 4,000 Unicode characters
Chapter 2
Sqoop data type range
varbina
For a complete list of supported data types, please refer to the SQL Server-Hadoop Connector reference at http://www.microsoft.com/en-us/download/ confirmation.aspx?id=27584.
Summary
Using the Hive ODBC Driver
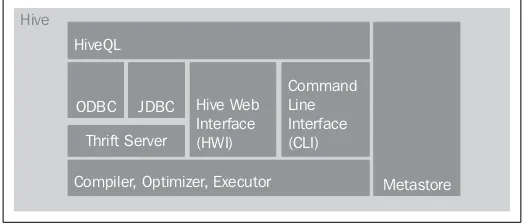
Hive is a framework that sits on top of core Hadoop. It acts as a data warehousing system on top of HDFS and provides easy query mechanisms to the underlying HDFS data. Programming MapReduce jobs could be tedious and will have their own development, testing, and maintenance investments. Hive queries, called Hive Query Language (HQL) are broken down into MapReduce jobs under the hood and remain a complete abstraction to the user and provide a query-based access mechanism for Hadoop data. The simplicity and "SQL" – ness of the Hive queries have made it a popular and preferred choice for users, particularly, people familiar with traditional SQL skills love it since the ramp up time is much less. The following figure gives an overview of the Hive architecture:
In effect, Hive enables you to create an interface layer over MapReduce that can be used in a similar fashion to a traditional relational database; enabling business users to use familiar tools such as Excel and SQL Server Reporting Services to consume data from Hadoop in a similar way as they would from a database system as SQL Server remotely through a ODBC connection. The rest of this chapter walks you through different Hive operations and using the Hive ODBC driver to consume the data.
After completing this chapter you will be able to: • Download and install the Hive ODBC Driver
• Configure the driver to connect to Hive running on your Hadoop cluster on Linux
• Use SQL Server Integration Services (SSIS) to import data from Hive to SQL Server
The Hive ODBC Driver
One of the main advantages of Hive is that it provides a querying experience that is similar to that of a relational database, which is a familiar technique for many business users. Essentially, it allows all ODBC compliant clients to consume HDFS data through familiar ODBC Data Sources (DSN), thus exposing Hadoop to a wide and diverse range of client applications.
Chapter 3
[ 31 ]
The driver comes in two flavors, 64 bit and 32 bit, so please make sure that you download and install the appropriate driver depending upon the bit configuration of your client application. In my case, since I am going to use the driver from 32 bit applications as Visual Studio, I have used the 32 bit flavor of the driver. Once, installation of the driver is complete, you can confirm the installation status by checking if you have the Hive ODBC driver present in the ODBC Data Administrator's list of drivers as shown in the following screenshot:
Once the driver is installed successfully, perform the following steps to ensure that you can make a successful connection to Hive:
1. First, create a System DSN. In ODBC Data Sources Administrator, go to the System DSN tab and click on the Add Button as shown in the following screenshot:
Chapter 3
[ 33 ]
3. On clicking Finish, you are presented with the final ODBC Hive Setup
4. Once created, a new System DSN should appear in the list as in the following screenshot. In this case, I have named my DSN as HadoopOnLinux.
5. Now, we need to test the connection to Hive using the DSN
Chapter 3
[ 35 ]
6. Choose Microsoft OLE DB Provider for ODBC Drivers and click on Next. 7. Choose the DSN HadoopOnLinux created in the previous steps. Provide
the User name and Password for your Hadoop cluster and click on the Test Connection button. A successful test connection will confirm that the Hive
SQL Server Integration Services (SSIS)
Microsoft SQL Server is a complete suite of tools that include an RDBMS system, a multidimensional OLAP and tabular database engines, as well as other services, for example a broker service, a scheduling service (SQL Agent), and many more. As discussed in Chapter 1, Introduction to Big Data and Hadoop, it has become extremely important these days to integrate data between different sources. SQL Server also offers a powerful business intelligence stack, which provides rich features for data mining and interactive reporting. One of these BI components is an extract, transform, and load (ETL) tool calledSQL Server Integration Services (SSIS). SSIS offers the ability to merge structured and un-structured data by importing Hive data into SQL Server and apply powerful analytics on the integrated data. Throughout the rest of this chapter, we will get a basic understanding on how SSIS works and create a simple SSIS package to import data from Hive to SQL Server.
SSIS as an ETL – extract, transform, and
load tool
The primary objective of an ETL tool is to be able to import and export data to and from heterogeneous data sources. This includes the ability to connect to external systems, as well as to transform or clean the data while moving the data between the external systems and the databases. SSIS can be used to import data to and from SQL Server. It can even be used to move data between external non-SQL systems without requiring SQL server to be the source or the destination. For instance, SSIS can be used to move data from an FTP server to a local flat file.
SSIS also provides a workflow engine for automation of the different tasks (for example, data flows, tasks executions, and so on.) that are executed in an ETL job. An SSIS package execution can itself be one step that is part of an SQL Agent job, and SQL Agent can run multiple jobs independent of each other.
Chapter 3
[ 37 ]
A detailed discussion on SSIS and its components are outside the scope of this book and it assumes that you are familiar with the basic SSIS package development using Business Intelligence Development Studio (SQL Server 2005/2008/2008 R2) or SQL Server Data Tools (SQL Server 2012). If you are a beginner in SSIS, it is highly recommended to read from a bunch of good SSIS books available as a prerequisite. In the rest of this chapter, we will focus on how to consume Hive data from SSIS using the Hive ODBC driver.
The prerequisites to develop the package shown in this chapter are SQL Server Data Tools, (which comes as a part of SQL Server 2012 Client Tools and Components) and the 32 bit Hive ODBC Driver installed. You will also need your Hadoop cluster up with Hive running on it.
Developing the package
SQL Server Data Tools (SSDT) is the integrated development environment available from Microsoft to design, deploy, and develop SSIS packages. SSDT is installed when you choose to install SQL Server Client tools and Workstation Components from your SQL Server installation media. SSDT supports creation of Integration Services, Analysis Services, and Reporting Services projects. Here, we will focus on Integration Services project type.
Creating the project
Perform the following steps for creating a new project.
2. Create a new Project and choose Integration Services Project in the
New Project dialog as shown in the following screenshot:
Chapter 3
[ 39 ]
Creating the Data Flow
A Data Flow is a SSIS package component, which consists of the sources and destinations that extract and load data, the transformations that modify and extend data, and the paths that link sources, transformations, and destinations. Before you can add a data flow to a package, the package control flow must include a Data Flow task. The Data Flow task is the executable within the SSIS package, which creates, orders, and runs the data flow. A separate instance of the data flow engine is opened for each Data Flow task in a package. To create a Data Flow task, perform the following steps:
1. Double-click (or drag-and-drop) on a Data Flow Task from the toolbox on the left. This should place a Data Flow Task in the Control Flow canvas of the package as in the following screenshot:
2. Double-click on the Data Flow Task or click on the Data Flow tab in SSDT
to edit the task and design the source and destination components as in the following screenshot:
Creating the source Hive connection
1. Right-click on the Connection Managers section in the project and click on
New ADO.Net Connection... as shown in the following screenshot:
2. From the list of providers, navigate to .Net Providers | ODBC Data Provider
Chapter 3
[ 41 ]
Creating the destination SQL connection
We will need to configure a connection to point to the SQL Server instance and the database table, where we will import data from Hive. For this, we will need to create a connection manager to the destination SQL as we did for the source Hive:
Chapter 3
[ 43 ]
2. From the list of providers, choose Native OLE DB | SQL Server Native Client 11.0. Key in the target SQL Server name and select the database where the target table resides. Test connection should succeed confirming the validity of the connection manager for the destination as shown in the following screenshot:
Creating the Hive source component
Next, we will need to configure a source component, which will connect to Hive and fetch the data. After the connection is successfully created, double-click to place an
ADO NET Source on the Data Flow canvas as shown in the following screenshot:
Chapter 3
[ 45 ]
Right-Click on the ADO NET Source and click on Edit to configure the source to
connect to the Hive table using the connection just created. Select the connection manager (I named it Hive Connection) and the Hive table (In my case, it is the facebookinsights table). You can preview the data to ensure that the source can fetch the data without issues. Also, make sure, you navigate to the Columns tab and confirm that you can see all the columns from the table. Click on OK to complete the configuration as shown in following screenshot:
Creating the SQL destination component
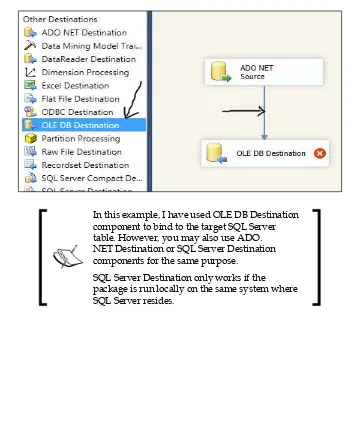
After the source is configured, we need to configure the destination where we want to import the Hive data. In this example, I am going to use SQL Server as the destination. To do this, double-click and place an OLE DB Destination component in the Data Flow canvas. Make sure, you connect the ADO NET Source and theOLE DB Destination components by dragging the arrow between the source and the destination. This is required for SSIS to generate the metadata and the column mappings for the destination automatically based on the source schema structure. The package should look something like the following screenshot:
In this example, I have used OLE DB Destination component to bind to the target SQL Server table. However, you may also use ADO. NET Destination or SQL Server Destination components for the same purpose.
Chapter 3
[ 47 ]
Now, it is the time to configure the OLE DB Destination to point to the correct SQL connection and database table. To do this, right-click on the OLE DB Destination
component and click on Edit. Select the OLE DB connection manager to SQL that we just created and the target table. In this case, I have named the connection as
SQL Connection and I already have a predefined table created in the SQL database
called facebookinsights. In case you don't have the table precreated, you can choose to create the destination table on the fly by clicking on the New button, adjacent to the Name of the table or the view drop-down. This is illustrated in the
following screenshot:
Mapping the columns
Once this is done, make sure you navigate to the Mappings tab to ensure that the column mappings between the source and the destination is correct as shown in the following screenshot. Click on OK to complete the configuration.
Chapter 3
[ 49 ]
The data flow between the source and destination along with the connection managers should like the following screenshot:
Running the package
Voila!! We are all set to go. From the menu bar, navigate to Debug | Start Debugging or press F5 or click on the Play button in the toolbar to execute the package as shown in the following screenshot:
In case you are running this package in a 64 bit Windows Operating System, you will need to change the Run64BitRuntime property to False from the Project Properties | Configuration Properties | Debugging tab to execute the package as it is using the 32 bit Hive ODBC driver as shown in the following screenshot:
Chapter 3
[ 51 ]
Summary
Creating a Data Model
with SQL Server
Analysis Services
Apache Hadoop brings flexibility and scale to an extent which is not possible in the traditional RDBMS-based data warehousing systems for example, SQL Server. On top of the core Hadoop, Hive acts as a data warehouse to provide a logical schema over your HDFS data, which allows ad hoc query mechanisms to work with large datasets. However, query execution, performance, and turnaround times are often decisive factors for most common BI implementation scenarios. Query responses from Hadoop and Hive are predominantly batch operations, which are designed and expected to be time consuming and no-way close to real time. But there are scenarios that businesses demand, where they need real-time answers to their queries.You could import data from Hadoop to SQL Server Analysis Services (SSAS) by using Hive Query Language (HQL). Analysis Services can then take it up from there and provide real-time insights and powerful reporting on the data. After completing this chapter, you should be able to:
• Create a SQL Linked Server to Hive
• Query the SQL Linked Server to fetch data from Hive
Configuring the SQL Linked Server
to Hive
Since Hive tables are exposed only through ODBC, there is no direct way to connect an Analysis Services database to Hadoop as Analysis Services can only connect to OLE DB compliant data sources. To address this, the only way is to create a Linked Server in a SQL Server instance using Hive ODBC driver and consume it through OLE DB for ODBC. We will reuse the DSN HadoopOnLinux that we created during our earlier chapters to connect to Hive.
To create the Linked Server, perform the following steps:
Chapter 4
[ 55 ]
2. Right-click on Linked Servers and choose New Linked Server. This
Chapter 4
[ 57 ]
5. Click on OK and this should create a new Linked Server named
LINKTOHIVE under SQL Server Linked Servers as shown in the following screenshot. You can right-click on the Linked Server and test connection to confirm that everything is set up correctly.
If you are fond of script-based database objects creation, you can use the following script to create the Linked Server as well:
The Linked Server script
You can set up the Linked Server to Hive by executing the following Transact-SQL script from SQL Server Management Studio:
EXECmaster.dbo.sp_addlinkedserver@server=
N'LINKTOHIVE',@srvproduct=N'Hive',@provider=N'MSDASQL', @datasrc=N'HadoopOnLinux',@provstr=N'Provider=MSDASQL.1; Persist Security Info=True'
/* For security reasons the linked server remote logins password is changed with ######## */
EXECmaster.dbo.sp_addlinkedsrvlogin@rmtsrvname=N'LINKTOHIVE', @useself=N'False',@locallogin=NULL,@rmtuser=N'debarchans', @rmtpassword='########'
Chapter 4
[ 59 ]
You can use the OpenQuery Transact-SQL command to connect to the data source, run the query on the Hadoop cluster, and return the results to SQL Server.
Using OpenQuery
The following Transact-SQL script illustrates how to query the facebookinsights Hive table we created earlier using the SQL Linked Server:
SELECT * FROM OpenQuery([LINKTOHIVE], 'SELECT * FROM facebookinsights;')
Executing this query from Query Analyzer should show us the records from the Hive table as shown in the following screenshot:
The next section of this chapter discusses creating a Multidimensional Online Analytical Processing data model (MOLAP) from the data imported by the Linked Server query. However, multidimensional projects only support SQL tables or views as their data sources. So prior to jumping on to the Business Intelligence project, we would create a view in our SQL database based on the Linked Server query.
Creating a view
The following Transact-SQL creates the view from the OpenQuery statement we used previously:
Create View KeyMetrices AS
SELECT * FROM OpenQuery([LINKTOHIVE],'SELECT * FROM facebookinsights;')
Creating an SSAS data model
Once the Linked Server is created on the computer running SQL Server, it is pretty simple to connect Analysis Services to Hive in SQL Server Data Tools. The rest of this chapter will describe the way to import data from a Hive table into a SSAS Multidimensional and Data Mining Project using the view we created by following the steps as mentioned in the previous section.
Perform the following steps to create a SSAS data model:
1. In SQL Server Data Tools, on the File menu, click on New, and then click on
Project. In the New Project dialog box, under Installed Templates, navigate to Business Intelligence | Analysis Services, and then select Analysis Services Multidimensional and Data Mining Project as shown in the following screenshot:
Chapter 4
[ 61 ]
3. Once the project is created, the key tasks are to define your Data Sources and
Data Source Views, which you can see in the Solution Explorer window as in the following screenshot:
4. Right-click on Data Sources and choose New Data Source. This would
5. Next, you have to define the connection to the database where you created the Linked Server and the View. You could select the connection if it is already prepopulated in the Data Source Wizard, else, you could click on the
Chapter 4
[ 63 ]
7. Click on Next, you could choose a Data source name for your connection as shown in the following screenshot:
Chapter 4
[ 65 ]
Chapter 4
[ 67 ]
Chapter 4
[ 69 ]
13. Clicking on Finish will create the view and fetch the columns from the
You can follow these steps as many times as required to add additional tables or views you may want to add into the model. Once the objects are imported and the relationships are defined, you can further work on the project to define the cubes and dimensions for your data warehouse according to your specific requirements. SQL Server 2012 Analysis Services also supports the Tabular Project, which can suggest measures and facts for your warehouse based on the column data types. If you are interested, you can follow the blog http://dennyglee.com/2013/05/29/import-hadoop-data-into-sql-bi-semantic-model-tabular/ to learn how to create an AS tabular model from Hive data.
Summary
In this chapter, you learned how to leverage the Hive ODBC driver to consume Hadoop/Hive from Analysis Services. Since Analysis Services directly do not support ODBC, you have to create a Linked Server to Hive using the OLE DB to ODBC Bridge and in turn consume the Linked Server queries as data source from your Analysis Services Tabular project model. The Hive ODBC driver makes it easy to import data from your Hadoop Hive table into SQL Server Analysis Services multidimensional data models where Business Intelligence tools may be used to view, shape, and analyze the data further.
Using Microsoft's
Self-Service Business
Intelligence Tools
The focus of Business Intelligence is to empower business users with moreaccurate, reliable, and better information than they could obtain from operational systems. Traditional BI solutions have always relied on a centralized, cleansed, and transformed datastore that users can access through standardized reports and occasionally, an ad hoc query tool. Reports are developed by BI experts and the minimum requirement was to hire a set of professionals to run and maintain the infrastructure and the solutions.
Many executives have realized that the current BI approach is unable to keep pace with the inflow of data in a dynamic business environment. Data is everywhere now, and growing exponentially. Relying too much on a big-budget BI team for everything is no longer acceptable. This has led to the dawn of a new technology called self-service BI. Self-service BI is the talk of the town at the moment. It allows you to perform a professional level of data analysis quickly and efficiently without the need to hire an expensive set of BI infrastructure or a team of skilled individuals. Microsoft provides a set of rich self-service BI tools that can connect to a wide variety of data sources including SQL Server 2012 and Hadoop and quickly provide insights on the data. It combines with powerful reporting facilities and produces a seamless, interactive visualization on the underlying data. This is often at the top of the management pyramid where business executives review these reports and take decisions for betterment of the business and more efficient resource utilization. In this chapter you will learn about:
• Microsoft self-service BI tools
• Using PowerPivot to generate a data model
• Using Power View to create interactive report on the data model
PowerPivot enhancements
SQL Server 2012 brings in enhanced data analysis capabilities for both PowerPivot client in the form of the Excel add-in as well as the PowerPivot server-side
component in SharePoint. This enables Microsoft Office users to have self-service business intelligence capabilities with merely a few clicks, something which was never there before. Users are now able to integrate data from heterogeneous sources more easily and provide powerful visualization on the data using familiar tools such as Excel and SharePoint, thus enabling the businesses to take correct decisions.
Chapter 5
[ 73 ]
The following section explains how to generate a PowerPivot data model based on the facebookinsights Hive table created earlier using the Hive ODBC driver. We have used Excel 2013 for the demos. Make sure you turn on the required add-ins for Excel as shown in the following screenshot to build the samples used throughout this chapter:
1. Navigate to File | Options | Add-ins. In the Manage drop-down list, choose
COM Add-ins and click on Go, and enable the following add-ins:
2. To create a PowerPivot model, open Excel, navigate to the PowerPivot
ribbon and click on Manage as shown in the following screenshot:
This will bring up the PowerPivot for Excel window where we need to configure the connection to Hive.
Chapter 5
[ 75 ]
Chapter 5
[ 77 ]
6. The Table Import Wizard dialogue should now be populated with the appropriate Connection String as shown below in the following screenshot:
8. Select the facebookinsights table and click on Finish to complete the configuration as in the following screenshot:
9. The Hive table with all the rows should get successfully loaded in the PowerPivot model as shown in the following screenshot:
10. Close the Table Import Wizard.
The data is already added in the model, so we can go ahead and close the
Chapter 5
[ 79 ]
Power View for Excel
Microsoft Excel 2013 introduces a brand new self-service BI tool called Power View. This is also a part of Microsoft SharePoint 2013 included with SQL Server 2012 Reporting Services Service Pack 1 Add-in for Microsoft SharePoint Server 2013 Enterprise Edition. Both of the client side (Excel) and server side (SharePoint) implementations of Power View offer an interactive way to explore and visualize your data as well as to generate interactive reports on top of the underlying data. The rest of this chapter shows a sample Power View report based on the
facebookinsights table's data to give you a quick idea about the powerful reporting features from the surface level. The details on 'How to design a Power View report' as well as Power View integration with SharePoint is outside the scope of this book and are not discussed in depth.
Power View is only supported in Excel 2013. You need to install the Power View add-in for Excel.
To create a Power View report based on the PowerPivot data model created earlier, click on the Insert ribbon in Excel and click on Power View as shown in the following screenshot:
We can select the fields we require and display it in our report. There are options to choose between different types of charts, tabular and matrix reports. As an example, I've created a report which shows the number of likes and fans for my Facebook page over a period of time as shown in the following screenshot:
The Power View designer gives you different types of chart, axis, and timeline layouts, which make it really easy to generate a simple visualization. However, these self-service tools should not be thought as replacements to our existing BI solutions. It is not a replacement for standard parameterized reports, but an augmentation to enable key functions and leaders to leverage their own analytics, without pressuring scarce IT resources.
Summary
Index
Symbols
.udl (Universal Data Link) file 34
A
Business Intelligence (BI) 7, 71
C
Data Source View Wizard 65 data type categories
Approximate numeric 25 Binary strings 26
Character strings 26 Date and time 25
Unicode character strings 26 destination SQL connection
Extract, Transform, and Load (ETL) tool 8