Effect of Gamma Irradiation on Protein Profile of
Rodent Tuber (
Typhonium flagelliforme
Lodd.) In
Vitro Mutant Based on 1D and 2D PAGE Analyses
Nesti Fronika Sianipar
Food Technology Department, Faculty of Engineering Bina Nusantara University
Tangerang, Indonesia
[email protected]; [email protected]
Ragapadmi Purnamaningsih
Indonesian Center for Agricultural Biotechnology and Genetic Resources Research and Development (BB-Biogen)
Bogor, Indonesia [email protected]
Chelen
Biotechnology Department, Faculty of Life Science Surya University
Tangerang, Indonesia [email protected]
Abstract—Rodent tuber is an Indonesian anti-cancer herbal plant whose genetic variation is low. Genetic variation is crucial to be increased to enhance the content of anticancer bioactive compounds. In vitro calli of rodent tuber have been mutated by gamma irradiation. Mutant plants have their genome modified and therefore also affected protein expression. The purpose of this research was to identify protein expression differences between mutant and control rodent tuber plants by 1D and 2D PAGE. 1D PAGE has shown differences in the number of protein bands between control and mutant. M6/2 did not show any expression of 6,9 kD protein. 2D PAGE has identified 24 proteins which were expressed by control and M6/2 plants. Among them, 13 spots were up-regulated and 9 spots were down-regulated in M6/2 plants. In conclusion, 1D and 2D PAGE analyses have successfully proven the changes in protein expression between control and mutant rodent tuber plants.
Keywords—Typhonium flagelliforme Lodd.; In vitro mutant; 1D PAGE; 2D PAGE; Gamma irradiation
I. INTRODUCTION
Rodent tuber (Typhonium flagelliforme Lodd.) is an Indonesian native herbal plant which is commonly found in Java Island [1]. Bioactive compounds of rodent tuber are alkaloid, saponin [2], terpenoid, steroid [3], flavonoid, and glycoside [4]. Rodent tuber has anticancer activities against cancer of liver [5], breast, colon, prostate gland, cervix [2], and leukemia [6]. Rodent tuber has been propagated conventionally by tuber separation method. Thus, the genetic diversity of rodent tuber is low [2], while the potency of its bioactive compounds as anticancer medicine is high [7].
Rodent tuber has been propagated in vitro on Murashige and Skoog (MS) media supplemented with the optimum concentration of plant growth regulators, i.e. 1 mgL-1 1-Naphthaleneacetic acid (NAA) and 0.5 mgL-1 6-Benzyl Amino Purine (BAP) [8]. In vitro calli of rodent tuber have been irradiated with gamma rays and therefore produced in vitro
mutant plants of rodent tuber. Rodent tuber in vitro mutants and control plants, which are not irradiated by gamma rays, have shown differences in plant heights and mean number of shoots [9]. Gamma irradiation is one of the most common mutation methods [10] because it is effective to induce biochemical and physical changes of a plant [11]. Genetic mutation is able to induce changes in protein expressions [12] and secondary metabolite components [13] of a plant.
Proteomics is the systematic and quantitative analysis of the sequence, structure, function, modification, translocation, and biological expression control of cellular proteins [14]. Sodium Dodecyl Sulfate Polyacrylamide Gel Electrophoresis (SDS PAGE) is one of proteomics methods [15, 16, 17]. SDS PAGE separates proteins based on their molecular weights. A protein with bigger molecular weight will move slower to the positive pole rather than a protein with smaller molecular weight [12].
Two Dimensional Polyacrylamide Gel Electrophoresis(2D PAGE) is one of PAGE methods which combines the principle of SDS PAGE and Isoelectric Focusing (IEF) [18]. 2D PAGE separates proteins based on their molecular weights and isoelectric points. 2D PAGE is commonly used to identify new proteins and compare the quantity of proteins in different samples [19]. 2D PAGE is able to identify more than 2000 proteins in one gel, so this method is very useful for proteomics analysis [18]. Protein expression of rodent tuber in vitro mutants has never been identified before. This research was aimed to analyze the effect of gamma irradiation on protein expression of rodent tuber in vitro mutants by identifying the 1D SDS and 2D PAGE protein profile differences between control and mutant plants.
2015 International Conference on Automation, Cognitive Science, Optics, Micro Electro-Mechanical System, and Information Technology (ICACOMIT), Bandung, Indonesia, October 29–30, 2015
II. MATERIALS AND METHODS
Schematic diagram of research process
A. Preparation of Planting Materials
Rodent tuber in vitro mutants was propagated in vitro on Murashige and Skoog (MS) media supplemented with 1 mgL-1 NAA and 0.5 mgL-1 BAP and acclimatizated in the green house of Indonesian Center for Agricultural Biotechnology & Genetic Resources (BB-Biogen). After 8 weeks being acclimatizated, leaves of rodent tuber mutant and control plants were harvested and processed for 1D and 2D PAGE analyses.
B. Protein Isolation
1D and 2D PAGE utilize different methods of protein isolation. Protein samples for SDS PAGE were isolated by using 50 mM of sodium phosphate buffer and 10% insoluble polivinylpolypyrrolidone (PVPP) [20]. Protein samples for 2D PAGE were isolated by using ReadyPrep Protein Extraction Kit Total Protein and then purified by ReadyPrep 2-D clean up kit from Biorad™.
C. Protein Quantification
Proteins were quantified by Bradford method at wavelength of 595 nm. Standard of protein quantification was 2 mg/ml Bovine Serum Albumin (BSA).
D. SDS PAGE Analysis
Protein samples were separated by electrophoresis with SDS PAGE according to [21]. SDS PAGE gel was composed of 6% stacking gel and 12% resolving gel. Protein sample concentration was 20 µg/µl. Gel was immersed in staining solution and then washed with destaining solution. Protein marker used in this experiment was Broad Range (Biorad™) marker which composed of proteins with molecular weight of 6900 – 210000 Da. SDS PAGE data was obtained in the form of protein bands
E. Analysis of Protein Profile by 2D PAGE
2D PAGE analysis was done through 3 steps, i.e. rehydration of IPG Strips, protein separation in one dimension, and protein separation in two dimension. IPG strip (7 cm) with pH 3-10 (BioRad™) was rehydrated in ReadyPrep 2D Starter kit Rehydration/Sample Buffer which has been added with 150 µg/µl protein samples for 1 hours in room temperature. Protein separation in one dimension was done through the principle of isoelectric focusing. Briefly, IPG strips were rehydrated at 10℃ for 12 hours and then separated on graduated voltages (250 V for 20 minutes, 4000 V for 120 minutes, and 4000 V for 10000 seconds). IPG strips were then immersed in equilibrium buffer 1 and 2 (BioRad™). IPG strips were separated by inserting IPG strips in 12% resolving gel and closed with agarose overlay. 5 µl of marker protein
was pipetted on filter paper. Gel was electrophorized at 100 V for 120 minutes. Gel was immersed in staining solution for 15 minutes and washed with destaining solution. The resulted protein spots were then analyzed by PDQuest 2D Analysis Software(Biorad™).
III. RESULTS AND DISCUSSION
A. SDS PAGE Analysis
The availability of rodent tuber in nature is limited because rodent tuber only propagate on damp, shady areas [22]. Plant tissue culture is therefore crucial to produce many rodent tuber plants in a short amount of time [23]. In vitro culture is able to increase genetic variation by inducing somaclonal variation. Somaclonal variation is caused by mutation, changes in chromosome structure, gene amplification, gene methylation, or transposon activation during the in vitro culture of a plant [24].
Rodent tuber from Bogor has been propagated on MS media supplemented with 1 mgL-1 NAA and 0.5 mgL-1 BAP [8]. Rodent tuber was also irradiated with gamma rays to increase its genetic diversity. Gamma irradiation resulted in differences in shoot lengths and mean number of shoots between control and mutant plants [8]. Genetic variation, which is induced by mutation, could affect the plant’s morphological features [13]. Gamma irradiation caused genetic changes through induction of site mutation on a gene (single nucleotide changes) and chromosomal abberation (deletion, translocation, insertion) [25]. RAPD analysis of rodent tuber in vitro mutants has proven the genetic changes of 11 mutant plantlets from control. This genetic variation was detected at molecular weight of 250-2500 bp by 9 polymorphic primers [26].
Mutation of gene could affect the expression and function of proteins [27, 28]. Protein profile was analyzed by 1D SDS PAGE and 2D PAGE methods. The first step in proteomics analysis was protein isolation [29]. Protein extraction from plant tissue samples is commonly hard to be achieved due to the low content of protein and the presence of a large amount of polysaccharide, lipis, and phenolic compounds [30]. In this research, total protein extraction from rodent tuber leaves was done by using sodium phosphate buffer and 10% insoluble PVPP. PVPP isolates protein through phenolic precipitation. PVPP is able to inhibit protease activity and remove contaminants such as phenolic and nucleic acid so the isolated protein has a higher quantity and purity [31].
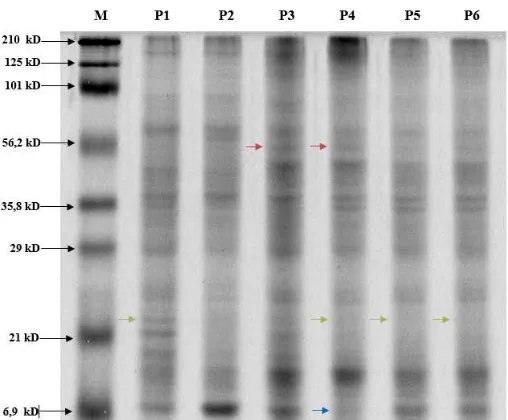
Fig. 1. SDS PAGE Protein Analysis of Rodent Tuber Control and Mutant Plants.
M (Marker Prestain 6.9-210 kD), P1 (control plants grown in green house), P2 (control in vitro plant), P3 (M6/1), P4 (M6/2), P5 (M6/3), P6 (M6/6). Samples were electrophorized with 6% stacking gel and 12% running gel at 35 mA for 120 minutes. Protein concentration of each sample was 20 20 µg/ µl. Blue arrows indicate 6.9 kD protein which was expressed by control but not in M6/2. Red arrows indicate 56,2 kD protein which was not expressed by control but expressed by M6/1. Green arrows indicate 24.3 kD protein which was expressed by control but not in M6/2, M6/3, M6/6.
SDS PAGE analysis showed the difference in potein bands pattern between control and mutant plants. Rodent tuber in vitro control plant which was cultured on MS medium showed the fewest number of protein bands, i.e. 10 bands (Table 1). Rodent tuber in vitro control, M6/1, M6/2 M6/3, dan M6/6 have the same protein bands at molecular weights of 77,5 kD, 53,6 kD, 50,70 kD, 29 kD, 24,9 kD dan 10,4 kD. Several mutant plants did not express proteins which were expressed by control plant grown in green house.
Specifically, M6/3 and M6/6 did not show any protein expression at molecular weight of 132,7 kD. M6/6 did not show protein expression at 94,4 kD. M6/2, M6/3, and M6/6 did not show protein expression at 24.3 and 11 Kd. M6/2 and M6/3 did not show any protein expression at 21 kD. M6/1 did not show any protein expression at 35,6 kD. M6/2 did not show protein expression at 6.9 kD, which was expressed by the other five samples including control plants. On the other side, several mutant plants produced proteins which were not produced by control plant grown in green house. For example, M6/1 expressed protein at 56,2 Kd; M6/2 and M6/3 expressed protein at 34.1 kD which were not expressed by control plants grown in green house. Rodent tuber in vitro control plant expressed protein at 27.2 kD, which was not expressed by the other five samples including control plant grown in greenhouse (Table 1). Cells of gamma-irradiated plant have undergone a series of DNA repair mechanism. This repair mechanism has induced changes in gene sequence, and therefore also affected protein expression [32]. Thus, gamma
irradiation is able to modify the physical and biological system properties of a plant. Gamma irradiation initiate the release of OH- and O2- which detruct cell membrane, modify plastid structure, and induce the fragmentation endoplasmic reticulum, golgi apparatus, DNA, and protein [33].
TABLE I. RF VALUE AND MOLECULAR WEIGHT OF PROTEIN OF
RODENT TUBER
M (Marker Prestain 6.9-210 kD), P1 (control plants grown in green house), P2 (control in vitro plant), P3 (M6/1), P4 (M6/2), P5 (M6/3), P6 (M6/6). Rf value was obtained by comparing the relative migration of sample and solvent (cm). Standard curve equation is y = -1.4222x + 2.2164 with x: Rf value (cm) and y: log of protein’s molecular weight (kD). indicated protein which was not expressed by rodent tuber in vitro mutant but was expressed by control plant. indicated protein which was not expressed by P1
The amount of total protein of rodent tuber in vitro mutant was also affected by gamma irradiation. Control plant grown in green house produced the same amount of protein bands with M6/1, i.e. 13 bands, which is the highest amount of protein bands compared to in vitro control, M6/2, M6/3, and M6/6 (Table 1). Gamma irradiation is able to increase the protein content of a plant cell [34]. There were also several proteins which were expressed by control plant grown in green house but not expressed by mutant plants. Gamma irradiation could inhibit the growth of plant in vitro culture [32] so there were some proteins that were not expressed by mutant plants. However, there were also several proteins which were not expressed by control but expressed by mutant plants. Gamma irradiation is able to induce or inhibit the expression of proteins [35]. Protein profile of M6/2 was different from the other mutants because M6/2 expressed protein with molecular weight of 6.9 kD which was not expressed by the other mutant plants (Fig. 1).
B. 2D PAGE Analysis
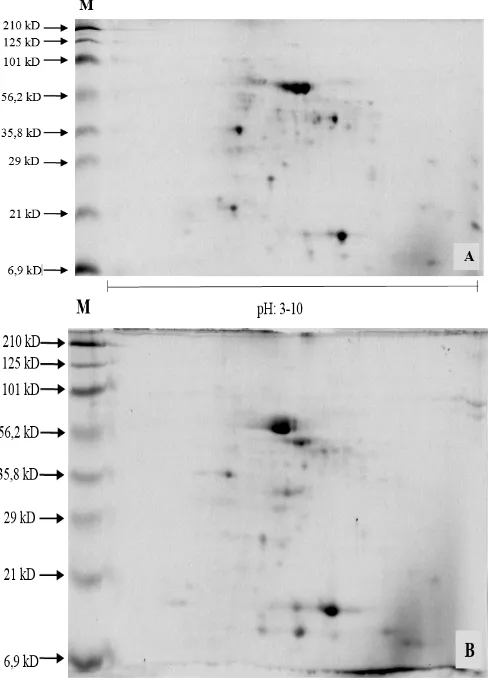
molecular weights of 6.9 kD, 21 kD, 29 kD, 35.8 kD, 56.2 kD, 101 kD, 125 kD and 210 kD. 2D PAGE showed 116 protein spots of control plant and 86 protein spots of M6/2 mutant plant which were expressed at pH 3-10 and molecular weight 6.9-210 kD. Most proteins obtained at the molecular weight range of 6.9-101 kD. PDQuest analysis has identified 24 protein spots which were expressed by both control and M6/2 plants. These protein spots have the same locations on both samples, but with different degree of expressions (Fig. 3). The presence of protein spots was indicated by SSP (Standard Spot) value. SSP is a set of specific numbers which indicates the location of proteins. The first two digits in SSP indicates the location of protein spots at X and Y coordinates. M6/2 expressed 13 proteins which were up-regulated from control and 11 proteins which were down-regulated from control (Fig. 4).
Fig. 2. 2D PAGE profile of rodent tuber protein samples.
M (Marker Prestain 6.9-210 kD), A (control plants grown in green house), B (M6/2). Protein were separated by IPGs pH 3-10.
Fig. 3. The location of 24 protein spots which were expressed by control and M6/2.
The four digits number of each protein spot indicate the location of identified protein spots.
Fig. 4. Protein expression of M6/2 compared to control.
A(SSP 6002), B(SSP 4101), C(SSP 4301), D (SSP 4602) Control (control plant grown in green house), Mutant (M6/2)
Protein profile of M6/2 was furter analyzed by 2D PAGE in order to compare it with control plant which was grown in green house. 2D PAGE gives a complete quantitative and qualitative protein data and it also indicate the modification of protein translation [36]. 2D PAGE analysis has shown the down-regulation of protein expression by mutants compared to control plant. Control plants showed the expression of 116 proteins spots, while M6/2 mutant only showed 86 spots (Fig. 2). This result was in line with 1D SDS PAGE data, which also showed the decrease in the amount of protein bands expressed by M6/2 if compared to control plant (Fig. 2). Gamma irradiation has induced mutation in rodent tuber which was followed by the up-regulation and down-regulation of protein expression. Mutant plants had 13 protein spots which were up-regulated (Fig. 4a and 4b) and 11 protein spots which was down-regulated (Fig. 4c and 4d).
fruit [38], and Aspregillus fumigatus [39]. 2D PAGE has identified 50 proteins which were expressed by mutant rice plants (Oryza sativa L. variety Zhenhui 249 Y). Among those 50 proteins, three proteins were up-regulated and two proteins were down-regulated [37]. 2D PAGE also has identified 15 protein spots of red pear fruit which were up-regulated and six proteins which were down-regulated [38]. 2D-PAGE analysis of Aspergillus fumigatus showed 700 protein spots in the pH range of 3-10 and molecular weight of 14-100 kD. Aspergillus fumigatus mutant also showed 42 protein spots which were up-regulated [39].
IV. CONCLUSION
This research has proven the differences in protein profile between rodent tuber control and mutant plants by 1D SDS PAGE and 2D PAGE analyses. SDS PAGE showed the differences in the amount of protein bands between control and mutant plants. M6/2 did not express protein with molecular weight of 6.9 kD. 2D PAGE has identified 116 protein spots of control and 86 spots of M6/2 in the pH range of 3-10 and molecular weight of 6.9-210 kD. Control and M6/2 expressed 24 protein spots at the same locations. 2D PAGE has identified 13 proteins of M6/2 which were up-regulated and 13 proteins which were down-up-regulated.
Acknowledgment
This work was funded by The Directorate General of Higher Education through competitive grant project. The authors would like to thank The Directorate General of Higher Education, Ministry of National Education, Indonesia.
References
[1] Essai, Medicinal herbs index in Indonesia. Jakarta: PT Essai Indonesia, 1985.
[2] S.F. Syahid, “Keragaman morfologi, pertumbuhan, produksi, mutu dan fitokimia keladi tikus (Typonium flagelliforme Lodd.) blume asal variasi somaklonal,” Jurnal Littri, vol. 14(3), pp. 113-118, 2008. [Diversity of morphology, growth, production, quality, and phytochemistry of rodent tuber (Typhonium flagelliforme Lodd.) blume originated from somaclonal variation]
[3] G.M. Nobakht, M.A. Kadir, and J. Stanslas, “Analysis of preliminary phytochemical screening of Typhonium flagelliforme,” African Journal of Biotechnology, vol.9, pp. 1655-1657, 2010.
[4] Y. Farida, P . S . Wahyuni, S . Wahono, a n d M . Hanafi, “ Flavonoid glycoside from the ethyl acetate extract of keladi tikus Typhonium flagelliforme Lodd. blume leaves,” Asian journal of natural & applied science, vol. 1(4), 2012.
[5] C.S. Lai, R.H. Mas, N.K. Nair, M.I. Majid, S.M. Mansor, and V. Navaratnam, “Typhonium flagelliforme inhibits cancer cell growth in vitro and induces apoptosis: An evaluation by the bioactivity guided approach,” Journal of Ethnopharmacology, vol. 118 (1), pp. 14-20, 2008. [6] S. Mohan, A.B. Abdul, S.I. Abdelwahab, A.S. Al-Zubairi, Aspollah, M. Sukari, R. Abdullah, M.M. Taha, N.K. Beng, and N.M. Isa, “Typhonium flagelliforme inhibits the proliferation of murine leukemia WEHI-3 cells in vitro and induces apoptosis in vivo”, Leukimia Research, vol. 34 (11), pp. 1483-1492, 2010.
[7] Essai, Medicinal herbs index in Indonesia. Jakarta: PT Essai Indonesia, 1986.
[8] N.F. Sianipar, Rustikawati, W. Maarisit, A. Wantho, and D.N.R. Sidabutar, “Embryonic calli induction, proliferation, and regeneration of
rodent tuber plant (Typhonium flagelliforme Lodd.) by single node culture,” International Conference on Biological Science, Faculty of Biology, Uni- versitas Gadjah Mada, pp. 80-88, 2011.
[9] N.F. Sianipar, A. Wantho, Rustikawati, and W. Maarisit, “Effects of Gamma Irradiation and Mutant Morphology of In Vitro Culture of Rodent Tuber (Typhonium flagelliforme Lodd.),” Hayati journal of biosciences, vol. 20, pp. 51-56, 2013.
[10] A. Natawijaya, A. Afiyata, and A.W. Ritonga, Pengaruh Iradiasi Sinar Gamma terhadap Keragaman Plantlet Tanaman Gloxinia. Thesis. Bogor: Bogor Agricultural University, 2009. [The effect of gamma irradiation against the diversity of Gloxinia plant plantlet]
[11] M. Wegadara, Pengaruh Iradiasi Sinar Gamma pada Buah terhadap Keragaman Tanaman Anthurium (Anthurium andreanum). Thesis. Bogor: Bogor Agricultural University, 2008. [The effect of gamma irradiation on fruit against the diversity of Anthurium plant (Anthurium andreanum)]
[12] G. Karp, “Cell and Molecular Biology – Concept and Experiment 5th Edition,” USA: John Wiley & Sons, Inc, 2008.
[13] E. Kovacs, and A. Keresztes, “Effect of gamma and UV-B/C radiation on plant cells,” Micron, vol. 33, pp. 199-210, 2002.
[14] M. Smolka, H. Zhou, and R. Aebersold, “Quantitative Protein Profiling Using Two-dimensional Gel Electrophoresis, Isotope-coded Affinity Tag Labeling, and Mass Spectrometry,” Molecular & Cellular Proteomics, vol. 1, pp. 19–29, 2002.
[15] B.P. Listyari, “Analisis diosmin dan protein tanaman seledri (Apium graveolens L.) dari daerah Cipanas dan Ciwidey. Thesis. Bogor: Bogor Agricultural University, 2006. [Analysis of diosmin and protein of celery plant (Apium graveolens L.) from Cipanas and Ciwidey regions] [16] D.A. Fatmawati, Pola Protein dan Kandungan Kurkuminoid Rimpang
Temulawak. Skripsi. Bogor: Bogor Agricultural University, 2008. [Protein pattern and Curcuminoid content of temulawak tuber]
[17] D. Saini, a n d R . Sarin, “ SDS-PAGE Analysis of Leaf Galls of Alstonia scholaris (L.) R., ” Journal Plant Pathol Microb, vol. 3 (2), 2012.
[18] D.E. Garfin, Essential Cell Biology: Cell Structure. O x f o r d : Oxford University Press, 2003.
[19] H. Issaq, and T. Veesentra, “Two-dimensional ployacrylamide gel electrophoresis (2D PAGE): advance and perspective,” Mini review. Biotechniques, vol. 44, pp. 697-700, 2008.
[20] J.R. Rout, S. Kanungo, R. Das, and S.L. Sahoo, “In vivo protein profiling and catalase activity of Plumbago zeylanica L,” Nature and science, vol. 8, pp. 87-90, 2010.
[21] U.K. Lamely, “Cleavage of structural protein during the assembly of the head bacteriophage T4,” Nature, vol.227, pp. 680-685, 1970. [22] L.K. Chan, W . Y . Koh, a n d S . T . Tengku-Muhammad,
“Comparison of cytotoxic activities between in vitro and field grown plants of Typhonium flagelliforme (Lodd.) Blume,” Journal of Plant Biology, vol. 48, pp. 25-31, 2005.
[23] G.M. Nobakht, M.A. Kadir, and J. Stanslas, “In vitro mass propagation of Typhonium flagelli- forme as affected by plant growth regulator,” African Journal of Biotechnology, vol. 8, pp. 6840-6843, 2009. [24] P.J. Larkin, and W.R. Scowcroft, “Somaclonal variation, a novel source
of variability from cell for plant improvement,” Theoretical and Applied Genetics, vol. 60, pp. 197-214, 1981.
[25] A.M. Van Harten, Mutation Breeding : Theory and Practical Applications. Cambridge : Cambridge university Press, 1998.
[26] N.F. Sianipar, A. Wantho, Rustikawati, and W. Maarisit, “Detection of Gamma-Irradiated Mu- tant of Rodent Tuber (Typhonium flagelliforme
Lodd.) In Vitro Culture by RAPD Molecular Marker”, Elsevier procedia Chemistry, vol.14, pp. 285-294, 2015.
[27] P.C. Ng, a n d S . Henikoff, “ Predicting the Effects of Amino Acid Substitutions on Protein Function,” Annual Review of Genomics and Human Genetics, vol. 7, pp. 61-80, 2006.
[29] M. Chatterjee, S. Gupta, A. Bhar, a nd S. Das, “Optimization of an Efficient Protein Extraction Protocol Compatible with Two Dimensional Electrophoresis and Mass Spectrometry from Recalcitrant Phenolic Rich Roots of Chickpea (Cicer arietinum L.),” International journal of proteomics, 2012.
[30] M. Faurobert, E. Pelpoir, and J. Chaib, Phenol extraction of proteins for proteomic studies. New Jersey: Plant Proteomic Human press, 2007. [31] M. Marsoni, C. Vannini, M. Campa, U. Cucchi, L. Espen, and M.
Bracale, “ Protein Extraction from Grape Tissue by Two Dimensional Electrophoresis,” Vitis, vol. 44 (4), pp. 181-186, 2005.
[32] A.L.P. Kiong, A.G. Lai, S. Hussein, and A.R. Harun, “Physiological Responses of Orthosi- phon stamineus Plantles to Gamma Irradiation,” American-Eurasian Journal of Sustainable Agriculture, vol. C(C), pp. 1-15, 2008.
[33] J. Sun, Y. Chen, M. Li, and Z. Ge, “Role of Antioxidant Enzymes on Ionizing Radiation Resistance,” Free Radical Biology & Medicine, vol. 24(4), pp. 586-593, 1998.
[34] A.H.M.A. Mohammed, H.I. Mohammed, L.M. Zaki, and A.M. Mogazy, “Pre-exposure to gamma rays alleviates the harmful effect of salinity on
cowpea plants,” Journal of Stress Physiology & Biochemistry, vol. 8, pp. 199-217, 2012.
[35] A.Z. Hegazi, and N. Hamideldin, “The effect of gamma irradiation on enhancement of growth and seed yield of okra [Abelmoschus esculentus
(L.) Monech] and associated molecular changes,” Journal of holticulture and forestry, vol.2(3), pp. 38-51, 2010.
[36] SC Carpentier, B . Panis, A. Vertommen, R . Swennen, K. Sergeant, J . Renaut, K. Laukens, E. Witters, B. Samyn, and B. Devreese, “Proteome analysis of non-model plants: a challenging but powerful approach,” Mass Spectrometry Reviews, vol. 27, pp. 354-377, 2007. [37] X. Chen, W. Zhang, Y . Xie, W . Lu, a n d R . Zhang, “ Comparative
proteomics of thylakoid membrane from a chlorophyll b-less rice mutant and its wild type,” Plant science,vol. 173, pp. 397-407, 2007. [38] M. Hu, Z. Qio, P. Zhou, L. Xu, and J. Zhang, ”Proteomic analysis of
‘Zaosu’ pear (Pyrus bretschneideri Rehd.) and its red skin bud mutation,” Proteome science, vol. 10, pp. 1-15, 2012.