ROAD NETWORK GENERALIZATION BASED ON FLOAT CAR TRACKING
Cheng Zhoua*, Wenjing Lib, Hongguo Jiac
aCollege of Resource and Environment, Wuhan University of Science and Technology, [email protected] bCollege of Resource and Environment, Wuhan University of Science and Technology, [email protected]
cSouthwest Jiaotong University, [email protected]
Commission IV, WG IV/1
KEY WORDS:Road network, Dynamic attributes, Mapping,Gathering, Topology
ABSTRACT:
Road generalization is not only helpful to simplify complicated road networks but can also satisfy the needs of reasonable display of roads under varying scales, thus offering basis for updating and grading urban roads. This paper proposes a selection method for road network generalization by integrating road-associated vehicle trajectory dynamic properties and road features and calculating the importance of urban roads. First of all, the location and motion information of floating vehicles are associated to relevant roads to generate the dynamic properties of roads. Then, the dynamic and static properties of roads are analyzed, and the cluster analysis is conducted to the trajectory points at road intersections to obtain the importance of some road intersections there are vehicles passing by. Afterwards, the weights of roads are calculated using the dominance rough set, the roads are ranked by weight and the practical significance of ranking results is analyzed. Finally, the selection rules for the basic framework of road network are determined to meet with different requirements and guarantee both connectivity and completeness of road networks. The results show that the relative importance of roads is made clear by taking advantage of the rough set and the generalized road network highlights the distribution and connection of urban main roads.
1. INTRODUCTION
The urban road network represents not just the urban traffic capacity but every aspect of social development as well. Along with the needs of social development, the urban roads change frequently but a slight move in one part will surely affect the whole urban road network. What’s more, as the data acquisition and application requirements become increasingly complicated and volatile, people have raised new requirements for efficient acquisition of urban traffic condition information, rapid route selection, auto-updating and multi-scale automation of road network, etc. So far, the researchers have made some achievements regarding the studies on road generalization methods and their attention is paid to the topological information (e.g., connectivity and relevance) (Li F., 2014a), metric information (e.g., length, width, density, mesh size) (Hu, 2007a), thematic information (e.g., carrying capacity and pavement condition) and directional information (e.g., orientation) of roads, etc. Meantime, some other researchers have been focused on the effects of different factors on the display of roads under varying scales, e.g., residential areas and independent commercial facilities (Zhang, 2008). The existing research findings suggest that the studies on road generalization methods are constantly improved and rationalized .
* Corresponding author
Automobile is the means of transport which is most closely related to roads. Along with the wide applications of various sensing devices and automatic access, floating vehicle based information, e.g., trajectory data, should also serve as importance evidence for road information description and knowledge discovery.
thus realizing the road network generalization based on trajectory data (Karagiorgou, 2012). This paper puts forward a road network generalization selection method by combing the spatial elements and properties and the floating vehicle trajectory information on the basis of existing researches.
2. INFLUENTIAL FACTORS FOR ROAD IMPORTANCE
The development of urban road network to surrounding areas offers more independent choices for people with different goals, and the route selection of special users has gained great attention. To reach the destination, it is necessary to carefully analyze the layout of road network and the evaluation of the importance of roads is inevitable in the whole process. There are a variety of influential factors for the importance of roads. In traditional road condition assessment, the roads are graded by length, width, stroke, mesh size, quality and so on. The gradation reveals the importance of roads to some extent. However, it is apparently incomplete to make decisions based on the properties and spatial information of roads only in selecting the road network generalization, and the needs of diversified and multilevel applications cannot be satisfied. Therefore, some other factors related to roads should be introduced to carry out comprehensive analysis and ensure the completeness, timeliness and pertinence of road information to be used in road analysis.
The road network consists of road sections and intersections connected in series. If two roads are similar in length, width and grade and an equal number of intersections and the road sections resemble in properties, the importance of these two roads can be determined by the importance of intersections. To put it another way, the importance of roads are closely related to the properties of roads as well as the number and grades of intersections. In addition, despite the fact that the road gradation based on block is conducive to the road assessment from the perspective of geographical location, the timeliness of traffic cannot be guaranteed. To compensate for the limitation, the trajectory information of vehicles that pass by the road sections can be taken as the dynamic properties of roads and used to calculate the importance of roads. Since the ownership of vehicles in urban cities is generally high at present and it is convenient to acquire trajectory data of vehicles, enormous real-time vehicle trajectory information can be obtained in the age of big data and a vast number of trajectory data (which mainly include location property and velocity property, etc.) can objectively reflect the dynamic information of vehicles when passing by the road at a certain period of time and further the importance of road in the whole road network, thus making the comprehensive selection of road network convenient.
In the urban road network, the actual utilization ratio and importance of many roads mismatch the length, width and grade setting because the location, design and construction of roads are often affected by many other factors. For example, Linjiang Avenue which runs through Wuchang District and Qingshan
District in Wuhan has a rather high grade but there are scarcely any important enterprises, institutions and business centers along the long and narrow area and Linjiang Avenue is in close proximity to Heping Avenue which is parallel to and of the same high grade as Linjiang Avenue, so the average traffic flow on Linjiang Avenue is small and the importance of Linjiang Avenue is lower than expected. However, along with the urban construction and development, the importance of Linjiang Avenue may change but the change is not manifested in spatial distribution and pattern but the traffic low and relevant trajectory information.
3. ROAD PROPERTIES BASED ON FLOATING VEHICLE TRAJECTORY DATA
3.1 Static and Dynamic Properties of Roads
To distinguish different property information affecting the importance of roads, the property information of roads are classified into dynamic and static properties. The static properties of roads mainly refer to the location, geometrical and directional characteristics of roads, which have been designed and determined prior to the utilization of roads. The dynamic properties of roads refer to the motion properties of floating vehicles driving on roads (which mainly include the location and velocity of vehicles, etc.), which can be acquired from vehicle trajectory data, and the dynamic properties of roads can indicate the features and degree of importance of roads indirectly.
In the analysis of existing road network data, the static properties of roads can be obtained, including length, connectivity, network density, etc. The connectivity is the number of intersections and can indirectly characterize the importance of roads. The larger the number of intersections is, the more connected roads there are and the higher the connectivity is in the road network. The network density reflects the radiating area of roads and is expressed as the perimeter-to-area ratio of radiating area. The larger the network density of roads is, the more influential the roads are to the relevant area and the higher the importance of roads is.
ID L(m) C R(m/m2) T V(km/h) D W
Table 1. Road properties and importance
Where ID is the index of road, L is length, C is connectivity, R is network density, T is traffic flow, V is average velocity, D is degree of intensity, W is the importance of the road.
In Table 1, the length represents the length of road; the connectivity denotes the degree of connection between the road and other roads and depends on the number of intersections; the network density stands for the length of road per unit area; the traffic flow is the sum of vehicles on the road within a certain period of time; the average velocity refers to the average velocity of all vehicles driving along the road within a certain period of time; the degree of intensity is expressed as the sum of vehicles that gather around the intersections within a certain period of time.
In this paper, the quantitative calculation of importance of roads is conducted based on the road property data in Table 1. The proposed method gives consideration to the properties of both roads and associated intersections and integrates the vehicle trajectory data near intersections to analyze the calculate the importance and grade of roads in the road network in a comprehensive and quantitative manner.
3.2 Road Importance and Intensity of Intersections
As is often the case, the floating vehicles stop without killing the engines at red lights at intersections. Therefore, the information of vehicles which stop around intersections can be screened from floating vehicle data. In a certain period of time, the more vehicles there are waiting for the red and green traffic lamps at intersection, the higher the importance of intersection is. This indirectly suggests the importance of road to which the intersection belong.
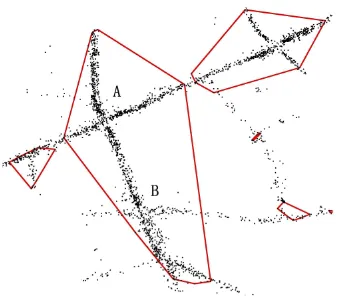
Figure 1. The DBSCAN of trajectory points at intersections
The discontinuity of floating vehicle trajectory data leads to the discrete distribution of trajectory points in road network and it is impossible to directly and precisely judge which intersection nearby the trajectory points belong to on the basis of the location of trajectory points only. In particular, when two
intersections nearby are close, it is impossible to directly judge which intersection a certain trajectory point belongs to and thus it is difficult to directly determine the intensity degree of vehicles around the intersection. For this reason, Density-Based Spatial Clustering of Applications with Noise (DBSCAN) is adopted to cluster the floating vehicles around intersections and match the clustering results with intersections nearby to determine the importance of intersections in this paper. Some of DBSCAN results are shown in Fig.1.
After the density clustering analysis of vehicle trajectory data, the trajectory points of the same cluster may cover one or several intersections. It can be seen in Figure 1 that the maximal cluster contains two intersections, i.e., A and B, so there is a need to further analyze the importance of A and B in the cluster. On one hand, several intersections covered in the same cluster may be located on different roads. On the other hand, the driving mode of floating vehicles is the product of combined effects of all the vehicles that drive on the interconnected roads. Therefore, what is reflected from the trajectory points of one cluster is the traffic condition in one area, or the importance of all intersections in the area. In this case, the clustering result of trajectory data of floating vehicles characterize the dynamic properties of all roads in the area. On the contrary, there will be no clustering of floating vehicles at intersections because the vehicles appear rarely on the roads and the density degree of vehicles is low, and furthermore the importance of roads is low within a certain period of time due to the role of the whole road network.
4. CALCULATION AND SELECTION OF ROAD IMPORTANCE
The road properties comprise spatial features as well as various thematic information, so it is not scientific or complete to measure the importance of roads based on a certain kind of property information. The calculation of importance of roads based on static and dynamic properties of roads can fully reflect the importance of roads in reality. What’s more, in the age of big data, the geographical data don’t purely reflect geographical features but are merged with the motion pattern of mankind. Either dynamic properties of roads or static ones are just the objective reflection of the importance of roads, while the motion pattern of mankind has relatively significant effects on the importance of roads (Liu Yu., 2014a, Tang, 2015a). In this paper, the motion pattern of mankind refers to the preference of road in driving.
4.1 Road Network Stratification Preprocess
According to the driving experience in the motion pattern of mankind, the drivers of floating vehicles give preference to the roads of higher grades when driving, that is to say, the roads of higher grades have more apparent dynamic properties while the roads of lower grades exhibit smaller or even zero dynamic properties. For example, two roads in Table 2, namely 2049 and 2054, have almost the same static properties but differ greatly in dynamic properties. The preference is mainly manifested in the degree of activity of roads, and the difference of dynamic properties of roads is exactly the difference of preference.
ID L
2053 2760.97 4 0.59 29 12.69 0 4.22
2054 895.48 5 1.00 122 6.59 0 4.42
2055 371.82 2 1.08 0 0.00 0 2.39
2056 1457.14 6 0.27 41 15.85 0 4.30
2057 465.67 3 0.55 93 21.19 175 4.32
2058 257.90 1 0.73 2 12.00 59 2.96
…
Table 2. Road properties and importance from 10 to 11 a.m.
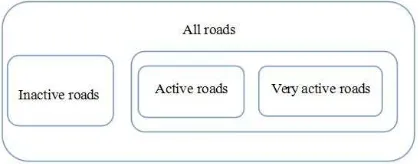
In line with the distribution of dynamic properties of roads, the roads can be stratified into inactive roads (there are no trajectories of floating vehicles along the roads in statistics), active roads (there are trajectory points along the roads but no clusters of trajectory points at intersections) and very active roads (there are abundant trajectory points along the roads as well as clusters of trajectory points at intersections). The inactive roads, active roads and very active roads belong to
0,1,2) (j
j levels, and the active factors of different levels are
j j
α
2 defined as according to the law of motion patternindex of mankind (Kang, 2012a, Liang, 2013a). The schematic diagram of road stratification is shown in Fig. 2.
Figure 2. The schematic diagram of road stratification
4.2 Calculation of Road Importance
In this paper, the dynamic properties of roads mainly come from the analysis of trajectory data of vehicles. According to the widespread driving habits, the drivers tend to choose the roads
of higher grades because the roads of high grades are usually featured by high accessibility. That is to say, the dynamic properties of roads of high grades correspond to the relatively great importance. For instance, two roads in Table 2, namely 2055 and 2057, have similar static properties, but it is impossible to distinguish the importance of two roads based on the static properties only because the dynamic properties of the two roads differ greatly, which suggests that the roads play different roles in the whole road network within a certain period of time.
The real-time dynamic data of roads should be taken into account in planning routes and offering decision-making support. After the stratification of roads as described in Section 3.1, the property data of roads should be subject to discretization. In the course of discretization of road property data, different properties have different practical meanings, measurement methods and units. For example, the length of road determines the grade of grade to some extent and can be continuously discretized, but the connectivity of road can be only used to judge the grade of road initially, that is, the road with one intersection may be by-pass but the road with two intersections or above may be arterial road. The different property data have different discretization methods, too. It can be seen in Eq. (1) that the discrete values of different properties
ki
c (which denotes the i-th property of the k-road) are variable. For example, there are speed limits for vehicles and the driving speed shall not exceed 15km/h to make a turn and 30km/h on ordinary roads and shall be at least 60km/h on highways, so the speed property can be discretized in light of speed limits. The discretization of other properties should be conducted on the basis of their respective features or in line with the numerical distribution law if their respective features are unclear.
The weights of different properties in total property are determined by calculating the similarity ratios of the results before and after the omission of one property using the dominance rough set. For example, the degree of similarity between the results when the length is considered and unconsidered should be the weight of length. The dominance rough set is used to calculated the weights
i of sixproperties of roads above , and the activity factor of three levels is
α
j, so the importance of thek-th road should be:wheremstands for the number of properties,kdenotes the serial number of road (namelykis the ID),iis the serial number of property andjrepresents the activity level of road.
4.3 Road Ranking and Selection Rules
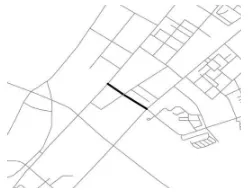
calculated as described above and then the roads can be ranked by importance and the road network is reconstructed according to certain professional needs. Nevertheless, the reasonable road network is not only related the importance of roads but restrained by many other factors (e.g., the connectivity of roads). As is shown in Fig.3, the disconnectivity of road network may occur and the completeness of road network in the circle is destroyed when the roads are selected by importance only and the roads of little importance are deleted. Therefore, apart from the importance of roads, certain road deletion and addition rules should be established to guarantee the completeness and connectivity of road network.
Figure 3. The roads selected by importance
There are a lot of applications for the selection and reconstruction of roads and the most typical one is the selection of roads under varying scales. In this paper, the road network generalization method is as follows. Firstly, the number of roads for road network generalization under certain spatial scale is obtained with the square root model, and the roads are selected from the road network after the ranking of roads and taken as the basic framework. Secondly, based on the distribution of special road segments in the original road network, the specific roads are chosen from the original road network and added to the basic framework, e.g., bridge, tunnel, overpass and other connecting structures. Thirdly, the unimportant roads at the dense parts of road network should be deleted in order of priority based on the road network density under the spatial scale. Finally, the topological structure of road network is examined to make sure the whole road network has good connectivity and completeness.
5. EXPERIMENT
To validate the rationality of road network generalization and selection method above, the data of roads within the third ring road of Wuhan are used for experiments. The experimental region covers 2,551 roads, 4,512 intersections and in particular 12 overpasses, and the original scale of the map is 1:200,000. In this paper, the overpasses belong to roads but are denoted as rings and won’t be calculated as roads separately.
ID L
(m) C (Rm/ m2)
T V
(km/h) D W
2049 689.42 4 0.83 0 0.00 0 2.73
2050 1720.09 6 0.68 0 0.00 0 3.48
2051 1601.40 3 0.85 0 0.00 0 3.02
2052 1631.82 3 0.88 0 0.00 0 3.02
2053 2760.97 4 0.59 10 13.60 0 3.92
2054 895.48 5 1.00 113 3.31 0 4.41
2055 371.82 2 1.08 2 15.50 0 3.28
2056 1457.14 6 0.27 60 4.33 65 4.85
2057 465.67 3 0.55 90 17.10 146 4.90
2058 257.90 1 0.73 1 14.00 0 2.58
…
Table 3. Road properties and importance from 16 to 17 p.m.
The corresponding trajectory points amount of floating vehicles is 170,725 from 10:00 to 11:00 a.m. and 177,303 from 16:00 to 17:00 p.m. on May 15, 2015. Afterwards, the table of road properties is prepared by combining the floating vehicle trajectory data above and the static properties of roads. As a result, the importance of roads as comprehensive properties can be obtained, as is shown in Table 2 and Table 3.
It can be inferred from Table 2 and Table 3 that the importance of roads is not determined by a certain property of roads and varies in different periods of time. For example, the traffic flows on the ten roads in both tables are completely different and the degrees of importance of intersections on the same road vary from one to another at 10:00 and 16:00, which suggests that the proposed method gives consideration to the spatial and thematic features of roads as well as real-time traffic conditions and thus is a more scientific and efficient road evaluation method featuring self-adaptive function.
Figure 4. The location of road (ID: 2057) in road network
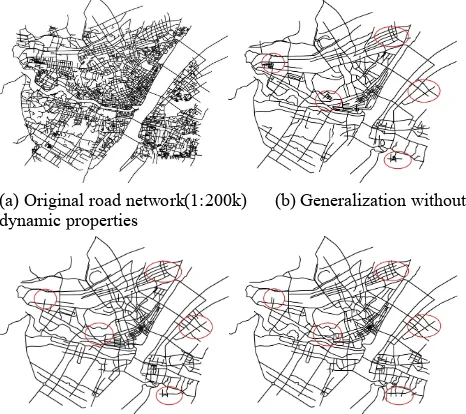
The experimental results above indicate that the result of road importance calculated automatically using post-stratification weights is consistent with the practical situation. A comparison between the experimental data of roads selected with the generalization method and the existing road data is presented in Fig.5, with a scale of 1:200,000,which is compressed to 1:2000,000. Fig.5(b) shows the result of road network generalization without considering the dynamic properties of roads, Fig.5(c) and Fig.5(d) show the results at 10:00 and 16:00 after road network generalization. It is obvious that the main roads in the road network reconstructed with the proposed method and the actual map are the same, especially the arterial roads of higher grades. Thus, a conclusion can be drawn that the road ranking and selection rules have effectively guaranteed the basic framework of main roads in the whole road network as well as the completeness and connectivity of roads.
(a) Original road network(1:200k) (b) Generalization without dynamic properties
(c) Generalization(10 to 11 a.m.) (d) Generalization(16 to 17 p.m.)
Figure 5. A comparison of road networks before and after generalization (scale 1:2000k)
As is shown in Fig.5, the framework of main roads in some regions of Wuhan can be extracted from the generalization result without considering the dynamic properties of roads and the generalization results with data at 10:00 and 16:00, but there are slight differences at some parts, which are indicated in the red ellipse in Fig.5. It can be seen that the roads in Fig.5(a) are redundant and not concise enough but the road networks in Fig.5(c) and Fig.5(d) have explicit structure and can reflect the real-time traffic conditions in different regions and provide references in decision-making of driving directions. It is noteworthy that the importance of roads is calculated based on the dynamic properties at 10:00 and 16:00 and the generalization results reflect the varying importance of urban roads at different time in Fig.5(c) and Fig.5(d). Instead, the generalization result from the road importance calculation without considering the dynamic properties of roads can only embody the ranking of roads rather than the varying importance
of roads at different time, especially the changes of road importance during rush hours, as can be seen from Fig.5(b).
Fig.6 presents the road network generalization result with the scale of 1:1000,000, and the arterial roads in the road network in Fig.6 are almost the same as those in the road network with the plotting scale of 1:2000,000 in Fig.5(c), but the former has some secondary main roads than the latter, which suggests that it is reasonable to adopt the stratification of roads and the dominance rough set in calculating the importance of roads and the road generalization method is effective.
Figure. 6 Generalization with data from 10 to 11 a.m. (1:1000k)
6. CONCLUSION
This paper presents a quantitative study on the importance of roads in urban road network and introduces the floating vehicle trajectory data as the dynamic properties of roads in addition to the static properties of roads in conventional approaches. At first, the roads are stratified according to the degree of activity. Then, the dominance rough set is used to calculate the weights of different properties in a certain period of time, and the importance of each road is calculated and the roads are ranked by importance. Finally, the reasonable road selection rules are designed to meet with the application requirements and guarantee the completeness and connectivity of road network. Compared with existing road generalization methods, the proposed method gives consideration to non-spatial properties of roads and lays emphasis on the timeliness of traffic data, and its rationality and validity have been verified by a comparison of the calculation results and the actual road data. The proposed method represents the new trend of self-adaptive data mining function.
ACKNOWLEDGEMENTS
This work has been funded by National Science Foundation of China (No.41271449).
REFERENCES
Hu Y., Chen J., Li Z., et al, 2007a. Selective omission of road features based on mesh density for digital map generalization.
Acta Geodaetica Cartographica Sinica, 36(3), pp. 351-357.
A:Statistical Mechanics and Its Applications, 391(4), pp. 1702-1717.
Karagiorgou S., Pfoser D., 2012. On vehicle tracking data-based road network generation.International Conference on Advances in Geographic Information Systems, pp. 89-98.
Li F., Luan X., Yang B., et al, 2014a. Automatic topology maintenance approach for high-level road networks.Geomatics
and Information Science of Wuhan University, 39(6), pp.
729-733.
Li W., Qiu J., Lv L., 2011a. An improvement selection method of GIS information generalization based on rough set.
Geomatics and Information Science of Wuhan University, 36(5), pp. 588-591.
Liang X., Zhao J., Dong L., et al., 2013a. Unraveling the origin of exponential law in intra-urban human mobility. Scientific Reports, 3(10), pp. 65-65.
Liu G., Li Y., Yang J., et al., 2014a. Auto-selection method of road networks based on evaluation of node importance for dual graph. Acta Geodaetica Cartographica Sinica, 43(1), pp. 97-101.
Liu Y., Kang C., Wang F., 2014a. Towards big data-driven human mobility patterns and models. Geomatics and Information Science of Wuhan University, 39(6), pp. 660-665.
Qiu J., Li W., 2010. River network dynamic selection with spacial data and attribute data based on rough set.International Conference on Geoinformatics, pp. 1-5.
Tang L., Li Z., Yang X., et al., 2015a. A method of spatio-temporal trajectory fusion and road network generation based on cognitive law.Acta Geodaetica Cartographica Sinica, 44(11), pp. 1271-1276.
Yang M., Ai T., Zhou Q., 2013a. A method of road network generalization considering stroke properties of road object.Acta Geodaetica Cartographica Sinica, 42(4), pp. 581-587.