Modelling and measurement of radiation interception
by olive canopies
M.J. Mariscal
a,∗, F. Orgaz
a, F.J. Villalobos
a,baInstituto de Agricultura Sostenible, Consejo Superior de Investigaciones Cient´ıf´ıcas, Apdo 4084, 14080 Córdoba, Spain bDepartamento de Agronom´ıa, Universidad de Córdoba, Spain
Received 2 February 1999; received in revised form 18 August 1999; accepted 20 September 1999
Abstract
We present the formulation, calibration and validation of a model to estimate photosynthetically active radiation (PAR) intercepted by olive (Olea europaea L.) canopies. The model calculates the PAR transmittance at any point located within the four central trees of the orchard. The spatial and time integration of this process allows calculation of PAR transmitted to the ground and, thus, the PAR intercepted at any given time. Direct-beam radiation, diffuse radiation and scattering are separately taken into account.
Model parameters are the G-function, leaf reflectance and transmittance. Leaf inclination distributions, measured in the field, were used to derive the G-function. A planophile distribution was found. Leaf reflectances measured in three olive cultivars were, on average, 0.06 for adaxial and 0.12 for abaxial surfaces, while leaf transmittance was below 0.01. The model was barely sensitive to the parameters.
Predictions of diffuse and total transmittance were tested on clear and overcast days in winter, fall and summer at Córdoba, Spain, in seven olive orchards of quite different characteristics. The validation showed that when estimating average canopy values, local errors compensate and the predictions of intercepted PAR seem correct for all canopy types, sun position and heights within the stand. The procedure seems applicable to any olive tree variety and does not present important systematic errors. ©2000 Elsevier Science B.V. All rights reserved.
Keywords: PAR interception; Radiative transfer; Olea europaea L.; Crop modelling
1. Introduction
Among the various environmental factors determin-ing plant growth, photosynthetically active radiation (PAR) intercepted by a crop canopy is the main factor that determines dry matter production, being the main
∗Corresponding author. Present address: Pomology
Depart-ment, University of California, One Shields Avenue, Wickson Hall #0680, Davis, CA-95616, USA. Tel.: 1-530-752-1843; fax: 1-530-752-8502.
E-mail addresses: [email protected] (M.J. Mariscal), [email protected] (F. Orgaz).
source of energy for the process of photosynthesis. Therefore, the supply of radiation sets a limit to po-tential production. This amount is determined by the incident radiation conditions as well as by the optical and architectural properties of the stand (Ross, 1981). Canopy photosynthesis, and thus biomass produc-tion, in a given radiation environment results from the coupling between the photosynthetic response of leaves and the distribution of radiation on these elements. Within a heterogeneous stand, the atten-uation of radiation resulting from absorption and scattering by leaves creates a vertical gradient of mean irradiance. Further, horizontal variation of the
transmitted radiation results from the highly direc-tional distribution of incoming direct solar radiation creating sunflecks and shaded areas (Baldocchi et al., 1986; Nilson, 1992). An olive orchard is a heteroge-neous stand, since the leaves are located within an envelope that is distributed in the space according to planting pattern and row orientation. For these types of canopy, interactions between stand structure and radiation are complicated to deal with in field trials.
Models of radiative transfer in vegetation aim at de-riving both, the amount and distribution of PAR in-tercepted by a crop. Since the work of Monsi and Saeki (1953), more than50 models of radiation atten-uation in homogeneous canopies have been proposed and have been reviewed by Myneni et al. (1989). Going from horizontally homogeneous canopies to row crops, orchards or forest canopies, those models are no longer suitable because leaf area is not ran-domly distributed. Nonetheless, for hedgerow planta-tions two-dimensional theories have been formulated (e.g. Charles-Edwards and Thorpe, 1976; Cohen and Fuchs, 1987; Ganis, 1997). In plantations composed of isolated trees, a three-dimensional characterization of the grove is needed. Tree crown has been described using ellipsoids (Norman and Welles, 1983), cones for conifers (Kuuluvainen and Pukkala, 1987) and cylin-ders/paraboloids/cones for fruit-trees (Wagenmakers, 1991), or also using fractal geometry (Myneni, 1991). Other factors, such as variation in leaf inclination (Wang and Baldocchi, 1989), in leaf area density (LAD, Wang and Jarvis, 1990) or penumbral effects (Wang and Baldocchi, 1989) have been included on a few occasions. Regarding the scattering due to leaf reflectance and transmittance, when taken into ac-count, the approximations of Goudriaan (1977) and Norman and Jarvis (1975) have often been used.
Olive groves are the main component of numerous agricultural systems in the Mediterranean region, in-cluding traditional extensive groves and new intensive orchards. Extensive cropping systems intercept around 20–30% of the seasonal solar radiation. New intensive olive orchards with fully developed canopies intercept at most 70% of the solar radiation, but it takes many years to reach this level. This slowness in obtaining a structure, that produces assimilates together with the low interception in extensive systems, presents an opportunity to improve productivity (Jackson, 1980). Moreover, the radiation interception by olive trees has
not received much attention, partly because of the complexity in describing the three-dimensional radia-tion regime in these stands.
The simulation of olive growth involves intercep-tion of radiaintercep-tion, dry matter (DM) producintercep-tion and DM distribution. Regarding these last points, Mariscal et al. (1998) have reported radiation use efficiency and dry matter partitioning for olive trees.
The objective of this work was to formulate, cal-ibrate and validate a model of PAR interception by olive canopies. The procedure is based on the three-dimensional approach adopted by Norman and Welles (1983), takes into account characteristics of olive cropping systems, and considers scattering, diffuse and direct PAR radiation.
2. Material and methods
2.1. Model description
Calculations to determine PAR transmittance are made for an area delineated by the four central trees of the olive orchard. The lowest layer (e.g. ground level) is selected by the user and is divided into a grid. For each grid point, we calculate direct-beam and dif-fuse transmittance, as well as downward and upward scattering. Diffuse and direct flux density are calcu-lated in PAR and NIR wave band according to Spit-ters et al. (1986) as a function of the solar zenith and the daily incident radiation. The circumsolar part of the diffuse radiation is added to the direct beam. The radiation absorbed (W m−2) is obtained as the differ-ence between incoming and outgoing radiation for the area limited by the atmosphere and the layer. (In the strict sense, absorption and interception differ in that absorption accounts for scattering. Normally in the lit-erature, and also in this work, both these terms are not distinguished.) The process is repeated for every hour of the day and then summed to give daily radiation absorbed by the orchard. The absorbed seasonal radi-ation (J m−2) is obtained by the time-integration from the start to the end of the process previously described. The time-step is 1 h.
2.1.1. Olive-stand architecture
NSWE-vertical. An olive tree is positioned at each row–column intersection. The olive orchard size is di-mensioned so that all trees potentially contribute to interception of radiation. Tree shape can be consid-ered an ellipsoid, a set of concentric subellipsoids or horizontally truncated ellipsoids. Each one of them is defined by three perpendicular radii (in row, column and vertical directions), by centre height and LAD. All trees are equal, containing only leaves which are randomly dispersed in each tree crown.
2.1.2. Transmittance
The transmittance (T) of radiation for any beam to any point in the array is calculated as (Norman and Welles, 1983):
t =exp(−g a s) (1)
where t is the beam transmittance, g the G-function, a the leaf area density (m2m−3), and s the path length of a beam in the canopy (m).
The path length s was estimated as the sum of in-dividual path lengths through the trees. Each of them are calculated as the distance between the two geo-metric intersections of a straight line (the solar beam) and an ellipsoid, in an NSEW and vertical coordinate system. The direction of the solar beam is calculated as a function of latitude, date and solar time. When subellipsoids are considered to be numbered from the internal towards the external, we can write Eq. (1) as:
t =exp −g
lipsoid I, si the path length in the subellipsoid i (m),
si−1the path length in the subellipsoid i−1 (m), and n the number of subellipsoids.
2.1.2.1. Diffuse transmittance (tdif). The diffuse transmittance is obtained by integrating Eq. (1) for all zenith and azimuth angles, assuming that the diffuse solar radiation is isotropically distributed.
2.1.2.2. Scattering. Norman and Jarvis (1975) the-ory for horizontal canopies is applied to the olive orchard following the assumption and procedure pro-posed by Norman and Welles (1983).
2.1.3. Inputs, parameters and outputs
2.1.3.1. Inputs. Planting pattern, row and column angles, soil PAR reflectance, latitude and daily global radiation. Regarding tree shape, the following inputs are required: number of subellipsoids in which each tree is to be divided; height of their centres; three per-pendicular radii of each subellipsoid (in row, column and vertical directions); and LAD of each subellipsoid. When horizontally truncated ellipsoids are assumed, the fraction of the vertical radius, where it is chopped, is also an input to the model.
2.1.3.2. Parameters. Leaf reflectance and transmit-tance, and G-function.
2.1.3.3. Outputs. Estimations of all the components of the radiation balance for hourly, daily and seasonal periods.
The Norman–Welles theory (Norman and Welles, 1983) was adopted as it is based on reasonable premises for an olive orchard. The olive grove is considered as a set of envelopes in such a way that the spatial scale associated with the envelopes is of the same order as the separation between them. Due to the infinite combinations of shapes it can take, the geometric form of a truncated ellipsoid was chosen. It was assumed that the leaves are randomly distributed within the envelopes. Monteith (1969) stated that this premise can be assumed if the area of a leaf is much smaller than the soil area occupied by the plant. This assumption seems valid for our case as olive leaves are small (300–1000 mm2) when compared to the area covered by one tree (typically 10–30 m2). It was considered that all the plant area was composed of leaves. Villalobos et al. (1995) indicated that >90% of the area of an olive tree corresponds to leaves, which supports our assumption.
(Wang and Jarvis, 1990). However, in the MAESTRO model which does not include truncated ellipsoids, it is necessary to specify the coordinates of all the trees that form the orchard while ours only requires the planting pattern and the row direction. The MAESTRO model is much more complex than ours, and is usually in-tended for calculating total PAR interception. On the other hand MAESTRO includes submodels of photo-synthesis and respiration of the canopy and requires hourly radiation data. On the contrary the use of daily values in our model allows more general use.
Our model is also similar to the three-dimensional model for pear and apple trees introduced by Wagen-makers (1991), based on the work of Van Kraalingen et al. (1989). Their model basically differs from ours in the geometrical figure choice and in the radiation interception impact of branches and fruits.
2.2. Model parameterization
2.2.1. G-function
The G-function was calculated according to Lemeur (1973) assuming variable elevation angles with the help of appropriate probability functions fdd(α) and their accumulated distribution function Fdd(α). Ran-dom leaf azimuth was assumed. The range 0–90◦was split into nine 10◦intervals. The fdd(α) was obtained in each interval as the relative frequency of leaves with angleain that interval.
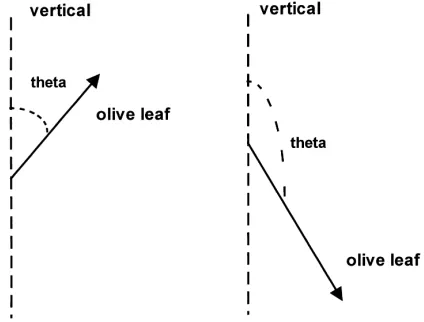
The leaf inclination density function was deter-mined for two different situations: for all the leaves of a three-year-old tree and for 3% of the leaves of an adult tree. The number of measured leaves was 3392 and 4127, respectively. The leaf inclination (angle be-tween the vertical and the normal vector to the upper leaf surface) was calculated from the angle between the central mid-rib of the leaf and the vertical (θ, Fig. 1). This angle was measured in the field with a graduated semicircle from which a weight was hung to indicate the vertical.
2.2.2. Optical coefficients
Leaf reflectance and transmittance were measured with a spectrophotometer (NIRSYSTEM 6500, Per-storp, Silverspring, MD) for both, abaxial and adaxial surfaces and for young (under one-year-old) and old (over one-year-old) leaves. In each case, four leaves of ‘Picual’, ‘Arbequina’ and ‘Hojiblanca’ cultivars were
Fig. 1. Scheme of the olive leaf angle measurement. measured. The samples were collected in April 1996, 10 min prior to measuring the coefficients. Each sam-ple was placed in a sterile container and was carried in a icebox to the spectrophotometer. The sweep in-terval of the spectrophotometer was 2 nm, starting at 400 nm and finishing at 700 nm. The mean value of the coefficient for the PAR region was calculated as suggested by Monteith (1973).
2.3. Model validation
Several outputs were validated at different time and space scales (Table 1). Observed (oi) and simulated
(pi) values were compared by regression analysis.
Table 1
Scheme of the different radiation balance components measured at several time and space scales
Balance component Time scale
instant daily
space scale
point cell canopy point cell canopy
Scattering Ea E′b
Diffuse D0 D1c
Total Y0 X0 X1d, Ae Y2f, X2g aDownward scattering.
bUpward scattering. cSpatial integration of D0. dSpace integration of X0. eProfiles of PAR attenuation. fTime and space integration of Y0. gTime integration of X1.
where pei are the estimates using the regression line.
The measurements (oi) were made through 1994, 1995
and 1996 in olive orchards located in the Agricultural Research Centre of Córdoba (37.8◦N, 4.8◦W, 103 m altitude). Seven canopies consisting of four trees were selected. These stands were chosen in order to en-compass the entire range of ground covers found in commercial olive orchards (Table 2). In each canopy, a grid composed of 1×1 m cell, was marked at soil level. There were at least two rows with similar trees surrounding the selected canopies.
2.3.1. Input determination
The ellipsoid radii were obtained as the average of the radii of the four trees, measured using a scaled pole. LAD was estimated using a PCA (Plant Canopy
Table 2
Characteristics of the olive (Olea europaea L. cv. ‘Picual’) canopies used in the model validation
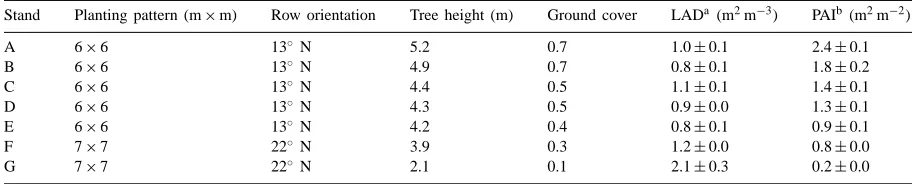
Stand Planting pattern (m×m) Row orientation Tree height (m) Ground cover LADa(m2m−3) PAIb (m2m−2)
A 6×6 13◦ N 5.2 0.7 1.0±0.1 2.4±0.1
B 6×6 13◦ N 4.9 0.7 0.8±0.1 1.8±0.2
C 6×6 13◦ N 4.4 0.5 1.1±0.1 1.4±0.1
D 6×6 13◦ N 4.3 0.5 0.9±0.0 1.3±0.1
E 6×6 13◦ N 4.2 0.4 0.8±0.1 0.9±0.1
F 7×7 22◦ N 3.9 0.3 1.2±0.0 0.8±0.0
G 7×7 22◦ N 2.1 0.1 2.1±0.3 0.2±0.0
aLeaf area density. bPlant area index.
Analyzer, LAI-200, LI-COR, Lincoln, NE) in four quadrants of each tree (Villalobos et al., 1995). In each quadrant, the tree silhouette was estimated by measur-ing the upper and lower limits of the canopy with a vertical scaled pole which was systematically moved away from the tree centre outwards in 0.2 m incre-ments.
2.3.2. Diffuse transmittance
Diffuse transmittance was measured with a PCA in each grid point for the seven canopies. The records were taken in summer, autumn and December of 1994 and March of 1995. The value of the diffuse transmit-tance of the canopy was taken as the average value of each data set.
2.3.3. PAR transmittance
Daily canopy PAR transmittance (td) was measured for the canopies A, C and G (Table 2). The daily mea-surement was obtained from seven hourly measure-ments, the fourth coincidental with the solar noon. A ceptometer (Decagon, Delta-T Devices, Pullman, WA) was used to measure the incident radiation above
(RRRpio)and below(RRRpi)the orchard. Each hourly mea-surement was obtained as the average of records for all 1×1 m2grid cells. The sensor was displaced par-allel to the ground surface, moving directly from side to side in each grid cell. These measurements were taken in May 1996 during completely cloudless days. The td value was obtained by numerical integration according to the rectangular rule of incident (RRRpio) and transmitted(RRRpi)radiation:
td= R
RRRpidt R
RRRpiodt
A second data set of total PAR transmittance was measured on clear days using the ceptometer with 100 mm of active length, for the same points, canopies and periods as diffuse transmittance measurements (see Section 2.3.2). These measurements were taken at three different times from dawn to solar noon, at intervals of 2 h. The hourly canopy transmittance was obtained as the average value of each canopy data set. The value of Tdwas calculated from these values. At the beginning of each measurement, the time and the incident solar radiation were noted. Once the grid points were measured, the time and the incident radi-ation were similarly noted. The transmittance for each below-canopy point was obtained as the ratio of inci-dent radiation at the point and the inciinci-dent radiation at the above-canopy point, extrapolated according to time.
2.3.3.1. Transmittance profiles within the canopies. Transmitted PAR radiation was measured with a point quantum sensor (LI-189 LI-COR, Lincoln, NE) above each grid point for 0.5-, 1-, 1.5- and 2-m heights. This highest measurement was not made in the canopy G, as it exceeded the tree height. This process was re-peated for zenith angles of 70, 50, 30 and 15◦. These measurements were carried out throughout June 1996 under clear sky conditions in the canopies A, C and G.
2.3.4. Scattering
2.3.4.1. Downward scattering. For a sunny point in the olive orchard, the PAR transmittance (tt) is:
tt =fbtb+(1−fb)tdif+e (7)
and e can be derived as (tb=1):
e=tt−(fb+(1−fb)tdif) (8)
where fbis the fraction of direct-beam radiation in the incident PAR, tb the direct-beam transmittance, tdif the diffuse transmittance, and e the downward com-plementary radiation (fraction of incident PAR).
Measurement of PAR and diffuse transmittance (tt
and tdif): Sunny 1×1 m2 areas were located at the
soil level under the canopies A, C and G. The areas were delineated as a 100×100 mm2 grid. PAR and diffuse transmittance were determined on the mean points of these 100 subareas. In the canopy A, due
to the high ground cover, the sunny area was only 500×600 mm2. The PAR transmittance was mea-sured with a ceptometer (Decagon, Delta-T Devices, Pullman, WA). The PAR transmittance measurements were made on 26/06/96, at 8.50 GMT in canopy G; at 9.40 GMT in canopy C; and at 10.30 GMT in canopy A. The measurements were made for a period of 6 min, and the average value of this data set was used. Under diffuse conditions, the PCA was employed to determine tdif. These measurements were repeated while pointing the sensor towards the two directions normal to the row lines.
Beam fraction (fb): Beam fraction was determined
according to Rosenberg et al. (1983) for the same zenith angles that tt was measured.
fb=
RRp was measured with a point sensor (LI-189 LI-COR Lincoln, NE) under cloudless conditions.
R
RRpd was determined by inserting a small circle be-tween the sun and the sensor. This black circle of 300 mm radius was located at the top of a 5.9-m high aluminium mast. The process was repeated three times throughout 25/06/96. It was necessary to cor-rect the radiation value due to the quantity of diffuse radiation intercepted by the mast. This correction was determined as follows: Under diffuse radiation condi-tions, incident PAR (RRR0) was measured by placing the mast at the same three positions used under cloudless conditions to measure the incident radiation (BBB).RRRpd was thus multiplied byRRR0/BBB.
2.3.4.2. Radiation reflected to the atmosphere by the crown and the rows between olive trees. Incident and reflected radiation were simultaneously measured with two leveled point sensors connected to a datalog-ger (CR 21 X, Campbell, Logan, UT). A pyranometer (PY-4699 LI-COR, Lincoln, NE) for incident solar radiation and a quantum sensor (LI-189 LI-COR, Lincoln, NE) inverted 300 mm above the orchard for reflected PAR were used. Because of the different wavelength coverage, both sensors were previously calibrated against each other.
(Table 2). The measurements were taken under cloud-less conditions from 20/07/96 to 31/07/96. The soil was dry and bare. A total of 10 daily curves were gen-erated. However, an average curve including the data of the four trees in each canopy was made and is pre-sented as the radiation reflected to the atmosphere by the crown.
A daily reflectance curve was determined at inter-vals of 10 min, from sunrise to sunset. Previously, and following the same procedure, soil PAR reflectance was determined using an inverted PAR sensor 400 mm above the soil in an adjacent open zone.
2.4. Sensitivity analysis
Sensitivity coefficients were determined including a change from −10 to 100% in optical parameter values. The calculations were performed for a clear day at summer solstice, in canopies with 10, 50 and 80% of ground cover, in a 6×6 m2 planting pattern, and LAD of 1.0 m2m−3. Daily PAR absorp-tion, direct-beam transmittance, diffuse transmittance, downward complementary radiation at soil level, and the radiation reflected by the canopy were the studied output. Regarding the G-function, the relative output increase with respect to a change in the leaf incli-nation distribution was analyzed. The following leaf inclination distributions were taken into account: the one measured in the adult olive tree, a planophile, a plagiophile of mean angle 45◦, and a spherical distribution, respectively.
2.5. LAD distributions within olive crowns
The impact of considering the olive trees as an ellipsoid or a set of subellipsoids was evaluated. Previously, the spatial distribution of LAD was deter-mined in the field, by measuring local LAD at various distances from the tree centre. Two groups of five adult olive trees var. ‘Picual’ with extreme variations in this index were chosen. The first group consisted of well-developed irrigated trees, pruned the previous month. The second group were non-irrigated trees, that were not pruned for seven years. The measure-ments were taken during April 1995. The local LAD (m2m−3) was calculated as the number of leaves con-tained in a cubic volume of 200 mm each side,
mul-tiplied by the mean leaf area. The cubic volume was built with wires, detachable at the vertices. In order to determine the mean leaf area, 400 leaves of adja-cent trees were selected at random, and their area was measured with a planimeter (LAI 3100 LI-COR, Lincoln, NE) resulting in a mean area of 427 mm2. The measuring points were as follows:
• Three levels within each tree were defined: tree cen-tre, 1 m above, and 1 m below the tree centre. • Two perpendicular directions (four radii, two
par-allels to the row and two normal to the row) were taken.
• Points located at 0, 0.5, 1, 1.5, 2.0 and 2.5 m (this last one only for the tree centre) from the central vertical axis were taken for each direction. The mean leaf area density (am) resulted as:
am=
where n is the number of radii, ri the radius with
re-spect to the position i (m), rnthe maximum tree radius
(m), and ai the local leaf area density averaged for the
five trees and the four horizontal radii (m2m−3). In order to evaluate the impact of LAD distribu-tions, two olive tree structures were chosen: (1) LAD uniformly distributed within the tree; and (2) each tree composed of five subellipsoids each having a variable horizontal radius, but the same vertical radius as the maximum subellipsoid. Local LAD obtained in the field was assigned to each one. The model outputs taken into account were (1) daily PAR transmittance of the canopy for the summer solstice, and (2) the diffuse transmittance at all points located under the four trees.
3. Results and discussion
3.1. Parameterization
3.1.1. The G-function
Fig. 2. Leaf inclination density function for olive trees var. ‘Picual’. Also other leaf angle distributions are shown.
Nevertheless, in the field distributions there were less horizontal leaves, and more with vertical trend. The mean angle for the young and the adult tree leaves were 32 and 35◦, respectively. They ranged between the value of a planophile distribution (27◦) and a uni-form function (45◦) (Goel and Strebel, 1984).
The angle distribution affects the radiation transfer. When leaves are erect, especially in the upper layers of a stand, the incident radiation at low zenith an-gles is better distributed toward lower layers, increas-ing their maximum photosynthesis (Lemeur, 1970). In the adult tree, two types of leaves were distinguished: those with the peduncle below the vertex (erect leaves) and those with the vertex below the peduncle (pendu-lum leaves). Once the angle between the vertical and the leaf within the interval 0–180◦(see Section 2) was measured in the field, the density function of this in-clination was built. When we separated the inin-clination density function from the upper and lower tree hemi-sphere, the frequency of erect leaves increases toward the upper parts while the number of pendulum leaves increases towards the lower parts of the canopy (Fig. 3). However, the leaf inclination distributions (0–90◦) were similar in the upper and lower part of the tree. Baldocchi et al. (1986) described decreases of leaf in-clination with depth in the canopy for an oak and a hickory stand. These types of variations are taken into account in radiative transfer theories on rare occasions. For instance, Wang and Baldocchi (1989) simulated the inclination decrease with depth, fitting a quadratic equation of the mean leaf inclination as a function of LAI, which does not seem necessary for olive accord-ing to our results.
Fig. 3. Leaf angle distribution function of the angle between the vertical and the leaf for an olive tree.
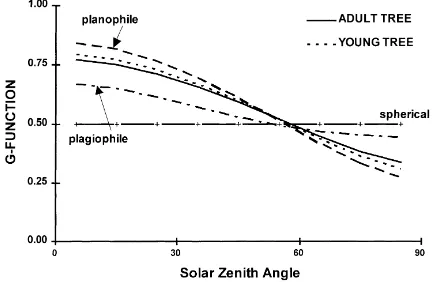
The G-function (Fig. 4) ranged from 0.8 to 0.3, with small differences between the old and the young olive trees. Just as in other plants (Lemeur, 1970), different leaf arrangements acted as an integrative means with respect to radiation interception such that the leaf an-gle distribution showed a softening effect in the value of G, particularly for extreme solar angles.
3.1.2. Leaf optical coefficients
Leaf reflectance and transmittance coefficients are shown in Table 3. The transmittance coefficients were under 0.01 and they did not vary with age or with sur-face. Ross (1981) showed a transmittance coefficient around 0.01 for the leaves of ficus and oleander, trees which are adapted to our conditions.
Our data follows Ross’s rule (Ross, 1981) for leaves in woody plants: the adaxial reflectance coefficient is
Table 3
Leaf reflectance and transmittance coefficients
Variety Surface Leaf age
young adult
Leaf transmittance
Picual Adaxial 0.002 0.002
Picual abaxial 0.007 0.001
Arbequina adaxial 0.002 0.001
Arbequina abaxial 0.002 0.001
Hojiblanca adaxial 0.001 0.001
Hojiblanca abaxial 0.001 0.001
Leaf reflectance
Picual adaxial 0.060 0.057
Picual abaxial 0.132 0.116
Arbequina adaxial 0.061 0.055
Arbequina abaxial 0.109 0.090
Hojiblanca adaxial 0.065 0.061
Hojiblanca abaxial 0.135 0.124
∼
=50% of the abaxial reflectance in the leaves of the year as well as in the old leaves. The differences among surfaces are explained basically by the presence of tri-comes on abaxial leaf surface (Grant, 1987). Adax-ial reflectance coefficients were significantly equal in ‘Picual’ and ‘Arbequina’. For the remaining cases, there were small differences (p<0.05) among culti-vars explained by the differences in tissue composi-tion. The cultivar with greatest reflectance was ‘Hoji-blanca’ (0.063, 0.13) followed by ‘Picual’ (0.06, 0.12) and ‘Arbequina’ (0.06, 0.10).
3.2. Validation
3.2.1. Canopy description
Table 2 shows the LAD and the PAI for each canopy. Canopy G was composed of five-year-old trees and canopies A, B, C, D and E were adult orchards. Our data indicated that LAD has a relatively constant value in adult orchards. However, it should be noted that the estimation of LAD in non-homogeneous canopies us-ing PCA may cause systematic errors. The young trees have higher LAD, which is in agreement with previ-ous measurements of Villalobos et al. (1995). There was a wide range of PAI values among the canopies that included the current values of extensive and inten-sive olive orchard. The greatest PAI (2.4, canopy A) is close to that of commercial apple trees (2.6; Jack-son, 1980) and smaller than that of continental-climate forest (3–7; Anderson, 1981).
3.2.2. Diffuse transmittance
The observed and estimated diffuse transmittances in all the 1×1 m2grid points disposed under the trees (cell validation) and their spatial integration (canopy validation) are presented in Fig. 5. The predicted cell values were different (p<0.05) from the ones ob-served and the root mean square error was 0.08. How-ever, the high R2 (0.90) allows the use of the model in trend analysis. Since the diffuse transfer only de-pends on the olive orchard geometry, the causes of the discrepancies between model and reality were prob-ably the geometric figure irregularities, the assump-tion of equality among surrounding trees, the lack of uniformity in the LAD distribution and the presence of holes in the crowns. Measurements at some points
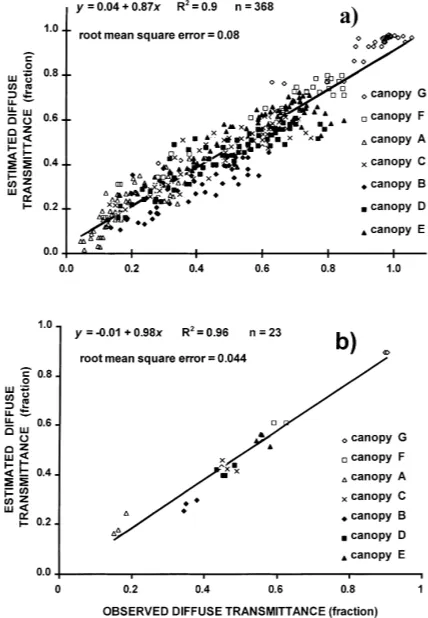
gave greater transmittance than expected, but that is compensated at other points, where it was less than expected. Thus, errors reduce when integrating spa-tially over the whole canopy, so that the transmittance estimate was statistically equal to the observed value, with a high determination coefficient of 0.96.
3.2.3. PAR transmittance
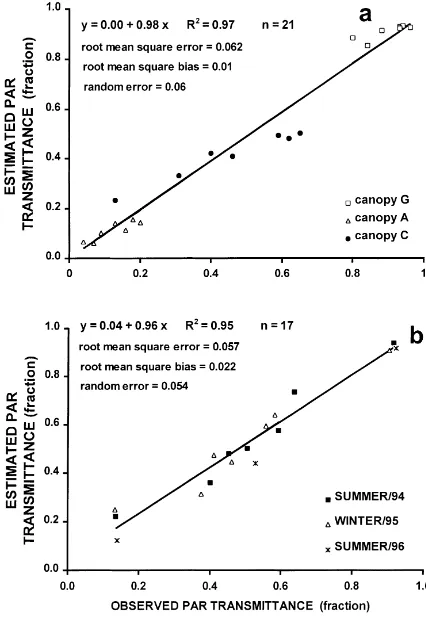
3.2.3.1. Validation at cell, canopy and daily level. Despite an R2 of 0.86, the scatter was substantial (root mean square error of 0.15) at the cell level (data not shown) and predictions were not acceptable. The causes of the great scatter may be, in principle, the same as those listed in the previous paragraph for dif-fuse radiation. Furthermore, under cloudless sky con-ditions, the radiant flux density assigned to each beam varies strongly. Solar diffuse radiation and scattering reaches all shading points. When any point is sunny, it can receive up to 50 times more energy than when it is shaded. The precision of estimates is greatly in-fluenced by the errors made above for the sun/shade options. Another possible source of error could be the solar radiation partition that was not measured in the field but was calculated according to Spitters et al. (1986) assuming an atmospheric transmittance of 0.85. Spatial integration from cell to canopy compensated errors. Thus, the model estimated the canopy trans-mittance accurately (Fig. 6). Again, we observed a similar behavior as in the diffuse transmittance: as the calculation scale increased, the model might be reli-able and the error reduced. Several authors (see, e.g. Cohen and Fuchs, 1987) found similar results when examining their models. They found a great scatter in the regression with high R2when validating for small spatial scales and a decrease in the scatter when vali-dating for larger spatial scales.
The daily PAR interception estimates (Fig. 6) were highly satisfactory, as the intercept and the regres-sion slope were zero and unity, respectively (p<0.05). The R2was very high (0.95) and the total error and the bias error were reasonably small (0.06 and 0.02, respectively). The errors did not reduce upon inte-grating from instant to daily level, indicating that the spatial variability is more important than temporal variability.
Fig. 6. Estimated vs. observed PAR transmittance. (a) Instantaneous PAR transmittance of the canopy; and (b) daily canopy values of PAR transmittance. All olive orchards are located at C´ordoba, Spain, and are of the ‘Picual’ variety.
3.2.3.2. Instantaneous canopy PAR transmittance at different heights. The predicted values of canopy PAR transmittance at heights of 0.5, 1, 1.5, 2 and 3 m were statistically identical (p<0.05) to the observed values (Fig. 7). In this case, the error (0.08) was halfway between that obtained in the instantaneous canopy PAR transmittance estimates (0.06) and the in-stantaneous point PAR transmittance estimates (0.15). In this case, the predictions are also acceptable.
3.2.4. Scattering
Fig. 7. Estimated PAR canopy transmittance vs. observed at heigths of 0.5, 1, 1.5, 2 and 3 m, in three olive groves located at C´ordoba, Spain.
overestimated by a diffuse transmittance underesti-mation under clear sky conditions. In the presence of direct-beam radiation, the diffuse radiation is not dis-tributed isotropically, but a large fraction comes from the sun direction. Since in this orchard there was only a small sunny zone, where measurements were made, the large fraction of diffuse radiation coming from the sun-direction was transmitted explicitly to the measur-ing point, with a transmittance greater than that obtained on a cloudy day.
The observed (0.005, 0.045 and 0.088) and esti-mated values (0.004, 0.03 and 0.02) were similar in order of magnitude. However, field data were slightly greater than the predictions. The reason for these un-derestimates may have been due to ignoring the spec-ular component of the abaxial reflectance. The model predicted greater scattering in the intermediate stand (C) than in the fully developed canopy (A). Our lim-ited field data do not allow us to discuss whether this model behavior is realistic or not.
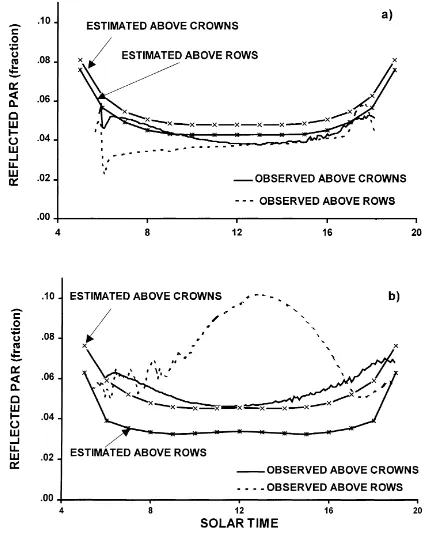
3.2.4.2. Radiation reflected by crowns and rows be-tween olive trees. The crown and row curves of re-flectance in canopies A and C appear in Fig. 8. The crowns reflected 5% in both the canopies and showed a typical albedo time-course (Monteith, 1973). This value was similar to the reflectance of other orchards, e.g. orange trees (Cohen and Fuchs, 1987).
The model over- and underestimated slightly the crown reflectance in canopies C and A,
respec-Fig. 8. Observed and estimated diurnal variation of PAR reflected by olive crowns and alleys. (a) Olive orchard A, well-developed canopy; and (b) olive orchard B, intermediate developed canopy. Measurements taken under clear sky conditions during July 1996, at C´ordoba, Spain. Olive trees are of the ‘Picual’ variety.
radiation intensity, suggesting that, in the presence of large canopy hollows, the idea of establishing an equivalence between a horizontal canopy and the olive orchard based on diffuse transmittance (Norman and Jarvis, 1975) does not seem appropriate since different direct-beam radiation situations existed.
In brief, as in other crops (Ross, 1981), the small values of downward and upward complementary radi-ation suggest that the PAR scattering process within an olive canopy may be neglected. Since the approxi-mation in the modelling of the different radiation com-ponents depends on their relative importance, the PAR scattering does not seem an aspect worthy of future development. However, this drawback in the theory would be limiting in widening the application of the model to short-wave irradiance, where both greater scattering and greater heterogeneity are expected.
3.3. Sensitivity analysis
The reflected radiation appeared slightly sensitive to the adaxial leaf reflectance, and the downward scat-tering to the soil was sensitive to the abaxial leaf re-flectance (Table 4). Concerning the daily PAR absorp-tion, the leaf reflectance has a small effect (<5%) and the leaf transmittance even less (data not shown). Re-garding the leaf inclination, the use of the function measured in the olive trees, a planophile or a plagio-phile (mean angle 45◦) would not produce great vari-ations in absorption estimvari-ations. The adoption of a highly generalized function, like the spherical, would
Table 4
Sensitivity coefficients to the leaf reflectance of the daily PAR absorption (qd), downward scattering at ground level (e) and re-flected radiation to the atmosphere (e′) for olive stands with
dif-ferent ground cover Ground Parameter Leaf cover variation surface
(fraction)
Adaxial Abaxial
qd e e′ qd e e′
0.1 −0.1 0.00 0.00 0.19 0.00 0.00 0.19 0.1 1 −0.02 0.00 0.02 −0.02 0.10 0.02 0.5 −0.1 0.00 0.00 0.36 0.00 0.38 0.00 0.5 1 −0.01 0.04 0.21 −0.01 0.42 0.00 0.8 −0.1 −0.01 0.00 0.29 0.00 0.00 0.00 0.8 1 −0.01 0.09 0.24 0.00 0.36 0.00
Table 5
Relative output variation when changing leaf inclination distributiona
Ground cover Leaf inclination qd tb tdif
0.1 olive 0 0 0
0.1 planophile 0.01 0 0
0.1 plagiophile −0.03 0 0
0.1 spherical −0.07 0.01 0
0.5 olive 0 0 0
0.5 planophile 0.01 −0.01 0
0.5 plagiophile −0.02 0.04 0.03
0.5 spherical −0.05 0.1 0.06
0.8 olive 0 0 0
0.8 planophile 0.01 −0.06 −0.04
0.8 plagiophile −0.02 0.19 0.16
0.8 spherical −0.05 0.48 0.39
aStudied variables: daily PAR absorption (qd), direct-beam (tb) and diffuse transmittance (tdif) for olive stand with different ground cover.
produce alterations in the direct-beam transmittance radiation and in the diffuse transmittance (Table 5). These results suggest that the model may be applied to other cultivars using the current parameters.
3.4. LAD distribution within tree and its impact on radiative transfer estimates
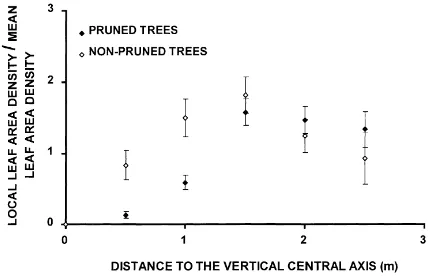
Field data show that LAD increased outwards slightly, especially in pruned trees (Fig. 9). This in-crease may be expressed as a function of the distance to the central vertical axis or as a function of the distance to the tree centre. The values of the deter-mination coefficient for linear and cubic relationships
Table 6
Determination coefficient of the relationship (linear or cubic) be-tween local LAD vs. (i) the distance to the central vertical axis and (ii) tree radiusa
Independent variable
distance to the vertical central axis tree radius type of relationship
linear cubic linear cubic
Pruned trees 0.50 0.54 0.29 0.32
Non-pruned 0.1 0.43 0.1 0.21
trees
aField data were obtained in pruned and non-pruned olive trees var. ‘Picual’. Bold letter signifies (p<0.05).
are shown in Table 6. In the case of non-pruned trees, the LAD was homogeneously distributed within the envelopes. On the contrary, the distance to the cen-tral vertical axis was the best variable explaining the LAD distribution in the pruned trees (R2=0.54 for a cubic relationship). Therefore, these distributions were accounted for in the model considering two tree geometries: an ellipsoid with a mean LAD, or a set of five concentric subellipsoids. Each subellipsoid had a LAD and the same vertical radius as the external one. When considering a subellipsoid set, the canopy interception increased 1% for the pruned trees (0.83 as compared to 0.82) and 8% (0.78 as compared to 0.72) for the non- pruned ones.
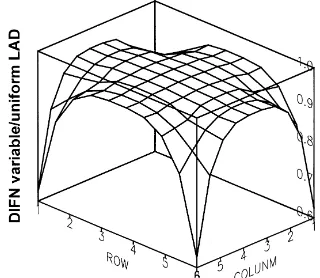
Although the LAD was relatively homogeneous for the non-pruned trees, the increase estimated by the model (8%) was greater than in the case of the pruned trees (1%). Thus, it seems that the importance of this issue depends at least on the absolute LAD value (2.1 m2m−3 for the pruned trees and 1.1 m2m−3for the non-pruned trees), and possibly on suntrack and tree volume. Furthermore, taking this issue into ac-count would have repercussions on the PAR distri-bution within the orchard. This can be vital for de-limiting zones with different photosynthetic rates and for determining the effects of pruning on radiative transfer. Fig. 10 shows the ratio of diffuse transmit-tance with/without subellipsoids for all the grid points under four pruned trees. The model estimated that the main transmittance differences would occur in below-crown points. Toward the canopy centre the dif-ferences would tend to cancel. These difdif-ferences were greater for the pruned trees, due to a significant LAD concentration toward the outer zones.
Fig. 10. Ratio between diffuse transmittance (DIFN) estimated for variable LAD within olive crowns and estimated considering that the LAD is distributed uniformly within tree crowns. LAD, leaf area density (m2m−3). The ratio is presented for 1 m×m cells located under four trees at 6×6 m2 planting pattern. The data of LAD correspond to the measured values for pruned olive trees.
In the literature, other models also incorporate these variations of LAD once they have been determined in the field. For example, Wang and Jarvis (1990) allow the user to select a function of LAD vs. tree radius (or radius and height). For olive trees there is an informa-tion gap on this point that deserves further research.
4. Conclusions
The parameters of a PAR interception model of olive orchards (G-function and leaf reflectance and trans-mittance) have been measured in the field. The olive leaf inclination distribution is similar to a planophile of mean angle 35◦. The G-function was numerically built from this distribution. Leaf reflectances measured in ‘Picual’, ‘Arbequina’ and ‘Hojiblanca’ cultivars av-eraged 0.06 for adaxial surfaces and 0.12 for abaxial surfaces, while leaf transmittances were below 0.01.
The model is reliable for estimating radiation in-tercepted by any olive orchard at instantaneous and daily levels. The root mean square error is 0.04 for diffuse radiation and 0.06 for total radiation estimates. At point and instantaneous levels, the model quantifies with less accuracy total PAR and diffuse PAR trans-mittance, with an average error of 0.08 for diffuse and 0.15 for total PAR estimates.
func-tion between a strict planophile and a plagiophile of mean angle 45◦ would scarcely affect the radiation balance. The model is applicable to other olive culti-vars using the current parameters.
Variations in LAD within olive tree crowns were found. The effects of pruning or other management practices on these LAD variations deserve further re-search. For strong variations of LAD within the trees, the model allows the crowns to be considered as a set of subellipsoids with different values of LAD. This possibility, as well as horizontal crown truncations, will allow analysis of the effect of pruning on PAR interception.
Application of this model to estimate short-wave radiation transfer would require an improvement in the scattering theory. The calibrated model will be a part of a general growth model of olive trees.
Acknowledgements
The authors thank Miguel Pastor Muñoz-Cobo for his help during the collection of field data. We grate-fully acknowledge the financial support for this work provided by the project AGF94-0598 of the Comisión Interministerial de Ciencia y Tecnolog´ıa (Spain) and the Junta de Andaluc´ıa (M.J. Mariscal held a predoc-toral fellowship from the Consejer´ıa de Agricultura, Junta de Andaluc´ıa).
References
Anderson, M.C., 1981. The geometry of leaf distribution in some south-eastern Australian forests. Agric. Meteorol. 25, 195–205. Baldocchi, D., Hutchison, B., Matt, D., McMillen, .R., 1986. Seasonal variation in the statistics of photosynthetically active radiation penetration in an oak–hickory forest. Agric. For. Meteorol. 36, 343–361.
Charles-Edwards, D.A., Thorpe, M.R., 1976. Interception of diffuse and direct-beam radiation by a hedgerow apple orchard. Ann. Bot. 40, 603–613.
Chen, J.M., Blanken, P.D., Black, T.A., Guilbeault, M., Chen, S., 1997. Radiation regime and canopy architecture in a boreal aspen forest. Agric. For. Meteorol. 86, 107–125.
Cohen, S., Fuchs, M., 1987. The distribution of leaf area, radiation, photosynthesis and transpiration in a shamouti orange hedgerow orchard. Agric. For. Meteorol. 40, 123–144.
Ganis, A., 1997. Radiation transfer estimate in a row canopy: a simple procedure. Agric. For. Meteorol. 88, 67–76.
Goel, N., Strebel, E., 1984. Simple beta distribution representation of leaf orientation in vegetation canopies. Agron. J. 76, 800– 802.
Goudriaan, J., 1977. Crop Micrometeorology: A Simulation Study. Pudoc, Wageningen.
Grant, L., 1987. Diffuse and specular characteristic of leaf reflectance. Rem. Sensing Environm. 22, 309–322.
Jackson, J.E., 1980. Light interception and utilization by orchard systems. Hortic. Rev.. 2, 208–267.
Kuuluvainen, T., Pukkala, T., 1987. Effect of crown shape and tree distribution on the spatial distribution of shade. Agric. For. Meteorol. 40, 215–231.
Lemeur, R., 1970. Effects of spatial leaf distribution on penetration and interception of direct radiation. In: Plant Response to Climatic Factors. Proc. Uppsala Symp., UNESCO, pp. 349–356. Lemeur, R., 1973. A method for simulating the direct solar radiation regime in sunflower, Jerusalem artichoke, corn and soybean canopies using actual stand structure data. Agric. For. Meteorol. 12, 229–247.
Mariscal, M.J., Orgaz, F., Villalobos, F.J., 1998. Radiation use efficiency by a young olive orchard (Olea europaea L.). Proc. 5th. E.S.A. Congress. Nitra. Eslovak Republic, pp. 324–325. Miller, E.E., Norman, J.M., 1971. A sunfleck theory for plant
canopies I. Lengths of sunlit segmentes along a transect. Agron. J. 63, 735–739.
Monsi, M., Saeki, T., 1953. Uber den Liechfaktor in den Pflanzengesellschaften und seine Bedeutung für die Stoffproduktion. Jpn. J. Bot. 14, 22–52.
Monteith, J.L., 1969. Light interception and radiative exchange in crops stands. In: Eastin, J.D. (Ed.), Physiological Aspects of Crop Yield. American Society of Agronomy, Madison, WI, pp. 89–111..
Monteith, J.L., 1973. Principles of Environmental Physics. Edward Arnold, London, UK.
Myneni, R.B., Ross, J., Asrar, G., 1989. A review on the theory of photon transport in leaf canopies. Agric. For. Meteorol. 45, 1–153.
Myneni, R., 1991. Modeling radiative transfer and photosynthesis in three-dimensional vegetation canopies. Agric. For. Meteorol. 55, 323–344.
Nilson, T., 1992. Radiative transfer in nonhomogeneous plant canopies, In: Stanhill, G. (Ed.), Advances in Bioclimatology. Springer, Berlin. pp. 342–362.
Norman, J.M., Jarvis, P.G., 1975. Photosynthesis in Sitka Spruce (Picea sitchensis (Bong.) Carr.) V. Radiation penetration theory and a test case. J. Appl. Ecol. 12, 839–878.
Norman, J.M., Welles, J.M., 1983. Radiative transfer in an array of canopies. Agron. J. 75, 481–488.
Oker-Blom, P., 1984. Penumbral effects on within-plant and between plant shading on radiation distribution and leaf photosynthesis: a Monte-Carlo simulation. Photosynthetica 18, 522–528.
Rosenberg, N.J., Blad, B.L., Verma, S.B., 1983. Microclimate: The Biological Environment. Wiley–Interscience, New York. Ross, J., 1981. The Radiation Regime and Architecture of Plant
Spitters, C., Toussanint, H., Goudriaan, J., 1986. Separating the diffuse and direct component of global radiation and its implications for modeling canopy photosynthesis. Part I. Components of incoming radiation. Agric. For. Meteorol. 38, 217–229.
Stamper, J.H., Allen, J.C., 1979. A model of the dialy photosynthetic rate in a tree. Agric. Meteorol. 20, 459–481. Van Kraalingen, D.W.G., Breure, C.J., Spitters, C.J.T., 1989.
Simulation of oil palm growth and yield. Agric. For. Meteorol. 46, 227–244.
Villalobos, F.J., Orgaz, F., Mateos, L., 1995. Non-destructive measurement of leaf area in olive (Olea europaea L.) trees using a gap inversion method. Agric. For. Meteorol. 73, 29–42. Wagenmakers, P.S., 1991. Simulation of light distribution in dense
orchard systems. Agric. For. Meteorol. 57, 13–25.
Wang, H., Baldocchi, D.D., 1989. A numerical model for simulating the radiation regime within a deciduos forest canopy. Agric. For. Meteorol. 46, 313–337.