RAINFALL IN AN EXPERIMENTAL WATERSHED: A COMPARISION BETWEEN
OBSERVED AND TRMM 3B42V7 DATASET
L. R. Barbosa a,, E. S. Freitas a, C. N. Almeida a, *, D. C. D. Melo b
a Federal University of Paraíba - Civil & Environmental Department, João Pessoa - Paraíba - Brazil - [email protected] b
Department of Hydraulics and Sanitary Engineering – University of São Paulo – São Carlos – Brazil – [email protected]
Commission VI, WG VI/4
KEY WORDS: rainfall, yearly data, monthly data, experimental watershed, TRMM data.
ABSTRACT:
In 2003, a network for hydrology of the semiarid region (REHISA in Portuguese) was created in Brazil. Since then, experimental watersheds in this region has been providing hydrometeorological data collected in automatic stations. However, the spatial distribution of these gauges might be insufficient to thoroughly understand the hydrological processes occurring in the area. Remotely sensed hydrological variables presents a possible way to overcome such limitations as long as these estimates prove to have enough accuracy. This paper compares the monitored yearly and monthly rainfall in the Guaraíra experimental watershed with data from the Tropical Rainfall Measuring Mission (TRMM) 3B42 Version-7 product. The study area has a drainage area of 5.84 km² and is located in the coastal region of Paraíba State, where the mean annual rainfall is 1,700 mm. Two automatic stations provided rainfall data from 2004 to 2011 to assess the satellite estimates in annual and monthly basis. TRMM 3B42V7 performance was evaluated based on graphical analysis. In the annual analysis, relative error ranged from 3 to -51%, however due to the monthly variation, such errors seemed to be insufficient to draw any conclusion, regarding the monthly results. For instance, when the relative error was 3% (difference of 48.3 mm for year 2004), the monthly analysis showed that this was due to a compensation occurred during the year, this is, a month for which rainfall was significantly underestimated by TRMM was compensated by another one when the satellite rainfall was overestimated. On the opposite, in 2007 (relative error 51%, 855 mm of difference), the monthly data analysis showed that just 4 months presented observed data overestimation, but it was enough to result in such annual overestimation. The monthly analysis showed that 29% of the months presented difference between observed rainfall and TRMM data greater than 70 mm and less than 386 mm, which can be considered a relevant error. 72.4% of these cases (monthly analyses) occurred in years in which the annual rainfall were within the ordinary mean (from 1,205 to 1,760 mm/year). Another important result is the underestimation cases were concentrated on the second part of the rainy period. Thus, conclusions points out that TRMM estimates can provide useful information on annual basis, but users should be aware concerning the underestimation, specially on monthly basis for the studied region.
*
Corresponding author. This is useful to know for communication with the appropriate person in cases with more than one author.
1. INTRODUCTION
Rainfall data is the main input of hydrological systems, this type of data plays a important role in order to understand the hydrological cycle. Rainfall measurement can be done directly on the ground, based on automatic gauges (e.g. tipping bucket or weight principle) or on manual measurements (an opened funnel into a cylinder gauge). In both cases, if rainfall data is needed in high spatial-temporal resolution, a lot of efforts will be needed. Alternatively, there is a possibility to obtain rainfall data based on remote sensing measurements.
Currently, this last method plays an important role, due to the facility to download satellite products which allows to estimate the rainfall for large areas in a finer temporal resolution. The TRMM (Tropical Rainfall Measurement Mission) products mission has emerged as one possible solution to estimate rainfall in different parts of the World, where even basic techniques to measure rainfall do not exist. The increase number of papers either applying or assessing such datasets attests the relevance of such data source.
Kizza et al. (2012) used TRMM 3B43 product to estimate areal rainfall over Lake Victoria (Africa); Chen et al. (2013) evaluated the performance of two TRMM consecutive versions
(3B42-V6 and V7) in estimating rainfall over the southern continental United States. They concluded that the latest version (3B42-V7) has meaningfully improved predecessor in terms of bias and correlation coefficient. In Brazil, pioneer studies were published by Franchito et al. (2009) and Juárez et al. (2009), in which they compared observed versus satellite-based rainfall in large scale. Other analysis were reported later by Buarque et al. (2011) and Clarke et al. (2011) for the Amazon region and, more recently, by Camparotto et al. (2013) and Oliveira et al. (2014) regarding, respectively, the São Paulo State and the Brazilian Cerrado.
Although such studies encompassed different time periods and sample sizes, only that from Oliveira et al. (2014) used rainfall data from both the latest TRMM version (V7) and 3B42-V6. As the quality of TRMM estimates varies in space (Chen et al., 2013), it is important to quantify its performance for other regions in Brazil that were not addressed by Oliveira et al. (2014). In this paper, we compare TRMM estimates against observed rainfall in northeastern Brazil.
measurements, in order to study the hydrological cycle in semiarid regions. This network named REHISA, in Portuguese, which means Network for Hydrology of Semiarid Regions, installed experimental watersheds in different parts of the Brazilian northeasters region. In this case, the rainfall monitoring is carried out in a sub-hourly time step, and can be used for comparison with TRMM data.
Thus, the aim of this paper is to present a study which was carried out with rainfall data of an experimental watershed, comparing with TRMM B42V7 dataset. The comparison was done on yearly and monthly basis, using graphical and numerical indicators.
2. MATERIAL & METHODS
2.1 Study Area
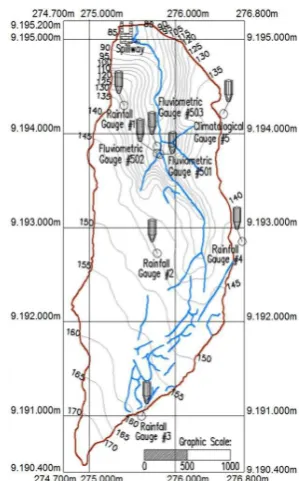
The study area is an experimental watershed named Guaraíra river, located in the northeastern part of Brazil, its drainage area is 5.84 km² and their monitoring instruments were installed in 2003 (Figure 1). This network was installed in order to monitoring and studying the hydrological cycle of experimental watersheds in semiarid regions. The Water Resources Group of the Federal University of Paraíba (UFPB) is a member of this network and operates the Guaraíra experimental watershed since 2003. This watershed is the only one from the whole network that is not located in the semiarid region.
Figure 1. Study area location. Clockwisely, we show the map of northeastern Brazil, Paraíba State, the Gramame basin and
the Guaraíra experimental basin
The mean annual rainfall is 1,700 mm and the rainy period ranges from March to July. The climate is Rainy Tropical and the annual mean temperature is 26oC. Its main land use is sugarcane crop and there are still some Rain Forest fragments. The rainy period of the study area ranges from March to July (Figure 2).
Figure 2. Monthly rainfall distribution
2.2 Hydrological Monitoring
The hydroclimatological monitoring network is made up of four rainfall gauges, one hydroclimatological gauge and three discharge gauges (Figure 3).
Figure 3. Guaraíra experimental watershed - Monitoring network
Rainfall gauges have two different monitoring devices: a rainfall TB4 and Time Domain Reflectory (TDR) sensors, both are connected to a CR510 datalogger. The rainfall is measured and stored every minute, when it happens, and every six hour the rainfall is accumulated and stored in the datalogger. The soil moisture is measured and stored every hour.
The hydroclimatological gauge has sensors to measure rainfall, wind speed and direction, soil temperature at 3 different depths (5, 15 and 30 cm), barometric pressure, solar radiation and air temperature. In this type of station the data logger is a CR 23X, and rainfall is store at one minute time step, while the other measured variable are stored every 15 minutes. All these sensors and data loggers are from Campbell Scientific. Finally, the water level in 3 different points of the watershed is measured every 15 minutes using a self-developed sensor and datalogger.
Although the monitoring network was installed in 2003, the time series is not fully complete. Due to periods without financial support the monitoring was suspended.
2.3 TRMM Data
Satellite-based rainfall estimates are based on the electromagnetic spectrum, which can be measured by thermal infrared or passive microwave sensors (Negri et al., 1984; Worqlul et al., 2014). The TRMM satellite combines both sensors, overcoming their intrinsic limitations. For instance, the first sensor tends to underestimate warm rain and the second one is not available in geostationary satellites (Dinku et al., 2011; Heinemann et al., 2002; Worqlul et al., 2014). TRMM data was downloaded from the Mirador website (http://mirador.gsfc.nasa.gov/) and rainfall time series for the study area was extracted using GrADS (Grid Analysis and Display System) software. These datasets can also be accessed via File Transfer Protocol (ftp://trmmopen.gsfc.nasa.go v/pub/merged).
Gridded rainfall from TRMM have a spatial resolution of 0.25º over regions between 50º N and 50º S (Huffman et al., 2007) and 3-hourly data since 01/01/1998 is available.
2.4 Data Analysis
The analysis carried out in this paper was based on comparison between monitored rainfall and TRMM data. The first analysis was done on yearly basis, but then a monthly analysis was carried out in order to corroborate the yearly analysis. TRMM underestimation and overestimation was carefully analyzed, in order to find if there is a pattern. Then, the difference between TRMM and monitored data were ordered from the lowest to the highest value. Most of the results are presented in chart format to facilitate analysis.
3. RESULTS
The results are divided into two parts: in the first one a yearly comparison was done; while in the second one, the investigation goes deeper in the monthly data comparison. In both data range from 2004 to 2011.
3.1 Yearly Analysis
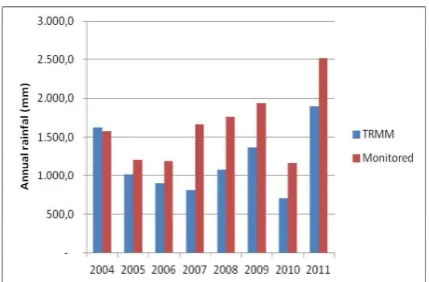
During the analysed period (2004 to 2011) the monitored annual rainfall ranges from 1,167.90 to 2,514.30 mm, while the TRMM sensor indicated values from 704.20 to 1,900.10 mm. As can be seen, the sensor failed to capture both the maximum and minimum observed rainfall ranges..
Figure 4 shows the annual rainfall data of TRMM sensor and also monitored data.
Figure 4. Annual rainfall - TRMM x Monitored data
Figure 4 shows that the smallest difference between TRMM and monitored data was in 2004, when the difference was just 48.3 mm (3.1% error). In the other years, it can be seen that the TRMM sensor always underestimate the monitored data. The underestimation ranges from 15.6% to 51.5%, year 2005 and 2007, respectively. The average underestimation is about 32%.
However, these values cannot lead to a final conclusion about the quality of the TRMM data, as will be shown in the monthly analysis.
3.2 Monthly Analysis
In the monthly analysis, TRMM and monitored data were compared on a monthly basis, in order to verify if there was an agreement between yearly and monthly data.
The first comparison was done simply comparing the absolute difference between the TRMM and the monitored data. It could be seen that the values ranges from 0.12 to 386.72 mm, with an average of 61.82 mm with a standard deviation of similar magnitude (62.63 mm), which means a variation coefficient of 102%.
The three next charts present comparison between TRMM and monitored data for years 2004, 2007 and 2009.
Figure 6. Monthly rainfall – TRMM x monitored data (year 2007)
Figure 7. Monthly rainfall – TRMM x monitored data (year 2009)
Just for remembering, 2004 was the year which present the lowest difference and 2007 the greatest difference in the yearly analysis. In this analysis, it can be seen that 2004 presented under and overestimation, when the comparison is done by month, and there is a kind of compensation leading to a low difference on the yearly basis. The months 2 and 4 TRMM presented higher values (231.9 mm against 80.3 mm and 236.7 mm against 156.7 mm, respectively), while 6 and 7 monitored data presented higher values (369.6 mm against 308.0 mm and 339.1 mm against 202.8 mm, respectively). There are other differences in 2007, but these four are the larger ones. On the other hand, 2007 was the year that presented the largest difference, but when the monthly data is analysed, it can be seen that this difference is concentrated in four months, from 6 to 9. The monitored data for these four mouths were approximately four, two, fourteen and tenfold. If the difference were lower in these four months, the annual difference would be also lower.
Analyzing year 2009, it can be seen that, in terms of months, the biggest errors are concentrated on the dry season, while in the wet season (from March to July) the difference between TRMM and monitored data tends to be lower. This analysis can be better seen in Figure 8.
Figure 8. Linear agreement between TRMM and Monitored data on the monthly basis (year 2009)
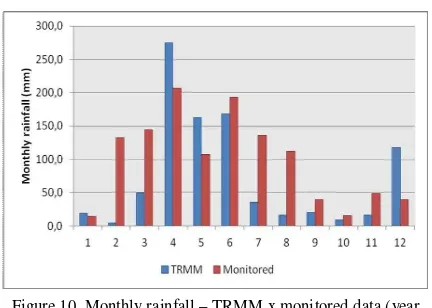
In the monthly analysis, years 2005 and 2006 presented different situation, as can be seen in the following figures. In both years, the TRMM underestimated the rainfall, and there is not a good agreement between TRMM and monitored data.
Figure 9. Monthly rainfall – TRMM x monitored data (year 2005)
Figure 10. Monthly rainfall – TRMM x monitored data (year 2006)
Figure 11. Average monthly rainfall (TRMM, Monitored and historical data)
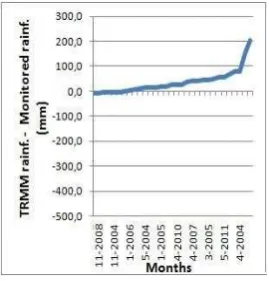
In order to quantify the over and underestimation, on monthly basis, the differences between TRMM and monitored rainfall were analysed. Just for better understanding, negative values mean TRMM underestimation and positive values mean TRMM overestimation. The calculated values were order from the lowest value (underestimation) (Figure 12) to the highest value (overestimation) (Figure 13).
Figure 12. Monthly underestimation
Figure 13. Monthly overestimation
Analyzing Figure 12 and Figure 13 it can be seen that, 72 months (75% of cases) presented underestimation, ranging from -386.7 to -0.1 mm. On the opposite, 24 months (25% of cases) presented overestimation, ranging from 4.5 mm to 202.3 mm. The total amount of rainfall underestimation was -4.749.7 mm, while the total amount of overestimation was 1,128.3 mm. At the same time, the relative difference was also analysed, however in some cases this difference does not have meaning. Sometimes, the values can be higher than 700%, but it was
related to low rainfall values, 19.1 and 2.3 mm, TRMM and monitored rainfall, respectively. Thus, it was decided not to consider this type of analyses.
Finally, in order to understand what are the periods that have overestimation and underestimation, the difference between monitored rainfall and TRMM rainfall were ordered again from the lowest to the highest value, but separated into 3 different periods (February to May, June to September e October to January) (Figures 14, 15 and 16).
Figure 14. Overestimation and underestimation from February to May
Figure 15. Overestimation and underestimation from June to September
Comparing the three last figures, it can be seen that the period from February to May overestimation and underestimation were found in the analysis, while most of the months from June to September and October to January presented underestimation cases. The period from June to December, during 8 years, just 2 months (3.6% of the cases) presented overestimation, while 54 months (96.4% of the cases) presented underestimation. The other months (from January to May) there are cases of underestimation and overestimation. Overestimation cases for the first part of the years are 55% of the cases, while underestimation represents 45% of the cases. In terms of magnitude, it can be seen that lowest underestimation values were concentrated in October, November and December, the three driest months of the year. The beginning of the rainy period (March, April and May) presented underestimation and overestimation cases, while in the second part of the rainy period (June e July) presented just underestimation cases. between TRMM and monitored rainfall was underestimated on the annual analysis. In fact, the monthly analysis showed that during some months there was overestimation and in others underestimation, which led to a low difference of the annual rainfall.
Comparing average monthly rainfall of TRMM, monitored and historical data it was seen that the second part of the rainy period is always underestimated. This conclusion also came with the analysis of average monthly rainfall of TRMM, monitored rainfall and historical data.
Finally, in general, it was observed that the TRMM sensor underestimated the rainfall for this study area. 75% of the analysed months presented underestimation, ranging from -386.7 to -0.1 mm. The overestimation cases (25% of the months) range from 4.5 to 202.3 mm. In other words, the magnitude of the underestimation and the number of cases were larger than the overestimation. In terms of rainfall, the underestimation cases mean a total of 4,749.7 mm, while the overestimation cases result in 1,128.3 mm of rainfall. It means that the underestimation of rainfall was fourfold the CNPq by his research productivity fellowship.
REFERENCES
Buarque, DC, De Paiva, RCD, Clarke, RT., Mendes, CAB. A comparison of Amazon rainfall characteristics derived from
TRMM, CMORPH and the Brazilian national rain gauge network. Journal of Geophysical Research: Atmospheres 116 (D19): n/a-n/a. DOI: 10.1029/2011JD016060.
Camparotto LB, Blain GC, Giarolla A, Adami M, Camargo MBP. 2013. Validation of temperature and rainfall data obtained by remote sensing for the state of São Paulo, Brazil. Revista Brasileira de Engenharia Agrícola e Ambiental 17: 665-671.
Clarke R, Buarque D, Paiva R, Collischonn W. 2011. Issues of spatial correlation arising from the use of TRMM rainfall estimates in the Brazilian Amazon. Water Resources Research 47 (5), n/a-n/a. DOI: 10.1029/2010WR010334.
Dinku, T., Ceccato, P., and Connor, S. J.: Challenges of satel- lite rainfall estimation over mountainous and arid parts of east Africa, Int. J. Remote Sens., 32, 5965–5979, 2011
Franchito SH, Rao VB, Vasques AC, Santo CME, Conforte JC. 2009. Validation of TRMM precipitation radar monthly rainfall estimates over Brazil. Journal of Geophysical Research: Atmospheres 114: n/a–n/a. DOI:10.1029/2007JD009580.
Juárez RIN, Wenhong L, Fu R, Fernandes K, Cardoso AO. 2009. Comparison of Precipitation Datasets over the Tropical South American and African Continents. Journal of Hydrometeorology 10 : 289-299. DOI: 10.1175/2008JHM1023.1.
Huffman GJ, Adler RF, Bolvin DT, Gu G, Nelkin EJ, Bowman KP, Hong Y, Stocker EF, Wolff DB. 2007. The TRMM multi-satellite precipitation analysis: Quasi-global, multi-year, combined-sensor precipitation estimates at fine scale. Journal of Hydrometeorology 8(1): 38–55. DOI doi:10.1175/JHM560.1. Heinemann, T., Latanzio, A., and Roveda, F.: The Eumetsat multi-sensor precipitation estimate (MPE), Second International Precipitation Working group (IPWG) Meeting, 23–27 September 2002, Madrid, Spain, 2002.
Kizza M, Westerberg I, Rodhe A, Ntale HK. 2012. Estimating areal rainfall over Lake Victoria and its basin using ground-based and satellite data. Journal of Hydrology 464 : 401-411. DOI: 10.1016/j.jhydrol.2012.07.024.
Negri, A. J., Adler, R. F., and Wetzel, P. J.: Rain estimation from satellites: an examination of the Griffith-Woodley technique. Journal of Climate and Applied Meteorology, v. 23, p. 102–116, 1984


