i
LAPORAN AKHIR
PENELITIAN UNGGULAN
DANA ITS 2020
Sistem Monitoring Genangan Real Time Terintregrasi di Perkotaan Sebagai Upaya Mitigasi
Banjir Berbasis Sensor
HC-SR04 dan IoT
Tim Peneliti :
Dr. Techn. Umboro Lasminto (Dept. Teknik Sipil/FTSPK)
Dr. Berlian Al Kindhi (Dept. Teknik Elektro Otomasi/Fakultas Vokasi) Anak Agung Ngurah Satria Damarnegara,Ph.D. (Dept. Teknik Sipil/ FTSPK)
Ira Anjasmara, Ph.D. (Dept. Teknik Geomatika/FTSPK)
FTSPK)
DIREKTORAT RISET DAN PENGABDIAN KEPADA MASYARAKAT
INSTITUT TEKNOLOGI SEPULUH NOPEMBER
SURABAYA
2020
Daftar Isi
Daftar Isi ... i
Daftar Gambar ... ii
Daftar Lampiran ... iii
BAB I RINGKASAN ... 1
BAB II HASIL PENELITIAN ... 2
2.1. Tahapan Penelitian ... 2
2.2. Hasil yang telah dicapai ... 2
2.2.1. Modul Pengukur Tinggi Air ... 2
2.2.2. Modul Pengirim data ... 5
2.2.3 Pengolah data center berbasis web ... 5
BAB III STATUS LUARAN... 6
BAB IV KENDALA PELAKSANAAN PENELITIAN ... 8
BAB VI RENCANA TAHAPAN SELANJUTNYA ... 9
BAB VII DAFTAR PUSTAKA ... 10
BAB VIII LAMPIRAN... 11
LAMPIRAN 1 Tabel Daftar Luaran ... 12
ii
Daftar Gambar
Gambar 1. Tahapan penelitian pembangunan alat pengukur ketinggian air ... 2
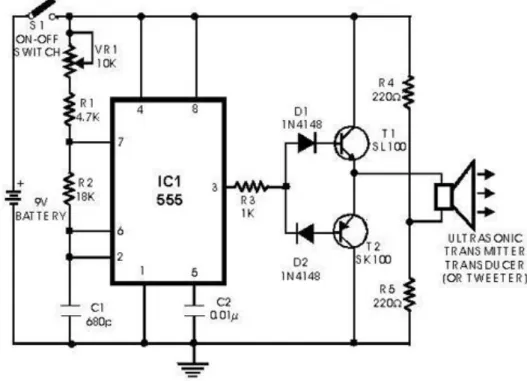
Gambar 2. Rangkaian transmitter ultrasonik ... 3
Gambar 3. Rangkaian receiver sensor ultrasonik ... 4
Gambar 4. Sistem pengukur waktu pada sensor HC-SR04 ... 4
Gambar 5. Tampilan website yang telah dicapai masih menampilkan data apa adanya tanpa normalisasi ... 5
Daftar Lampiran
Lampiran 1. Status luaran wajib under review pada jurnal Q1 ... 14
Lampiran 2. Bukti luaran tambahan conference internasional ... 15
Lampiran 3. Lampiran tambahan foto prototype alat yang dibangun ... 16
1
BAB I RINGKASAN
Permasalahan banjir merupakan salah satu permasalahan yang sering terjadi di kota-kota besar di Indonesia. Hal ini muncul disebabkan oleh berbagai faktor, antara lain: perubahan tata guna lahan, curah hujan yang relatif tinggi dan sistem drainase yang tidak mencukupi. Kota Surabaya telah berupaya mengurangi risiko banjir, yang tercakup dalam Masterplan Drainase Kota Surabaya. Namun, masih terdapat beberapa titik genangan yang terjadi apabila terdapat curah hujan yang tinggi. Hal ini tentu memerlukan suatu penanganan yang komprehensif untuk mengurangi dampak yang ditimbulkan oleh genangan tersebut. Hal ini diperparah dengan adanya perubahan iklim akibat pemanasan global, sehingga kota-kota besar seperti Surabaya diharapkan mampu beradaptasi salah satunya dalam hal pengelolaan banjir dan genangan. Untuk memperoleh suatu solusi adaptif, pendataan pola genangan yang terjadi di lapangan merupakan hal yang penting dan perlu dilakukan.
Selama ini, proses pendataan genangan yang ada masih berbasis pencatatan manual, sehingga kedalaman dan luas genangan yang terjadi tidak akurat. Hal ini juga sulit dilakukan, karena keterbatasan akses dan tenaga survei. Sistem ini juga tidak bersifat real time sehingga tidak mencukupi untuk dijadikan dasar dalam pengembangan sistem peringatan dini bencana. Untuk memperoleh suatu solusi adaptif, pendataan pola genangan yang terjadi di lapangan merupakan hal yang penting dan perlu dilakukan. Untuk dapat memperoleh data genangan yang real time, maka penggunaan alat berbasis IOT
menjadi salah satu alternatif yang menjanjikan.
Dalam penelitian ini, akan dikembangkan sistem pemantauan genangan banjir berbasis
IOT, yang meliputi alat pembaca elevasi muka air, sistem pemantauan genangan berbasis web dan sistem pelaporan luas dan kedalaman genangan banjir sebagai bahan evaluasi pemangku kebijakan kota. Pengembangan ke depan dari sistem ini adalah dengan mengintegrasikan sistem drainase kota dengan pola genangan dalam menyusun strategi penanggulangan banjir dan peringatan dini banjir. Keunggulan alat yang diusulkan adalah , hingga saat ini belum ada alat monitoring genangan air dengan jumlah besar baik di Surabaya maupun di Indonesia. Biaya yang murah untuk pembangunannya sehingga dapat diinstalasi dengan jumlah jamak di seluruh area-area kota. Selain itu sistem yang dibangun terintegrasi secara real time sehingga memudahkan monitoring.
Ringkasan penelitian berisi latar belakang penelitian,tujuan dan tahapan metode penelitian, luaran yang ditargetkan, kata kunci
BAB II HASIL PENELITIAN
2.1. Tahapan Penelitian
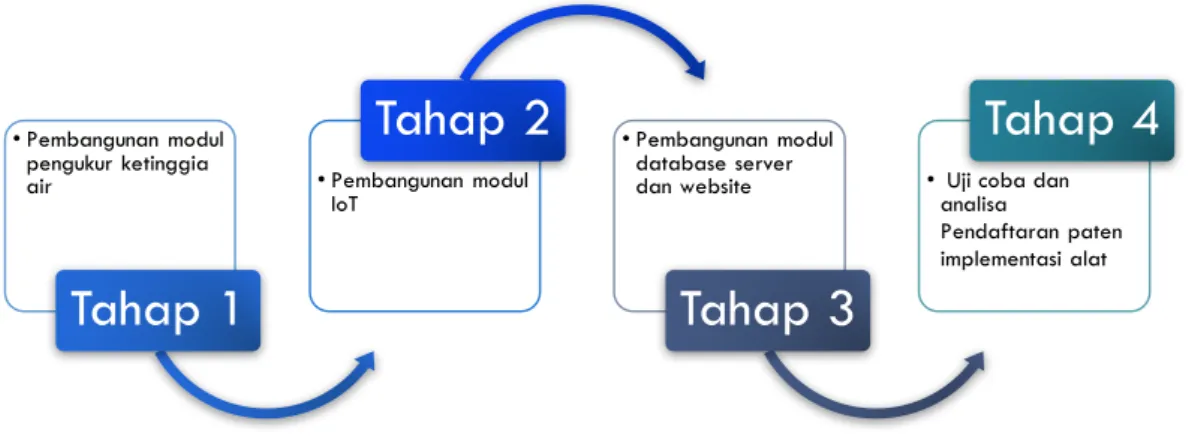
Tahapan penelitian dalam pembangunan alat pengukur ketinggian genangan air pada banjir dapat diamati pada gambar 3. Pada Gambar 3. Dapat dijelaskan bahwa penilitian ini terdiri dari empat tahap yang saling berhubungan, tahap awal adalah membangun modul pengukur ketinggian genangan air yang berbasis sensor HC-SR04. Kemudian tahap ke dua adalah pembangunal modul IoT, modul ini berfungsi untuk mengirimkan data hasil pembacaan sensor ke database server. Tahap ke tiga adalah modul database dimana pada tahap ini kami melakukan pembangunan aplikasi website untuk menyajikan data yang terlah tersimpan di databse sehingga lebih mudah dibaca dan dipantau oleh pihak yang berwenang dalam hal ini.
Gambar 1. Tahapan penelitian pembangunan alat pengukur ketinggian air
2.2. Hasil yang telah dicapai
Penelitian pendahuluan telah dilakukan untuk studi visibilty pembuatan alat yang diusulkan, hasil yang telah dicapai dapat dipelajari pada sub bab 3.2.1. hingga 3.2.3.
2.2.1. Modul Pengukur Tinggi Air
Modul pengukur tinggi air terdiri dari satu komponen rangkaian dengan daya baterai dan dengan sensor utama yaitu ultrasonik. Adapun cara kerja sensor tersebut dalam membaca ketinggian air adalah dengan memancarkan sinyal oleh pemancar sinyal ultrasonik dengan frekuensi tertentu dan dengan durasi waktu tertentu. Sinyal tersebut berfrekuensi diatas 20kHz. Untuk mengukur jarak benda (sensor jarak), frekuensi yang umum digunakan adalah 40kHz. Sinyal yang dipancarkan akan merambat sebagai gelombang bunyi dengan kecepatan sekitar 340 m/s. Ketika menumbuk suatu benda, maka sinyal tersebut akan dipantulkan oleh benda tersebut. Setelah gelombang pantulan sampai di alat penerima, maka sinyal tersebut akan diproses untuk menghitung jarak benda tersebut. Jarak benda dihitung berdasarkan rumus:
• Pembangunan modul pengukur ketinggia air
Tahap 1
• Pembangunan modul IoTTahap 2
• Pembangunan moduldatabase server dan website
Tahap 3
• Uji coba dan analisa
Pendaftaran paten implementasi alat
3
𝑆 =
#$%.'(
(1)
S merupakan jarak antar sensor ultrasonik dengan bidang yang dipantulkan. 340 merupakan konstanta untuk kalibrasi dari gelombang ultrasonik ke jarak, kemudian t adalah selisih antara waktu pemancaran gelombang oleh transmitter dengan waktu gelombang tersebut dipantulkan kembali dan diterima leh receiver.
Pada penelitian ini kami menggunakan sensor ultrasonik jenis HC-SR04, dimana modul receiver dan transmitter sudah menjadi satu dalam sensor trersebut. Rangkaian sensor HC-SR04 terdiri dari Piezoelektrik, Transmitter, dan Receiver.
Piezoelektrik merupakan bagian dari sensor ultra sonik yang berfungsi untuk mengubah energi listrik menjadi energi mekanik. Material pembuatan piezoelektrik adalah material yang bersifat memproduksi medan magnet sehingga mampu menghasilkan regangan atau tekanan mekanis. Jika rangkaian sesnor beroperasi pada mode pulsa elemen piezoeletrik yang sama, maka sensor ultrasonik yang memiliki piezo elektrik tersebut dapat digunakan sebagai transduce dan receiver. Namun frekuensi yang ditimbulkan dapadt tergantung osilator yang disesuaikan dengan fekuensi dari masing-masing transducer.
Komponen berikutnya dari sensor ultrasonik adalah transmitter. Transmitter berfungsi sebagai alat pemancar gelombang dengan besarnya 40.000 Hz yang dibangkitkan oleh osclitaor. Untuk menghasilkan frekuensi 40 KHz, harus di buat sebuah rangkaian osilator dan keluaran dari osilator dilanjutkan menuju penguat sinyal. Besarnya frekuensi ditentukan oleh komponen RLC / kristal tergantung dari disain osilator yang digunakan. Penguat sinyal akan memberikan sebuah sinyal listrik yang diumpankan ke piezoelektrik dan terjadi reaksi mekanik sehingga bergetar dan memancarkan gelombang yang sesuai dengan besar frekuensi pada osilator.
Receiver terdiri dari transduser ultrasonik menggunakan bahan piezoelektrik, yang berfungsi sebagai penerima gelombang pantulan yang berasal dari transmitter yang dikenakan pada permukaan suatu benda atau gelombang langsung LOS (Line of Sight) dari transmitter. Oleh karena bahan piezoelektrik memiliki reaksi yang reversible, elemen keramik akan membangkitkan tegangan listrik pada saat gelombang datang dengan frekuensi yang resonan dan akan menggetarkan bahan piezoelektrik tersebut.
Gambar 3. Rangkaian receiver sensor ultrasonik
Sensor HC-SR04 digunakan untuk mengukur jarak benda dari 2cm - 4m dengan akurasi 3mm. Alat ini memiliki 4 pin, pin Vcc, Gnd, Trigger, dan Echo. Pin Vcc untuk listrik positif dan Gnd untuk ground-nya. Pin Trigger untuk trigger keluarnya sinyal dari sensor dan pin Echo untuk menangkap sinyal pantul dari benda. Cara menggunakan alat ini yaitu: ketika kita memberikan tegangan positif pada pin Trigger selama 10uS, maka sensor akan mengirimkan 8 step sinyal ultrasonik dengan frekuensi 40kHz. Selanjutnya, sinyal akan diterima pada pin Echo. Untuk mengukur jarak benda yang memantulkan sinyal tersebut, maka selisih waktu ketika mengirim dan menerima sinyal digunakan untuk menentukan jarak benda tersebut. Rumus untuk menghitungnya sudah saya sampaikan di atas. Sistem pewaktu sensor HC-SR04 dapat diamati pada Gambar 5.
5 Modul pembaca ketinggian air ini terdiri dari sensor HC-SR04 dan rangkain elektronika. Untuk daya yang dibutuhkan dalam mengakt\ifkan modul menggunakan baterai. Pada area yang jauh dari pusat pemantuan, daya untuk mengaktifkan modul menggunakan adaptor yang listriknya tersambung langsung daya pada lampu, karena modul tersebut menempel atau di topang oleh tiang lampu penerangan umum. Modul tersebut dibungkus dengan kotak yang di desain khusus untuk alat tersebut dan berbahan alumunium. Untuk menghindari adanya konsleting pada sensor jika terkena air hujan, bagian atas kotak modul akan dipayungi lagi dengan lapisan yang permukaannya lebih lebar dari kotak modul sehingga air hujan tidak langsung turun ke modul.
2.2.2. Modul Pengirim data
Untuk pengiriman data dari seluruh modul ke pusat, maka pada modul ditambahkan arduino seri Node MCU atau modul GSM jika tidak tersedia wifi di area tempat modul di pasang. 2.2.3 Pengolah data center berbasis web
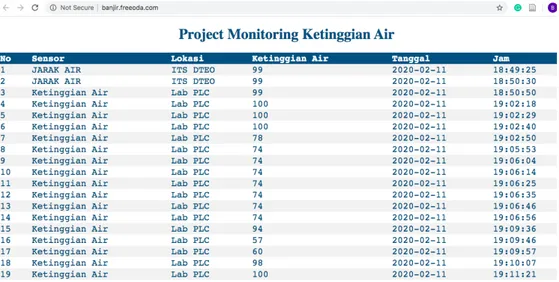
Data yang diterima oleh masing-masing modul secara otomatis akan tersimpan di database php my admin. Kemudian data tersebut dapat ditampilkan langsung ke halaman web sehingga mudah dipantau baik dari pusat atau di berbagai tempat. Pada penelitian yang sebelumnya, data kami telah berhasil tersimpan ke dalam database php my admin, namun untuk tampilan websitenya masih belum terarah dan kurang informatif, hanya menampilkan data apa adanya tanpa diolah terlebih dahulu. Selain itu, pengiriman data pada database dilakukan oleh modul setiap lima detik sekali hal ini membuat sistem database menjadi sibuk dan mudah error.
Gambar 5. Tampilan website yang telah dicapai masih menampilkan data apa adanya tanpa normalisasi
Pada penelitian yang diusulkan, kami akan memperbaiki tampilan website sehingga lebih informatif dan mudah dipelajari. Selain itu untuk update atau pengiriman data ketinggian air masing-masing modul ke pusat database akan dilakukan selama lima menit sekali untuk menghindari adanya buffer over flow pada database server yang justru mengakibatkan tersendatnya layanan informasi pada web, memberatkan pengiriman data, serta membuat traffic jaringan menjadi
sibuk jika modul yang dipasang lebih dari 200 modul dan melakukan pengiriman data ketinggian air secara bersamaan.
BAB III STATUS LUARAN
7 1. prototype yang sudah jadi,
2. paper Q1 dalam status under review,
BAB IV KENDALA PELAKSANAAN PENELITIAN
Kendala Pelaksanaan Penelitian, kesulitan atau hambatan yang dihadapi selama melakukan penelitian dan mencapai luaran yang dijanjikan adalah pada masa pandemi kurangnya data yang diteliti dan tenaga asisten peneliti.9
BAB VI RENCANA TAHAPAN SELANJUTNYA
Menyelesaikan paper Q1 hingga diterima.BAB VII DAFTAR PUSTAKA
American Society of Civil Engineers and the Water Pollution Control Federation, (1969)
Design and Construction of Sanitary and Storm Sewers.
Arshad, B., Ogie, R., Barthelemy, J., Pradhan, B., Verstaevel, N., & Perez, P. (2019). Computer Vision and IoT-Based Sensors in Flood Monitoring and Mapping: A Systematic Review. Sensors, 19(22), 5012.
Ginting, S. (2014). Sistem peringatan dini banjir Jakarta. Jurnal Sumber Daya Air, 10(1), 71-84.
Mohamed, A. R. A., & Wei, W. G. (2014). Real time wireless flood monitoring system using ultrasonic waves. Int. J. Sci. Res, 3(8), 100-103.
Noar, N. A. Z. M., & Kamal, M. M. (2017, November). The development of smart flood monitoring system using ultrasonic sensor with blynk applications. In 2017 IEEE 4th International Conference on Smart Instrumentation, Measurement and Application (ICSIMA) (pp. 1-6). IEEE.
Rahayu, H. P., & Nasu, S. (2010). Good Practices of Enhancement Early Warning System for High Populated Cities: A Case Study for Jakarta Flood.
Sabre, M. S. M., Abdullah, S. S., & Faruq, A. (2019). Flood warning and monitoring system utilizing internet of things technology. Kinetik: Game Technology, Information System, Computer Network, Computing, Electronics, and Control, 4(4), 287-296.
Satria, D., Yana, S., Munadi, R., & Syahreza, S. (2017). Prototype of Google Maps-Based Flood Monitoring System Using Arduino and GSM Module. Int. Res. J. Eng. Technol, 4(10), 1044-1047.
Susetyo, C. (2008, March). Urban flood management in Surabaya City: anticipating changes in the Brantas River system. ITC.
Umboro Lasminto, (2015), Evaluasi Genangan Kota Surabaya, Posiding Seminar Nsional Aplikasi Teknologi Prasarana Wilayah (ATPW), Surabaya
11
BAB VIII LAMPIRAN
Lampiran berisi tabel daftar luaran (Format sesuai lampiran 1) dan bukti pendukung luaran wajib dan luaran tambahan (jika ada) sesuai dengan target capaian yang dijanjikan
LAMPIRAN 1 Tabel Daftar Luaran
Program : Unggulan
Nama Ketua Tim : Umboro Lasminto
Judul : Sistem Monitoring Genangan Real Time
Terintregrasi di Perkotaan Sebagai Upaya Mitigasi Banjir Berbasis Sensor HC-SR04 dan IoT 1.Artikel Jurnal
No Judul Artikel Nama Jurnal Status
Kemajuan*)
1 Deep LSTM Recurrent
Neural Network for Sensor Maintenance Prediction in Smart City Application
ESwA (Q1)
https://www.journals.elsevier.com/expert-systems-with-applications
Under review
*) Status kemajuan: Persiapan, submitted, under review, accepted, published 2. Artikel Konferensi
No Judul Artikel Nama Konferensi (Nama Penyelenggara, Tempat, Tanggal) Status Kemajuan*) 1 Numerical Investigation Of Tsunami Impact In Newly Developed
International Conference of Sustainable Earth Resources Engineering 2020 (SERiES2020) https://eras.ump.edu.my/index.php/en/series2020
Telah
dipresentasikan
*) Status kemajuan: Persiapan, submitted, under review, accepted, presented 3. Paten
No Judul Usulan Paten Status Kemajuan
1 Sistem monitoring mitigasi banjir terintegrasi Draft siap submit *) Status kemajuan: Persiapan, submitted, under review
4. Buku
No Judul Buku (Rencana) Penerbit Status Kemajuan*)
*) Status kemajuan: Persiapan, under review, published 5. Hasil Lain
13 1 Device pemantau banjir Sudah jadi
*) Status kemajuan: cantumkan status kemajuan sesuai kondisi saat ini 6. Disertasi/Tesis/Tugas Akhir/PKM yang dihasilkan
No Nama Mahasiswa NRP Judul Status*)
LAMPIRAN Bukti Luaran
Lampiran 1. Status luaran wajib under review pada jurnal Q1
Luaran wajib saat ini dalam status under review pada jurnal Expert System with Application (ESwA), impcat factor 5,452, H index 187
Elsevier Editorial System(tm) for Expert Systems With Applications or its open access mirror
Manuscript Draft
Manuscript Number: ESWA-D-20-03532
Title: Deep LSTM Recurrent Neural Network for Sensor Maintenance Prediction in Smart City Application
Article Type: Full length article
Keywords: Deep RNN; LSTM; Smart City; Sensor; IoT; Big Data Corresponding Author: Mrs. Berlian Al Kindhi, Ph.D
Corresponding Author's Institution: Institut Teknologi Sepuluh Nopember First Author: Berlian Al Kindhi, Ph.D
Deep LSTM Recurrent Neural Network for Sensor
Maintenance Prediction in Smart City Application
Berlian Al Kindhia,∗
aElectrical Automation Engineering Department, Institut Teknologi Sepuluh Nopember, Surabaya, Indonesia
Abstract
The sensor is one of the important components in the application of smart city, with sensors, surrounding phenomena that can previously be studied manually can be studied and recorded automatically, even the reading of the data can be reported remotely using IoT. However, the use of sensors also requires regular maintenance, to avoid sensor failure, time, and cost-efficiency. For smart city, sensor maintenance is a job that must be scheduled properly. In this study, we propose an application center that can predict sensor performance to prevent sensor failure and sensor maintenance scheduling based on sensor conditions. We compare the advantages of the Recurrent Neural Network (RNN) method with the RNN method using the Long Short-Term Memory (LSTM) architecture. The training data we used were 440,500 records coming from 2 sensors with test data is sensor data for one month. The RNN and LSTM-RNN architecture was tested with several hidden layer combinations between 60 to 80 and epoch values between 50 and 60. From these combinations, LSTM-RNN with four shapes, each consisting of 70 hidden layers and 60 epochs have the results best predictions. From the test results, LSTM-RNN has the ability to predict sensor performance better than RNN with an average relative error of 0.0011 or accuracy 99.89%, and minimum loss is 0.0069.
Keywords: Deep RNN, LSTM, Smart City, Sensor, IoT, big data
1. Introduction
A city can be called a smart city if it has integrated information and communication technology in its daily governance and operational processes (Peňaška & Veľas, 2019). The integration of these technologies is intended to improve efficiency, share information with the public, to improve services to the community, or improve the welfare of citizens (Ahad, Paiva, Tripathi, & Feroz, 2020) (Hadi Zahmatkesh, 2020). The implementation of smart cities in different cities can be different according to the priority needs of the city (Pašalić, Ćukušić, & Jadrić, 2020) (Yigitcanlar, Han, Kamruzzaman, Ioppolo, & Sabatini-Marques, 2019).
In smart cities concept, automation and IoT can be important components in realizing the integration and mitigation problems of an area (Desikan, Kotagi, & Murthy, 2020). Automation that is equipped with IoT can provide information in real-time which can then be analyzed into a policy (Li, Deng, Liu, & Su, 2020). IoT devices are able to send information and follow up through networks with minimal human intervention so that they can perform a variety of functions automatically (Kumar, J., Shetty, Roy, & Sitaram, 2020). Installation of sensors in many corners of the city will provide information about the phenomena that occur around the sensor. Data obtained from the sensor can be sent to the center via IoT (Rathore, et al., 2018). The results of the sensor data processor can be used for analysis, prediction, and decision
*Corresponding author
Email address: [email protected] (Berlian Al Kindhi)*,
Manuscript
as to the application of smart governance (Bibri, 2018).
The sensor is an electronic component that functions to convert mechanical, magnetic, heat, light, and chemical quantities into electricity in the form of voltage, resistance, and electric current (Adam, Anisi, & Ali, 2020). Sensors are often used for detection when measuring or controlling. Sensor is a device that serves to detect signals originating from changes in energy such as electrical energy, physical energy, chemical energy, biological energy, mechanical energy and so on.
Smart lighting is one example of the application of the smart city concept, namely street lighting or public places that are equipped with sensors. The sensor can measure power on the lamp for which the data is used to check whether the lamp is on (functioning properly). In addition, light sensors can also be applied to smart lighting so that lights can turn on automatically when the surrounding conditions start to get dark.
In detecting the phenomenon of the surrounding environment, sensors require electrical power. The power can be obtained by direct electricity lines connected throughout the city. In addition, electrical power can also be obtained by adding solar panel modules to the installed device which is then connected to the battery. In the case of sensors that use battery power, there are times when the solar panel does not receive enough sunlight, so it is unable to fully charge the battery. If it runs out of power, the sensor will turn off and cannot send data in real-time to the server application. Therefore, in addition to processing data for policy analysis, data processing for optimizing the maintenance process is also required. The process of scheduling sensor maintenance must be done appropriately so that workers in the field can prioritize maintenance on sensors that really need to be repaired. The data sent can be in the form of battery power capacity, the condition of the sensor that is on or not, and whether the sensor regularly updates the data in accordance with the specified time or the sensor experiences problems.
In this study, we proposed smart application of Deep Learning using Recurrent Neural Network (RNN) time series prediction with data
calling using Long Short-Term Memory (LSTM) to predict sensor performance with the results is an analysis of sensor priority recommendations that need treatment. The trial data in this study were 20 ultrasonic sensors equipped with GSM modules to transmit data periodically. To detect the battery capacity, two sensors are used, namely the voltage sensor and the current sensor which are used to detect the flow of voltage and current in the battery. We predict sensor performance for the next few days, so we use machine learning time series prediction modeling (Zheng, et al., 2019). Data received by the server is then processed using the Deep Recurrent Neural Network (RNN) (Jin, Li, & Hu, 2018) method with Long Short-Term Memory (LSTM). The results of this system is a reference for the route or sequence of care for workers in the field. We compare the performance of the RNN architecture with the RNN architecture that uses LSTM.
2. Literature Study
There are many sensors that produce output signals that change continuously in response to inputs that change continuously (Ando, 1997). In cases like this, it is usually to know exactly how the change in output compares with the input in the form of a graph. Sensitivity will show how far the sensor's sensitivity to the quantity measured (Weiss, Itzke, Reitenspieß, Hoffmann, & Weigel, 2019). Sensitivity is often expressed by numbers that indicate "change in output compared to a unit change in input". Sensor linearity also affects the sensitivity of the sensor. If the response is linear, the sensitivity will also be the same for the overall measurement range (Geng, Li, Tan, Deng, & Yu, 2011). The response time on the sensor shows how fast the response is to changes in input. Frequency is the number of cycles in one second and is given in units of hertz (Hz), 1 hertz means 1 cycle per second, 1 kilohertz means 1000 cycles per second.
The use of sensors in observing the surrounding phenomena becomes easier with the application of IoT (Zhou, Yang, Nguyen, Sun, &
Grattan, 2014). Internet of Things (IoT) is a concept where an object has the ability to transfer data through a network without requiring
human-to-human or human-computer interaction. IoT has evolved from the convergence of wireless technology, microelectromechanical systems (MEMS), and the Internet (Song & Zheng,
2018). Data read by the sensor can automatically be sent periodically. The data transmission can be done by adding wireless or GSM modules to the Arduino module connected to the sensor.
Sending data on sensors with internet media must also be balanced with adequate internet network infrastructure. Internet availability in all smart city areas and good network quality is a separate research topic in the smart city concept. Hierarchical network design and data flow need to be carried out in a measurable study(Costa &
Oliveira, 2020). Important sensor data can be arranged as a priority for data transmission, or stakeholders who carry out data processing can be given greater bandwidth access. The design of the network quality can be done by the Quality of Service (QoS) method (Vermeulen, et al.,
2004). Whereas to differentiate network services according to their needs, the QoS method can be supplemented by the Differentiated Service (DiffServ) method (Veres & Ionescu, 2007)
(Yang, Ye, & Papavassiliou, 2004).
Another aspect that needs to be addressed also in the application of IoT for sending sensor data is a network security and data protection
(Vitunskaite, He, Brandstetter, & Janicke, 2019). The process of sending data from the sensor to the server address must be monitored in terms of security. The paths that are traversed and the routers that are traversed must have security standards (Rathore, et al., 2018). Some of the initial security measures that must be owned by a network system include firewalls and proxies.
Network systems can use a VPN (Virtual Private
Network) networks for safer networks by adding encryption methods to each data transmission. One of the impacts of an insecure network on sending sensor data is the hacking of sensor data which results in the central application processing fake data unnoticed (Jeong, Kim,
Shin, Park, & Sim, 2020).
With the application of IoT, sensor observations that previously could only be done locally can now be done remotely, centrally, and integrated with each other (Yadav & Vishwakarma, 2018). Sensors can be widely installed in several areas that are needed for
monitoring. Data from sensor readings that are sent periodically can be processed in the data bank as input features in machine learning
(Bellavista, Ota, Lv, Mehmood, & Rho, 2020). The results of machine learning can be in the form of analysis, decision support, and even prediction of a phenomenon.
In processing big data, machine learning is widely used to provide decision support
(Vuppalapati, Ilapakurti, & Kedari, 2016). In this study, we conducted the processing of big data derived from sensor readings scattered in several parts of the city and reported periodically automatically. The data streaming that we get is used to process and predict sensor performance to avoid sensor failure and to make sensor maintenance a priority. One prediction method that is often used for consecutive time data is the RNN (Wei, Liu, Gao, Wang, & Yue, 2019)
(Yang, Jiang, & Guo, 2019). To avoid vanishing gradients we use the LSTM architecture in the application of RNN (Gers, Schmidhuber, &
Cummins, 2000).
3. Methodology and system development The dataset we used in this study was 220,250 training data records that came from recording sensors regularly and sent to the database server. The sensor module that we use is a light sensitivity sensor (which is used to detect illumination around public lighting) and a liquid level sensor (which is used to measure the height of a puddle in a place). The total training data that we process from the two sensors is 440,500 records. For test data we take 31 data records from the last sensor report every day in one month.
3.1. Sensor module development
The hardware module consists of several sensor components that are interconnected. In this research, we apply the priority maintenance method that we propose in integrated sensor applications. One of our data set is flood mitigation applications. Flood mitigation applications are sensors and other devices used to measure the height of standing water when it rains. In tropical countries, during the rainy season, the intensity of rainfall can be very high which results in inundation which then becomes
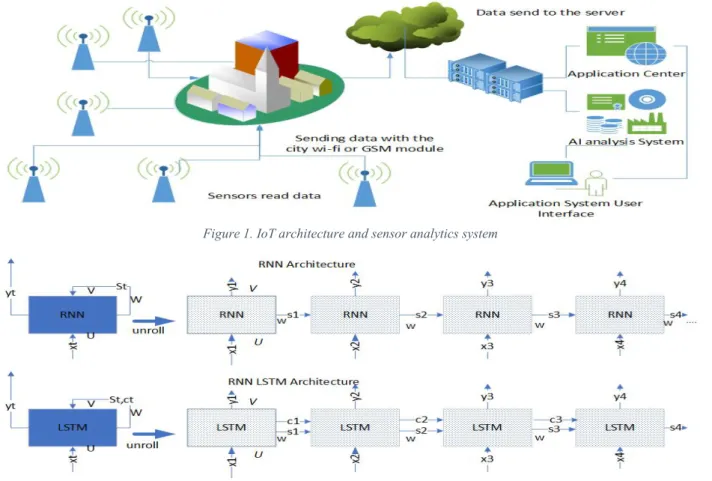
Figure 1. IoT architecture and sensor analytics system
Figure 2. Comparison of RNN architecture with LSTM-RNN architecture
Figure 3. Sensor module architecture
a flood. This sensor is installed in several areas in the city so that water levels can be monitored in real-time, we discuss the research on flood mitigation in a different paper.
In addition to data on water levels, the hardware module also sends voltage and current data through the measurement of voltage sensors and current sensors. We set the sensor to reread every 10 minutes. Data from the reading results are sent directly to the application server IP using an IoT device which is also installed on the hardware module that is built. The hardware circuit in the system built can be observed in Fig. 3.
The GSM module is used to transmit sensor readings data on a regular basis. Several types of sensors can be installed in one area. These sensors have different functions but are integrated and sent to the same server. So that the data from the sensor can be recognized and distinguished, in sending data from the GSM module, the sensor will add a unique code so that when entered into the database system will be inputted in accordance with the table provided for the sensor. The design of the IoT data transmission for each sensor can be observed in Fig. 1.
3.2. Development of central applications
The results of reading sensor data that are sent periodically will be processed by the server application and then analyzed and the prediction results are obtained. The prediction results are in the form of decision support for making sensor maintenance routes that are spread throughout all parts of the city. The route or sequence of sensor maintenance trips is based on the predicted results of the priority level of maintenance on the sensor. This maintenance route is used by field staff to carry out maintenance directly at the sensor location.
In addition to the main sensor data needed for smart city applications (for example light sensors
for lights), data from current and voltage sensors are also sent to predict the sensor's performance. Current and voltage data will be used as input features in the deep RNN LSTM. Sequential data has the characteristics in which samples are processed in a sequence (for instance time), and a sample in the sequence has a close relationship with one another. RNN is a neural network method that returns the calculation of hidden neurons to be reactivated and analyzed for error values. RNN provides good prediction results on data that have time attributes or time series prediction. The RNN processes inputs sequentially, sample by sample. In each processing, the output produced is not only a function of the sample, but also based on the internal state which is the result of processing the samples before, or afterward, on the bidirectional RNN. The different between RNN and LSTM-RNN architecture can be observed in Fig. 2.
The RNN architecture that we use in this study is the Feed Forward architecture. Each 𝑥𝑥𝑡𝑡 input sample is represented as a vector. For each time step t, we first calculate the 𝑆𝑆𝑡𝑡 state of the input (𝑥𝑥𝑡𝑡) and the previous state (𝑥𝑥𝑡𝑡−1), each multiplied by the U and W parameters, and then processed with the tanh activation function on Eq. 1.
𝑆𝑆𝑡𝑡= tanh (𝑈𝑈 ∙ 𝑥𝑥𝑡𝑡+𝑊𝑊 ∙ 𝑠𝑠𝑡𝑡−1) (1)
The output from 𝑆𝑆𝑡𝑡 is then calculated output 𝑦𝑦�𝑡𝑡
by multiplying by parameter V and skipping the softmax activation function, the formulation can be describe on Eq. 2.
𝑦𝑦�𝑡𝑡= 𝑠𝑠𝑠𝑠𝑠𝑠𝑠𝑠𝑠𝑠𝑠𝑠𝑥𝑥(𝑉𝑉 ∙ 𝑆𝑆𝑡𝑡) (2)
For each sample at each time step, the loss function is defined in Eq. 3.
ℒ𝑡𝑡(𝑦𝑦𝑡𝑡,𝑦𝑦�𝑡𝑡) =−𝑦𝑦𝑡𝑡𝑙𝑙𝑠𝑠𝑙𝑙𝑦𝑦�𝑡𝑡 (3)
So, for an input, the loss function is: ℒ(𝑦𝑦,𝑦𝑦�) =−𝑇𝑇1
𝑥𝑥∑ 𝑦𝑦𝑡𝑡𝑙𝑙𝑠𝑠𝑙𝑙𝑦𝑦�𝑡𝑡
𝑡𝑡𝑥𝑥
𝑡𝑡=1 (4)
The 𝑇𝑇𝑥𝑥 symbol represents the number of
samples in the input, so the calculation on Eq. 4 is basically adding up the prediction error from each sample in the input.
On a Neural Network (NN) that has many layers, it is difficult for the nodes in the layer at the beginning of the NN to "learn" from changes in 𝑦𝑦�, because the gradient arising from changes in 𝑦𝑦� will gradually decrease, and finally becomes very small near-zero or is said to "disappear" when it arrives at the initial layers of NN. This is caused by the multiplication properties between fractions. This value will decrease exponentially, and with a small fractional value and many multiplication operations, the value will be close to zero. Conversely, if the gradient value is large, it will cause another problem, namely the "exploding gradient" value. But this problem is easier to handle, for example by applying an upper limit to the gradient value. The number of layers in an RNN can be very long, as many as the number of rows in the input, and this poses a problem because RNN often has to save from suitable inputs quite far apart. To overcome this problem, in this study we applied the Long Short-Term Memory (LSTM) architecture.
LSTM is a type of Recurrent Neural Network (RNN) where modifications are made to the RNN by adding a memory cell that can store information for a long time. LSTM is proposed as a solution to overcome the vanishing gradient on RNN when processing long sequential data. LSTM is a type of processing module for RNN created by (Hochreiter & Schmidhuber, 1997) and later developed and popularized by many researchers. Like RNN, the LSTM network also consists of modules with repetitive processing. The LSTM module (one green box) has different processing from the usual RNN module, as can be seen in Fig. 4. Another difference is that there are additional signals given from the one-time step to the next time step, the memory cell, represented by the symbol 𝐶𝐶𝑡𝑡 .
In LSTM, we use the path that connects the old memory cell (𝐶𝐶𝑡𝑡−1) to the new memory cell
(𝐶𝐶𝑡𝑡) at the top of the LSTM module. With this
path, a value in the old memory cell will be easily passed to the new memory cell with a few modifications. A memory cell is a vector, the number of elements of which we determine as LSTM network designers, each element we hope can record a feature from the input, these features will be discovered by the LSTM itself in the training process. In this study, we conducted 4 trials of RNN architecture using LSTM and not
with a different number of memory cells to find out the best architecture.
We also applied sigmoid gate which regulates how much information can pass. For an x input, the output of the sigmoid gate can be observed in Eq. 5, where A is a parameter, b is a bias, both are studied in the training process, and σ is a sigmoid function. The gate output is a number between zero and one; zero means that the information is totally blocked, whereas one means to include the entire information. The output of the sigmoid gate will be multiplied by another value to control how much that value is used, as explained in Eq. 6. With a sigmoid gate, LSTM can adjust how much information from 𝐶𝐶𝑡𝑡−1 is included as 𝐶𝐶𝑡𝑡.
𝑠𝑠𝑠𝑠𝑙𝑙_𝑙𝑙𝑠𝑠 = 𝜎𝜎(𝐴𝐴 ∙+𝑏𝑏) (5) 𝐶𝐶𝑡𝑡 =𝑠𝑠𝑠𝑠𝑙𝑙_𝑙𝑙𝑠𝑠 ∙ 𝑠𝑠 ∙ 𝐶𝐶𝑡𝑡−1 (6)
At LSTM we decide what information will be removed from the memory cell 𝐶𝐶𝑡𝑡−1, using the
sigmoid forget gate (𝑠𝑠𝑡𝑡) gate. This gate reads the
values of 𝑆𝑆𝑡𝑡−1and 𝑋𝑋𝑡𝑡, and produces a number
between 0 and 1 for each element in 𝐶𝐶𝑡𝑡−1. A value of 1 means "really take care of this element" while 0 means "completely get rid of this element”, as shown in Eq. 7. Notation
[𝑠𝑠𝑡𝑡−1,𝑥𝑥𝑡𝑡] is an operation to add a line from 𝑥𝑥𝑡𝑡 to
a line from 𝑠𝑠𝑡𝑡−1.
𝑠𝑠𝑡𝑡 =𝜎𝜎(𝑤𝑤𝑓𝑓∙[𝑆𝑆𝑡𝑡−1,𝑥𝑥𝑡𝑡] +𝑏𝑏𝑓𝑓) (7)
The next process is deciding what new information we will use in 𝐶𝐶𝑡𝑡,. This process has
two parts. First, the sigmoid input gate (𝑠𝑠𝑡𝑡)
decides which value to update. Then a 𝑠𝑠𝑠𝑠𝑡𝑡ℎ layer generates a new memory cell vector candidate, (𝐶𝐶̃𝑡𝑡 ). We combined both results to make an
update to the memory cell later., as shown in Eq. 8 and 9.
𝑠𝑠𝑡𝑡 =𝜎𝜎(𝑊𝑊𝑖𝑖 ∙[𝑆𝑆𝑡𝑡−1,𝑥𝑥𝑡𝑡] +𝑏𝑏𝑖𝑖) (8)
𝐶𝐶̃𝑡𝑡 = tanh (𝑊𝑊𝑐𝑐∙[𝑠𝑠𝑡𝑡−1∙ 𝑥𝑥1] +𝑏𝑏𝑐𝑐) (9)
Old memory cells multiply by ft to forget the things that have been decided to forget. The new
memory cell candidate is multiplied by (𝐶𝐶̃𝑡𝑡 ) with
it to decide how much we will include the new memory cell candidate, then we add both, as shown in Eq. 10.
𝐶𝐶𝑡𝑡 =𝑠𝑠𝑡𝑡∗ 𝐶𝐶𝑡𝑡−1+𝑠𝑠𝑡𝑡∗ 𝐶𝐶̃𝑡𝑡 (10)
𝑠𝑠𝑡𝑡= 𝜎𝜎(𝑊𝑊𝑜𝑜∙[𝑠𝑠𝑡𝑡−1,𝑥𝑥𝑡𝑡] +𝑏𝑏𝑜𝑜) (11)
𝑠𝑠𝑡𝑡 = 𝑠𝑠𝑡𝑡∗tanh (𝐶𝐶𝑡𝑡) (12)
The output in this study is based on the value in the memory cell that is passed to a filter. The gate output 𝑠𝑠𝑡𝑡 , is run to decide which parts of the memory cell to produce. To make the value between −1 and 1, the sigmoid gate output is multiplied by the tanh function, so that only the part is decided to become the output, as be shown in Eq. 11 and 12. In this case, the output is the level of performance of the sensor. In the application view, the user interface will display data processing results based on the lowest performance which is the main urgency or priority sensor maintenance.
4. Result and Discussion
The result of the prediction process using LSTM-RNN is the level of sensor performance in the next few days. Basically, during installation, the sensor module has the same capabilities. But over time, for example in a light sensor, if the area where the sensor installation is low-light, the power battery will likely run out faster and also may not be able to receive enough sunlight so that the battery cannot be fully charged. Field staff will immediately go to the location to check battery capacity and other sensor performance.
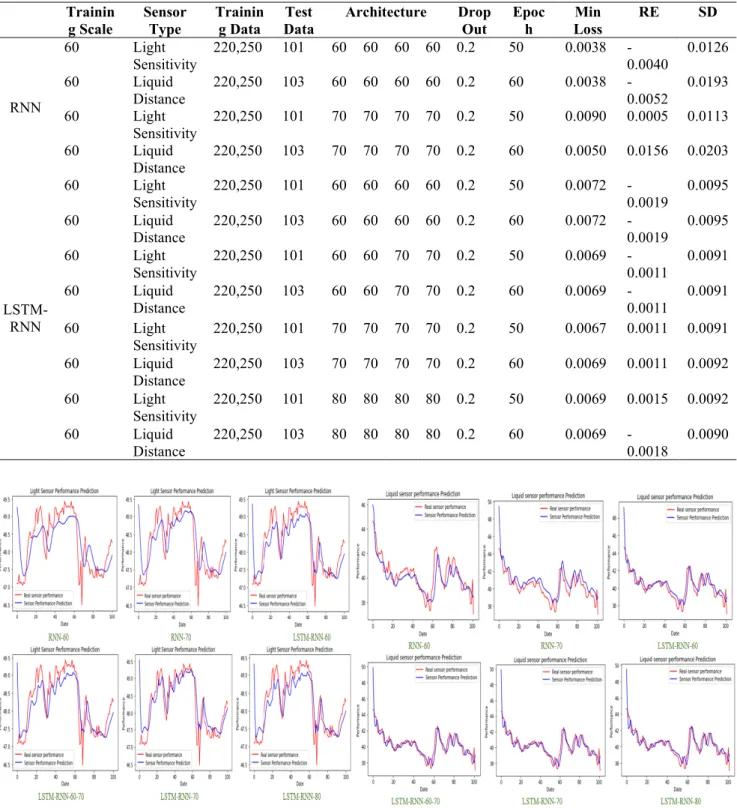
The RNN and LSTM-RNN architectures that we tested can be observed in table 1. Training scale is a data scale for making predictions, so 60 training data will predict the value of the 61st training data, training data 2 to 61 are used to predict the value of the data 62nd training, and so on. The sensor type column describes the type of sensor that we observe its performance, there are two sensors namely Light sensor and Liquid sensor. In each sensor, the number of data sets used is 220,250 records. The number of test data
Table 1. Comparison of minimum loss (Min Loss), accuracy/relative error (RE), and Standard Deviation (SD) of RNN with LSTM-RNN method with different architectures
Trainin
g Scale Sensor Type Training Data Data Test Architecture Drop Out Epoch Loss Min RE SD
RNN 60 Light Sensitivity 220,250 101 60 60 60 60 0.2 50 0.0038 -0.0040 0.0126 60 Liquid Distance 220,250 103 60 60 60 60 0.2 60 0.0038 -0.0052 0.0193 60 Light Sensitivity 220,250 101 70 70 70 70 0.2 50 0.0090 0.0005 0.0113 60 Liquid Distance 220,250 103 70 70 70 70 0.2 60 0.0050 0.0156 0.0203 LSTM-RNN 60 Light Sensitivity 220,250 101 60 60 60 60 0.2 50 0.0072 -0.0019 0.0095 60 Liquid Distance 220,250 103 60 60 60 60 0.2 60 0.0072 -0.0019 0.0095 60 Light Sensitivity 220,250 101 60 60 70 70 0.2 50 0.0069 -0.0011 0.0091 60 Liquid Distance 220,250 103 60 60 70 70 0.2 60 0.0069 -0.0011 0.0091 60 Light Sensitivity 220,250 101 70 70 70 70 0.2 50 0.0067 0.0011 0.0091 60 Liquid Distance 220,250 103 70 70 70 70 0.2 60 0.0069 0.0011 0.0092 60 Light Sensitivity 220,250 101 80 80 80 80 0.2 50 0.0069 0.0015 0.0092 60 Liquid Distance 220,250 103 80 80 80 80 0.2 60 0.0069 -0.0018 0.0090
Figure 4. RNN and LSTM-RNN prediction result for the light sensor is 101 records and the test
data for the liquid sensor is 103 records.
The number of layers we use is four shapes, in each shape, there are a number of hidden neuron architecture that vary between 60 to 80 hidden layers. We tested Epoch for the light sensor 50 times and the liquid sensor 60 times. Our drop out value is 0.2. While the min loss is the smallest error value of all epochs. The accuracy value is obtained by calculating the average of all
distance of predicted number with actual numbers.
In Fig. 4 can be observed that the sensor performance graph can go up and down, it happens because sometimes field officers check the sensor and fully charge the battery so that the battery performance value also goes up. Conversely, sensor data that shows stability is not necessarily due to fieldworkers checking, but solar panels can receive sunlight well and the
Fig. 4 it can be explained that RNN-60 is the RNN method with all four shapes each having 60 hidden layers. RNN-70 is an RNN method that has a hidden layer of 70 on each shape. LSTM-RNN-60 is the LSTM-RNN method with a hidden layers number of 60. LSTM-RNN-60-70 is the LSTM-RNN method whose first two shapes have 60 hidden layers and hidden layers on the third and fourth shapes are 70 layers each. LSTM-RNN-80 is the LSTM-RNN method which has a number of hidden layers of 80 on each of its shapes. The six graphs on the left are the predicted results on the light sensitivity sensor and the 6 graphs on the right are the predicted results on the liquid sensor, according to the title listed above the graph.
From our test results, LSTM-RNN produces prediction values that are closer to real data than RNN, even with the same hidden layer and shape architecture. This proves that RNN by using the LSTM architecture can reduce the risk of vanishing gradient and produce better predictive values. Six different hidden layer architectures can be observed that the greater number of hidden layers does not determine the better results. The value of prediction accuracy increases when the number of hidden layers is combined between 60 and 70 and the value of prediction accuracy gets even better when all hidden layers are set to 70. However, when the number of hidden layers is set to 80 layers, the accuracy of predictions decreases. This is the same for both sensors tested, so it can be concluded that the use of a hidden layer of 70 in each shape is the best combination for this case study.
For both sensors, the prediction results from the liquid sensor have better accuracy than the light sensitivity sensor, this can happen because the liquid sensor data set is well ordered (if we observe in Fig. 4 that the red lines on the liquid sensor graph do not experience the phenomenon of going up and down as sharp as the red line on the light sensitivity sensor chart). But besides that, there is a possibility that a greater number of epochs can help a better learning process so that it can produce good predictions as well. In this study, the number of epochs in our light sensor was set 50 times and the liquid sensor was 60 times.
In the measurement of indeterminate data, the accuracy value can be calculated through the value of relative error ie predictive data (P) reduced by real data (R) then divided by real data. The relative error shows how much the error rate of the method in making predictions. In the system analysis, we calculate the relative error value of each prediction result for each real data, then we calculate the average as shown in Table 1. The RE column, using the formula as in Eq. (13). The - (minus) sign in the RE column indicates that the predicted result is smaller than the real data. To see how much change in relative error data we calculate the standard deviation (SD) value of all relative error values.
𝑅𝑅𝑅𝑅
=
∑𝑛𝑛1(𝑃𝑃−𝑅𝑅𝑅𝑅 )𝑛𝑛 (13) 5. Conclusion
Sensor performance prediction is one of the important things in implementing smart cities. Sensors that are spread in all parts of the city need to be scheduled maintenance. Field staff needs to schedule treatments efficiently by conducting maintenance in the field according to the area and the level of urgency of care. To find out which sensors require priority maintenance needs to be done a prediction analysis of sensor performance. In this study, we tested two sensors dataset namely the light sensitivity sensor for automatic street lighting and the liquid sensor for flood mitigation. We learn and analyze battery capacity data from the movement of changes of current and voltage. The data processed using the RNN and LSTM-RNN methods. The results of the test show that the LSTM-RNN method has better predictive accuracy than the RNN. From our experiment results, the LSTM-RNN method with a hidden layer architecture of 70 on each of the shapes with epochs 60 times produces the best predictive value. The minimum loss value in that architecture is 0.0011 and the average relative error of 0.0011 or accuracy 99.89%.
Acknowledgment
This research is partially funded by the Institut Teknologi Sepuluh Nopember for excellent research grants No. 874/PKS/ITS/2020.
Reference
Adam, M. S., Anisi, M. H., & Ali, I. (2020). Object
tracking sensor networks in smart cities: Taxonomy, architecture, applications, research challenges and future directions. Future Generation Computer Systems, 107, 909-923.
Ahad, M. A., Paiva, S., Tripathi, G., & Feroz, N.
(2020). Enabling technologies and sustainable smart cities. Sustainable Cities and Society, 61, 102301.
Ando, S. (1997). Intelligent sensor systems: integrating advanced automatism and optimality into sensors. Proceedings of International Solid State Sensors and Actuators Conference (Transducers '97). Chicago, IL, USA, USA: IEEE.
Bellavista, P., Ota, K., Lv, Z., Mehmood, I., & Rho,
S. (2020). Towards smarter cities: Learning from Internet of Multimedia Things-generated big data. Future Generation Computer Systems, 108, 879-881.
Bibri, S. E. (2018). The IoT for smart sustainable cities of the future: An analytical framework for sensor-based big data applications for environmental sustainability. Sustainable Cities and Society, 230-253.
Costa, D. G., & Oliveira, F. P. (2020). A prioritization
approach for optimization of multiple concurrent sensing applications in smart cities. Future Generation Computer Systems, 108, 228-243.
Desikan, K. E., Kotagi, V. J., & Murthy, C. S. (2020).
Topology Control in Fog Computing Enabled IoT Networks for Smart Cities. Computer Networks, 176, 107270.
Geng, Y., Li, X., Tan, X., Deng, Y., & Yu, Y. (2011).
High-Sensitivity Mach–Zehnder
Interferometric Temperature Fiber Sensor Based on a Waist-Enlarged Fusion Bitaper. IEEE Sensors Journal, 11(11), 2891 - 2894.
Gers, F. A., Schmidhuber, J., & Cummins, F. (2000).
Learning to Forget: Continual Prediction with LSTM. Neural Computation, 12(10), 2451 - 2471.
Hadi Zahmatkesh, F. A.-T. (2020). Fog computing for sustainable smart cities in the IoT era: Caching techniques and enabling
technologies - an overview. Sustainable Cities and Society, 59, 102139.
Hochreiter, S., & Schmidhuber, J. (1997). Long
Short-Term Memory. Neural Computation, 9(8), 1735-1780.
Jeong, S., Kim, E.-J., Shin, D. H., Park, J.-W., & Sim,
S.-H. (2020). Data fusion-based damage identification for a monopile offshore wind turbine structure using wireless smart sensors. Ocean Engineering, 195, 106728.
Jin, L., Li, S., & Hu, B. (2018). RNN Models for Dynamic Matrix Inversion: A Control-Theoretical Perspective. IEEE Transactions on Industrial Informatics, 14(1), 189 - 199.
Kumar, H. A., J., R., Shetty, R., Roy, S., & Sitaram,
D. (2020). Comparison Of IoT Architectures Using A Smart City Benchmark. Procedia Computer Science, 171, 1507-1516.
Li, D., Deng, L., Liu, W., & Su, Q. (2020). Improving
communication precision of IoT through behavior-based learning in smart city environment. Future Generation Computer Systems, 108, 512-520.
Pašalić, I. N., Ćukušić, M., & Jadrić, M. (2020).
Smart city research advances in Southeast Europe. International Journal of Information Management, 102127.
Peňaška, M., & Veľas, A. (2019). Possibilities of
tracking city indicators in the sense of the Smart city concept. Transportation Research Procedia, 40, 1525-1532.
Rathore, M. M., Paul, A., Ahmad, A., Chilamkurti, N., Hong, W.-H., & Seo, H. (2018). Real -time secure communication for Smart City in high-speed Big Data environment. Future Generation Computer Systems, 83, 638-652. Rathore, M. M., Paul, A., Hong, W.-H., Seo, H. C.,
Awan, I., & Saeed, S. (2018). Exploiting IoT
and big data analytics: Defining Smart Digital City using real-time urban data. Sustainable Cities and Society, 40, 600-610.
Song, M., & Zheng, M. (2018). Energy Efficiency Optimization For Wireless Powered Sensor Networks With Nonorthogonal Multiple Access. IEEE Sensors Letters, 2(1), 7500304.
Veres, S., & Ionescu, D. (2007). A Performance
Model and Measurement Framework for DiffServ Implementations. IEEE Transactions on Instrumentation and Measurement, 56(4), 1473 - 1480.
Vermeulen, B., Wellen, J., Geilhardt, F., Weis, E., Mas, C., Dhoedt, B., & Demeester, P. (2004).
End-to-end QoS resource management for an IP-based DWDM access network. Journal of Lightwave Technology, 22(11), 2592 - 2605.
Vitunskaite, M., He, Y., Brandstetter, T., & Janicke,
H. (2019). Smart cities and cyber security: Are we there yet?A comparative study on the role of standards, third party risk management and security ownership. Computers & Security, 83, 313-331.
Vuppalapati, C., Ilapakurti, A., & Kedari, S. (2016).
The Role of Big Data in Creating Sense EHR, an Integrated Approach to Create Next Generation Mobile Sensor and Wearable Data Driven Electronic Health Record (EHR). 2016 IEEE Second International Conference on Big Data Computing Service and Applications (BigDataService). Oxford, UK.
Wei, X., Liu, Y., Gao, S., Wang, X., & Yue, H.
(2019). An RNN-Based Delay-Guaranteed Monitoring Framework in Underwater Wireless Sensor Networks. IEEE Access, 7, 25959 - 25971.
Weiss, R., Itzke, A., Reitenspieß, J., Hoffmann, I., &
Weigel, R. (2019). A Novel Closed Loop Current Sensor Based on a Circular Array of Magnetic Field Sensors. IEEE Sensors Journal, 19(7), 2517 - 2524.
Yadav, P., & Vishwakarma, S. (2018). Application of Internet of Things and Big Data towards a Smart City. 2018 3rd International Conference On Internet of Things: Smart
Innovation and Usages (IoT-SIU). Bhimtal, India.
Yang, C., Jiang, W., & Guo, Z. (2019). Time Series
Data Classification Based on Dual Path CNN-RNN Cascade Network. IEEE Access, 155304 - 155312.
Yang, J., Ye, J., & Papavassiliou, S. (2004).
Enhancing end-to-end QoS granularity in DiffServ networks via service vector and explicit endpoint admission control. IEE Proceedings - Communications, 151(1), 77 - 81.
Yigitcanlar, T., Han, H., Kamruzzaman, M., Ioppolo, G., & Sabatini-Marques, J. (2019). The making of smart cities: Are Songdo, Masdar, Amsterdam, San Francisco and Brisbane the best we could build? Land Use Policy, 88, 104187.
Zheng, C., Wang, S., Liu, Y., Liu, C., Xie, W., Fang, C., & Liu, S. (2019). A Novel Equivalent
Model of Active Distribution Networks Based on LSTM. IEEE Transactions on Neural Networks and Learning Systems, 30(9), 2611 - 2624.
Zhou, B., Yang, S., Nguyen, T. H., Sun, T., &
Grattan, K. T. (2014). Wireless Sensor Network Platform for Intrinsic Optical Fiber pH Sensors. IEEE Sensors Journal, 14(4), 1313 - 1320.
_______________________________________________________________________________________________
Ref: SERiES2020/AA/069 Date: 27th November 2019
DR SATRIA DAMARNEGARA
Institut Teknologi Sepuluh Nopember Departemen Teknik Sipil,
Kampus ITS Sukolilo 60111 Surabaya Indonesia
Dear Dr Satria Damarnegara
ACCEPTANCE OF ABSTRACT
I am pleased to inform you that the following abstract: Paper ID: SERiES069
Title: Numerical Investigation Of Tsunami Impact In Newly Developed Tourism Coast, Case Study: Melasti Beach (Paper ID: SERiES069) has been accepted for ORAL presentation at the International Conference of Sustainable Earth Resources Engineering 2020 (SERiES2020) which will be held at the Everly Hotel, Putrajaya, Malaysia on April 6 and 7, 2020. Please use the given paper ID for any future correspondence.
Please prepare your manuscript according to the template attached. The manuscript will be published in SCOPUS indexed proceeding, IOP Conference Series: Earth and Environmental Science after peer review process. Selected 50 papers will be published in the ISI indexed journal, Physics and Chemistry of the Earth (Special Issue).
Thank you Yours Sincerely
Dr Jacqueline Isabella Anak Gisen Secretary
International Conference of Sustainable Earth Resources Engineering 2020 (SERiES2020) Earth Resources and Sustainability Center
Universiti Malaysia Pahang
Numerical Investigation of Tsunami Impact in Newly
Developed Tourism Coast, Case Study: Melasti Beach
S Damarnegara1, B Winarta2, Fuddoly1 And B Sarwono1
1 Department of Civil Engineering, Institut Teknologi Sepuluh Nopember, 60111 Surabaya, Indonesia
2 Department of Water Resources Engineering, Brawijaya University, 65145 Malang, Indonesia
E-mail: [email protected]
Abstract. Southern part of Indonesia is vulnerable to earthquakes and tsunamis, especially in the coastal area. Bali as one of tourist attraction in Indonesia, still developing and opening a new beach attraction. One of newly developed beach is Melasti beach located in the southern part of Bali. In order to understand and mitigate the impact of tsunami wave, a numerical model is developed using a hypothetical tsunami waves based on previous tsunami history and earthquake potential. A detailed model in the location of interest also developed to have a detailed pattern of tsunami propagation. The simulation is done based on shallow water equation (SWE) using open source code DELFT3D with the tsunami wave generation calculated using Delftdashboard toolbox.The model shows the depression waves arrives after 29 minutes after the earthquake followed by tsunami waves after 3 minutes from depression waves. It is important to do a detailed model to understand the tsunamis pattern and vulnerable places for preparing the mitigation.
1.Introduction
The southern part of Indonesia is known vulnerable to tectonic tsunami caused by the Java Megathrust. Historically, two major tsunamis occurred in south coast of java within 25 years; one in Banyuwangi on 1994 from 7.8 Mw (Moment magnitude) which caused casualties of at least 215 peoples and on 2006 in Pangandaran beach caused by 7.7 Mw which caused casualties of at least 668 peoples. Even though no major tsunamis event recorded in southern coast of Bali, there is a high potential of earthquake reaching 9.0 Mw based on assessment by Pusat Studi Gempa Nasional [1] as seen in figure 1.
The southern coast of Bali island might be naturally protected because of its topographic condition. It is dominated with steep cliff and rarely inhabited. However, tourism development has increased new attraction and accommodation. Some of them are new beach which located under the cliff such as Pandawa Beach and Melasti Beach (figure 2). This development will increase the risk of tsunami which need to be addressed carefully to develop a proper mitigation.
Numerical model has become a standard tool to investigating tsunami hazard worldwide. It made a good prediction of tsunami time of arrival and peak of the wave height. However, in order to quantifying the hazard, a detailed local model is necessary to understand the extent of tsunami depth and inundation area. This development is challenging in term of data availability and modelling techniques. In order to develop a detailed model, detailed terrain data is needed which is not always available in a developed country. The model also needs to consider the computational resources available that need a compromise between accuracy and computational time.
in order to obtain a good result. it is necessary to have a high-resolution topography data and good representation of bed roughness.
In this paper, a detailed local model is developed to assess the tsunami hazard in newly developed Melasti Beach. The model is done using DELFT3D [5] an open source non-linear shallow water equation solver. A dam break in sloping beach case is also analyzed in order to understand the model capabilities and limitation. The tsunami wave is generated using delftdashboard, a MATLAB based open source tools which simplify modeling procedure.
2.Model Description
The numerical model is called DELFT3D [5] which solves a non-linear shallow water equation. Using hydrostatic assumption, the governing equation solve the continuity equation:
∇ ∙ 𝒖 = 0 (1)
The kinematic boundary condition for free surface and the bed are describe as:
*+ *,+ . /00 /11 *( 23+ 4 /11) *5 + . /00 /11 *( 23+ 6 /00) *7 = 𝑑 + 𝜁 𝑄 (2)
With U and V are the depth averaged velocities for velocity vector u, d is the depth below reference level, 𝜁 is the free surface elevation from reference level. 𝐺55 and 𝐺77 is correction term for curvilinear coordinate. Where 𝜉 and 𝜂 are the spatial direction of curvilinear system respectively. The momentum equation for 𝜉 and 𝜂 direction is given by:
*> *,+ > /00 *> *5+ ? /11 *> *7− ?A /00 /11 * /11 *5 + >? /00 /11 * /00 *7 − 𝑓𝑣 = − . DE /00𝑃5 + 𝐹5+ 𝑀5 (3) and *? *,+ > /00 *? *5+ ? /11 *? *7+ >? /00 /11 * /11 *5 + ?A /00 /11 * /00 *7 − 𝑓𝑢 = − . DE /11𝑃7+ 𝐹7+ 𝑀7 (4)
𝑃5,7 is the pressure gradient, 𝐹5,7is force due Reynold stress and 𝑀5,7 is the external force sources.
Delft3D is widely popular and has been validated extensively. The validation document also provided by Deltares.
3.Dam Break on Sloping Beach Experiment
Despites of its popularity and documented validation, in order to reassure the model performance, the model is used to simulate an experiment of dam break on a sloping beach based on experiment by Lin et al [6]. The experiment was performed in 13 m long, 25 cm wide and 50 cm high wave flume as seen at figure 3. A servo motor driven gate was installed at 3.759 m from the beginning of the flume and used to release the water instantly. A 1:20 sloping beach made of acrylic sheet is installed at 2.705 m downstream the gate. Four wave gauge is installed with distance of 150 cm upstream of the beach, at the beginning of the beach, 101.7 cm downstream of the beach and the last one at 194 cm downstream of the beach.
The numerical model set up using two grid size, coarse grid of 2.5 cm and finer grid of 1.25 cm, uniformly for x and y direction. The roughness coefficient of 0.012 is used for acrylic bottom. The time
to do a detailed model to understand the tsunamis pattern and vulnerable places for preparing the mitigation.
6.Reference
[1] Nasional PS. Peta sumber dan bahaya gempa Indonesia tahun 2017. Pusat Penelitian dan Pengembangan Perumahan dan Permukiman, Badan Penelitian dan Pengembangan, Kementerian Pekerjaan Umum; 2017.
[2] Wijetunge JJ, Wang X, Liu PL. Indian Ocean Tsunami on 26 December 2004: numerical modeling of inundation in three cities on the south coast of Sri Lanka. Journal of Earthquake and Tsunami. 2008 Jun;2(02):133-55.
[3] Gayer G, Leschka S, Nöhren I, Larsen O, Günther H. Tsunami inundation modelling based on detailed roughness maps of densely populated areas. Natural Hazards and Earth System Sciences. 2010 Aug 1;10(8):1679.
[4] Griffin J, Latief H, Kongko W, Harig S, Horspool N, Hanung R, Rojali A, Maher N, Fuchs A, Hossen J, Upi S. An evaluation of onshore digital elevation models for modeling tsunami inundation zones. Frontiers in Earth Science. 2015 Jun 30;3:32.
[5] Deltares DF. User manual. (2014). Simulation of multi- dimensional hydrodynamic flows and transport phenomena, including sediments.
[6] Lin C, Wong WY, Kao MJ, Yang J, Raikar RV, Yuan JM. Hydrodynamic Features of an Undular Bore Traveling on a 1: 20 Sloping Beach. Water. 2019 Aug;11(8):1556.
[7] Stelling GS, Duinmeijer SA. A staggered conservative scheme for every Froude number in rapidly varied shallow water flows. International journal for numerical methods in fluids. 2003 Dec 30;43(12):1329-54.
[8] Okada Y. Surface deformation due to shear and tensile faults in a half-space. Bulletin of the seismological society of America. 1985 Aug 1;75(4):1135-54.
Acknowledgments
Authors wishing to acknowledge support from Laboratory of Hydraulic and Coastal Engineering, Civil Engineering Department Institut Teknologi Sepuluh Nopember
16
1
Deskripsi
SISTEM MONITORING GENANGAN BANJIR REAL TIME TERINTREGRASI Bidang Teknik Invensi
5
Invensi ini mengenai Sistem Monitoring Genangan Banjir Real Time Terintegrasi, lebih khusus lagi, invensi ini berhubungan dengan penyusunan sistem monitoring genangan banjir yang meliputi rancang bangun alat pembaca genangan, pengumpulan data genangan, pengolahan data genangan dan
10
pemetaan genangan yang terintegrasi pada sistem yang berbasis IOT (Internet of Things).
Latar Belakang Invensi
Permasalahan banjir merupakan salah satu permasalahan
15
yang sering terjadi di kota-kota besar di Indonesia. Hal ini muncul disebabkan oleh berbagai faktor, antara lain: perubahan tata guna lahan, curah hujan yang relatif tinggi dan sistem drainase yang tidak mencukupi. Hal ini tentu
memerlukan suatu penanganan yang komprehensif untuk
20
mengurangi dampak yang ditimbulkan oleh genangan tersebut. Hal ini diperparah dengan adanya perubahan iklim akibat pemanasan global, sehingga kota-kota besar di Indonesia diharapkan mampu beradaptasi salah satunya dalam hal pengelolaan banjir dan genangan.
25
Untuk memperoleh suatu solusi adaptif, pendataan pola genangan yang terjadi di lapangan merupakan hal yang penting dan perlu dilakukan. Selama ini, proses pendataan genangan yang ada masih berbasis pencatatan manual, sehingga kedalaman dan luas genangan yang terjadi tidak akurat. Hal
30
ini juga sulit dilakukan, karena keterbatasan akses dan tenaga survei. Sistem ini juga tidak bersifat real time sehingga tidak mencukupi untuk dijadikan dasar dalam
2
pengembangan sistem peringatan dini bencana. Invensi ini akan mengembangkan sistem pemantauan genangan banjir berbasis IOT, yang meliputi: alat pembaca elevasi muka air, sistem pemantauan genangan berbasis web dan sistem pelaporan luas dan kedalaman genangan banjir sebagai bahan evaluasi
5
pemangku kebijakan kota. Alat tersebut dapat di pasang diberbagai daerah di seluruh kota, dimana pada masing-masing sistemnya telah terpasang modul GSM yang dapat memberikan informasi ketinggian air di area tersebut secara real time.
10
Uraian Singkat Invensi
Objek dari invensi sekarang ini adalah berkenaan dengan Sistem Monitoring Genangan Banjir Real Time Terintegrasi, lebih khusus lagi, invensi ini berhubungan dengan penyusunan sistem monitoring genangan banjir yang meliputi rancang
15
bangun alat pembaca genangan, pengumpulan data genangan, pengolahan data genangan dan pemetaan genangan yang terintegrasi pada sistem yang berbasis IOT (Internet of Things).
Alat pembaca elevasi muka air terdiri dari beberapa
20
modul yaitu: sensor ultrasonik HCSR04, modul GSM, NodeMCU, modul power dan motherboard. Elevasi muka air dibaca melalui modul ultrasonik yang selanjutnya dikirimkan ke sistem
pemantauan genangan secara real time dengan menggunakan
modul GSM. Sistem pemantauan genangan berbasis web terdiri
25
dari server dan antarmuka berbasis web untuk menampilkan informasi genangan kepada pemantau kebijakan.
Adapun urutan pemantauan genangan banjir sesuai invensi sekarang ini adalah:
a.Elevasi muka air diukur dengan menggunakan alat
30
pengukur muka air yang memanfaatkan sensor ultrasonik HC-SR04.
3
b.Data pembacaan muka air dikirimkan melalui modul GSM
untuk wilayah yang tidak memiliki jaringan wifi atau NodeMCU untuk wilayah yang memiliki jaringan wifi.
c.Data hasil muka air dikumpulkan pada server pusat untuk
kemudian diolah dan ditampilkan di antarmuka berbasis
5
web.
d....
Uraian Singkat Gambar
Gambar 1, adalah gambar pandangan perspektif dari……(Judul
10
Invensi)……sesuai dengan invensi ini.
Gambar 2, adalah blok diagram ………
Gambar 3, adalah diagram alir (flowchart) ……….dst.
Uraian Lengkap Invensi 15
Invensi ini akan secara lengkap diuraikan dengan mengacu kepada gambar-gambar yang menyertainya.
Mengacu pada Gambar 1, yang memperlihatkan gambar detail
secara lengkap…………(Judul Invensi),
yang terdiri dari………(diuraikan secara lengkap mengacu
20
pada gambar 1).
Mengacu pada Gambar 2, ………(diuraikan secara lengkap
mengacu pada gambar 2)……… dst,……sesuai dengan jumlah
gambar.
Mengacu pada gambar 1 hingga gambar ………(sesuai dengan
25
jumlah gambar)………… ………jelaskan cara untuk melaksanakan
invensi ini.
Dari uraian diatas jelas bahwa hasil dari invensi ini dapat memberi manfaat bagi ……… karena secara
praktis dan efisien ……… (sebagai
30
penutup, atau ungkapkan keistimewaan invensi
benar-4
benar menyajikan suatu penyempurnaan yang sangat praktis
khususnya pada………Judul Invensi).
5 10 15 20 25 30
5
Klaim
1. Suatu (Judul invensi)……….yang terdiri
(1)…………,(2)………, dst, yang
5
dicirikan dengan ………
2. (Judul invensi) sesuai dengan klaim 1,
dimana ………(merupakan klaim turunan dan penjelasan dari yang tercakup pada klaim 1)……….
10
3. (Judul invensi), dst,,,,sesuai dengan jumlah klaim yang
dinginkan.
15
20
25
6
Abstrak
SISTEM MONITORING GENANGAN REAL TIME TERINTREGRASI
Invensi ini mengenai Sistem Monitoring Genangan Banjir
5
Real Time Terintegrasi, lebih khusus lagi, invensi ini berhubungan dengan penyusunan sistem monitoring genangan banjir yang meliputi rancang bangun alat pembaca genangan, pengumpulan data genangan, pengolahan data genangan dan pemetaan genangan yang terintegrasi pada sistem yang
10
berbasis IOT (Internet of Things). Elevasi muka air diukur dengan menggunakan alat pengukur muka air yang memanfaatkan sensor ultrasonik HC-SR04 yang selanjutnya dikirimkan ke sistem pemantauan genangan secara real time dengan menggunakan modul GSM. Sistem pemantauan genangan berbasis
15
web terdiri dari server dan antarmuka berbasis web untuk menampilkan informasi genangan kepada pemantau kebijakan.
20