CAMERA CALIBRATION WITH RADIAL VARIANCE COMPONENT ESTIMATION
B. Mélykuti, E. J. Kruck
GIP, Dr. Kruck & Co. GbR, Platanenweg 24, D-73430 Aalen, Germany - [email protected]
Commission I, WG I/3
KEY WORDS: Camera Calibration, Geometrical Accuracy, Variance Component Estimation, UAV, System Evaluation
ABSTRACT:
Camera calibration plays a more and more important role in recent times. Beside real digital aerial survey cameras the photogrammetric market is dominated by a big number of non-metric digital cameras mounted on UAVs or other low-weight flying platforms. The in-flight calibration of those systems has a significant role to enhance the geometric accuracy of survey photos considerably. It is expected to have a better precision of photo measurements in the center of images then along the edges or in the corners. With statistical methods the accuracy of photo measurements in dependency of the distance of points from image center has been analyzed. This test provides a curve for the measurement precision as function of the photo radius. A high number of camera types have been tested with well penetrated point measurements in image space. The result of the tests led to a general consequence to show a functional connection between accuracy and radial distance and to give a method how to check and enhance the geometrical capability of the cameras in respect to these results.
1. INTRODUCTION
The precision of photo measurements on image surfaces are not even, this has been noted in former publications (Kruck 1985). Deeper analysis of this task was not performed until now because the technology did not exist to allow large number of photo measurements. The development of the matching software allows us to automatically measure large number of points in the images and motivated us to perform a detailed accuracy test. Further argument for testing was the fact that enhanced geometry would greatly benefit both non-metric and semi-metric cameras which are widely used in aerial imagery.
To clarify the definitions and classifications of camera types used in photogrammetry (Kraus, 2007):
Semi-metric cameras are not originally intended for measuring purposes, but which have been developed for photogrammetry even though not all the elements of interior orientation may be stable.
Non-metric cameras, which can be used for low accuracy photogrammetric applications, particularly when supported by modern software packages.
The test based on the Variance Component Estimation. The weights of the different observation series can be checked after adjustment and changed for the next adjustment. The Variance Component Estimation proves the correctness of the weights introduced. The test value, the quotient of the a posteriori standard deviation and the a priori standard deviation, should approach 1.0 for each group of observations. This value is calculated and analyzed separately for the photo measurements according to the radial distances from the image center.
2. DATA PROCESSING
The test was made by BINGO 6.6 adjustment software where a new function an additional variance component test for photo
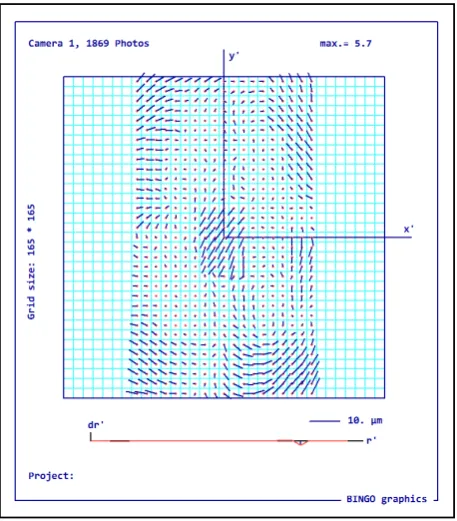
measurements has been introduced. In the program the a posteriori variance-components of photo measurements are calculated for every project and every adjustment run. This function was developed to take the radial distance of the point measurements from the center into account. All point measurements of a project were displayed together on the sensor surface. The total photo area is divided into eight concentric areas. The radial distances are estimated by BINGO to have approximately the same number of photo measurements in each group. In case of a homogenous point distribution the size of all areas are nearly the same. The accuracy of photo measurements in these eight groups have been analyzed. The graphical BINGO tool IMPLO presents all photo measurement distribution in the image space (Fig. 1).
Fig. 1. Distribution of photo measurements in image space
The results can be seen numerically in a list file after the adjustment. In the file there is a Radius for each group, a Number of Points in the group, Redundancy and the Variance
The International Archives of the Photogrammetry, Remote Sensing and Spatial Information Sciences, Volume XL-1, 2014 ISPRS Technical Commission I Symposium, 17 – 20 November 2014, Denver, Colorado, USA
This contribution has been peer-reviewed.
Component test values. These test values are the input for the accuracy test.
A posteriori variance-components of photo measurements as function of photo radius
Group Radius No.Points Redundancy Test Value
Table 1. Part of the BINGO list report file
The criteria for the test projects were the homogenous point distribution and to be free of all systematic remaining effects of the measurements.
3. RESULTS OF THE DIFFERENT CAMERA TYPES 3.1 Results for Aerial Photogrammetric Cameras
In the first step the metric photogrammetric cameras were examined. Metric cameras were separated into three different groups for testing:
o Film cameras
o Digital photogrammetric aerial cameras
o Digital medium format cameras
3.1.1 Film Cameras: The film cameras are not frequently used but for comparison purposes it is very important to analyze these types of cameras as well. Tested were the LMK and RMK cameras. Both of these cameras have a very significant accuracy difference in the function of the radius.
o The functional connection between accuracy and radial distance are close to linear
o The curves of the different cameras have just a slight deviation to each other
o The difference in the accuracy is up to 70% between the center and the edges
Fig. 2 Accuracy as function of radius for LMK/RMK camera types
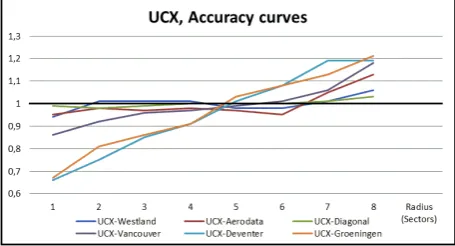
3.1.2 Digital Aerial Photogrammetric Cameras: The digital aerial photogrammetric cameras are the most commonly used cameras for photogrammetric applications. Tested were the DMC and UCX cameras. Compared to the film cameras they have a relatively smaller accuracy differences between the center and the edges and the curves have a higher deviation to each other. These camera systems have a light discrepancy to the lineal curves.
o The functional connection between accuracy and radial distance are near to linear
o The curves of the different cameras have a slightly higher deviation to each other
o The accuracy differences vary from approximately 20% up to 70% calculated between the center and the edges
Fig. 3a Accuracy as function of radius for DMC camera types
Fig. 3b Accuracy as function of radius for UCX camera types
3.1.3 Digital medium format cameras: The digital medium format cameras are widely used today, in this category we tested the Phase One and Rollei cameras.
The accuracy changes between the center and edges are much smaller. One of the reasons could be the smaller sensor size. The curves are spreading higher.
o The functional connection between accuracy and radial distance are linear, at the edges rises slightly
o The curves of the different cameras have a higher deviation to each other
o The accuracy differences vary from approximately 10% up to 50% calculated between the center and the edges
The International Archives of the Photogrammetry, Remote Sensing and Spatial Information Sciences, Volume XL-1, 2014 ISPRS Technical Commission I Symposium, 17 – 20 November 2014, Denver, Colorado, USA
This contribution has been peer-reviewed.
Fig. 4a Accuracy as function of radius for Phase One camera types
Fig. 4b Accuracy as function of radius for Rollei camera types
3.2 Results for Cameras used in UAV, Oblique and Close-Range Applications
3.2.1 Result of Metric Film Cameras in Close-Range Applications: The metric film cameras are not so widely used any more but because of comparison to other systems and testing the effect of different ‘Mean Photo Scale’ were included in the test.
The accuracy changes between the center and edges are relatively small. The curves are not spreading much.
o The functional connection between accuracy and radial distance are linear
o The curves of the different cameras have low deviation
o The accuracy differences spreads between approximately 10% and 40% calculated between the center and the edges
Fig. 5 Accuracy as function of radius Close-range metric camera types
3.2.2 Results of Non-Metric and Semi-Metric Cameras
The non-metric and semi-metric digital cameras are already widely used and their use is increasing rapidly. The main scope was to evaluate the accuracy of this camera group. Several types of cameras were tested and they show a very clear tendency. The accuracy in the center of the image is very close to the mean value and at the corners a significant accuracy reduction can be seen.
The accuracy reduction between the center and edges is relatively high. The curves are not spreading too much showing a clear figure.
o The functional connection between accuracy and radial distance is not linear
o The curves of the different cameras have low deviation to each other
o The accuracy differences spreads between approximately 20% and 80% calculated between the center and the edges
Fig. 6 Accuracy as function of radius Non- and Semi-metric camera types
3.3 Data Errors and Detection
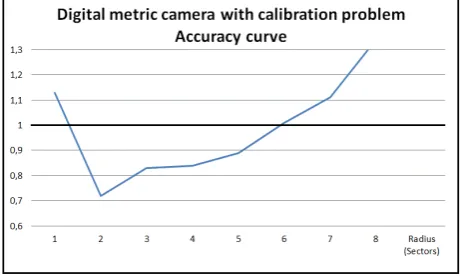
Problems with point distribution or remaining systematic errors occurs a very different type of curves of this function. The following graph display the result of projects with data problems. In the Figure 7 the calibration was not correctly and fully done and the remaining effects occur a curve but not like an ascending curve. Figure 8 is the image of the same project where the remaining residuals in the image are shown.
Fig. 7 Accuracy as function of radius Digital Camera with calibration problem
The International Archives of the Photogrammetry, Remote Sensing and Spatial Information Sciences, Volume XL-1, 2014 ISPRS Technical Commission I Symposium, 17 – 20 November 2014, Denver, Colorado, USA
This contribution has been peer-reviewed.
Fig. 8 Remaining effects of photo residuals
Unevenly distributed measurements in the image again show problems at this function. Because of the bad point distribution a good calibration is not possible and the remaining errors occur the unusual curve.
Fig. 9 Accuracy as function of radius Semi-metric camera with data problem
If the curve of this function differs from the continuously light ascending line or curve than it still contains systematic errors. It is an easy tool to analyze and check this curve and find any data or parameter errors for the projects.
4. MODELLING THE RADIAL ACCURACY For the photogrammetric aerial and UAV camera types we tried to design general curves which should described the accuracy changes of the camera type. For the photogrammetric cameras it can be described by a slightly ascending straight line (Fig 10). The accuracy of the UAV camera types can be described by a curve which starts slightly ascending and at the end turns up very steep. See Fig 11.
Fig. 10 Accuracy of the photogrammetric camera types with fitted line
Fig. 11 Accuracy of the Non-metric and Semi-metric camera types with fitted curve
5. CONCLUSIONS
The test results lead us to the general conclusion that a functional connection between accuracy and radial distance exists. In summary, we can conclude that the accuracy is always higher at the center and less accurate in the direction to the borders. Our tests prove that there is a curve for the measurement precision as function of the photo radius, which varies depending on the camera types and camera groups used. The analyzed aerial photogrammetric camera types can be modelled by a linear function. For non-metric or semi-metric cameras used on UAV`s can be modelled by a curve. To use this modelling at the accuracy calculation the result of these cameras can be enhanced and more widely used for professional applications.
The further task is to define the parameter of a general curve for the camera groups and include it in the adjustment process to enhance the final accuracy.
The effect of the flying height or mean photo scale to the radial accuracy changes have not been verified yet and should be a subject of further examination.
REFERENCES
Kraus, K.: Photogrammetry, Geometry from Images and Laser Scans, 2nd Edition, Walter de Gruyter GmbH & Co. KG, Berlin, Germany 2007
Kruck, E.: Kombinierte Ausgleichung mit Varianzkomponenten-schätzung und Simultankalibrierung. Arbeitstagung 'Kamera-kalibrierung in der Photogrammetrischen Praxis'.
DGKommission Reihe B, Nr. 275. München, 1985
Kruck, E., BINGO 6.6 User Manual, Aalen, Germany, Oct. 2014
The International Archives of the Photogrammetry, Remote Sensing and Spatial Information Sciences, Volume XL-1, 2014 ISPRS Technical Commission I Symposium, 17 – 20 November 2014, Denver, Colorado, USA
This contribution has been peer-reviewed.