IMAGE BASED RECOGNITION OF DYNAMIC TRAFFIC SITUATIONS BY
EVALUATING THE EXTERIOR SURROUNDING AND INTERIOR SPACE OF VEHICLES
A. Hanela, H. Klödenb, L. Hoegnera, U. Stillaa
a
Photogrammetry & Remote Sensing, Technische Universitaet Muenchen, Germany - (alexander.hanel, ludwig.hoegner, stilla)@tum.de bBMW Research & Technology, Muenchen, Germany - [email protected]
KEY WORDS:vehicle camera system, crowd sourced data, image analysis, machine learning, object detection, illumination recogni-tion, traffic situation recognition
ABSTRACT:
Today, cameras mounted in vehicles are used to observe the driver as well as the objects around a vehicle. In this article, an outline of a concept for image based recognition of dynamic traffic situations is shown. A dynamic traffic situation will be described by road users and their intentions. Images will be taken by a vehicle fleet and aggregated on a server. On these images, new strategies for machine learning will be applied iteratively when new data has arrived on the server. The results of the learning process will be models describing the traffic situation and will be transmitted back to the recording vehicles. The recognition will be performed as a standalone function in the vehicles and will use the received models. It can be expected, that this method can make the detection and classification of objects around the vehicles more reliable. In addition, the prediction of their actions for the next seconds should be possible. As one example how this concept is used, a method to recognize the illumination situation of a traffic scene is described. This allows to handle different appearances of objects depending on the illumination of the scene. Different illumination classes will be defined to distinguish different illumination situations. Intensity based features are extracted from the images and used by a classifier to assign an image to an illumination class. This method is being tested for a real data set of daytime and nighttime images. It can be shown, that the illumination class can be classified correctly for more than 80% of the images.
1. OBJECT DETECTION AS BASIS FOR VEHICLE ADVANCED DRIVER ASSISTANCE SYSTEMS
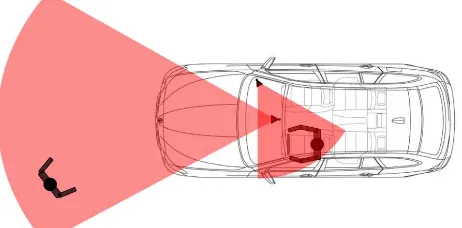
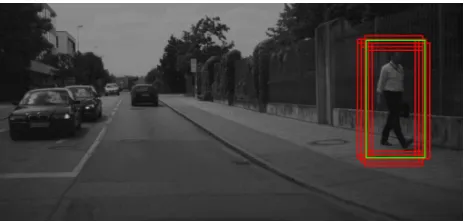
Today, recognizing the position of objects around a vehicle is an important task for advanced driver assistance systems. Be-cause of their high vulnerability, the focus of such systems should be put especially on pedestrians being in the instantly following drive way of a vehicle. Therefore, the estimation of the pedes-trian’s position with a high certainty is a valuable contribution to avoid accidents and injuries. In order to recognize pedestri-ans, modern vehicles are equipped with camera systems in many cases (Figure 1). On images of these cameras, object detectors can be applied in order to detect pedestrians in front of a vehicle.
Figure 1: Position and orientation (black triangles) and field of view (red) of a exterior and interior looking vehicle camera used for recording of the scene in front of a vehicle and the driver, respectively. Images can be used to detect pedestrians (black top-down shape).
Before the detector can be used, an underlying model and the
corresponding parameters must be determined. These values can be learned in a training step by evaluating a large set of train-ing samples. These samples must contain pedestrians in all kinds of appearances, which should be detectable. To handle changes in the appearance of objects over the time, the detector must be learned incrementally. The necessary repeated recording and la-beling of training data can easily take a few hundred hours and is therefore a key problem of incremental learning. It is another ad-vantage of a series of recordings, that it can also be used to learn a motion model to predict the actions of pedestrians for the next seconds. Knowing the probable actions of pedestrians can be a contribution to avoid accidents.
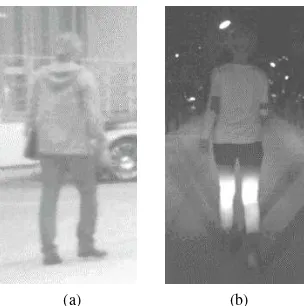
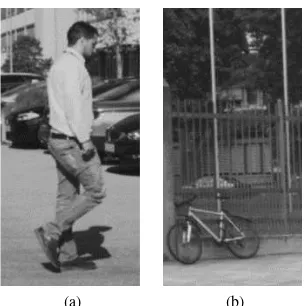
In many cases, separate detector models are trained for different appearances within an object class. A high detection reliability for an individual object can only be achieved, if the detector uses a model trained on the same appearance as the individual object has. An important influence on the appearance of objects has the illumination of a scene (Figure 2). If the illumination goes down, this will lead to a decrease of the image contrast, which makes it more difficult or even impossible to recognize texture information from the image. Together with a lower signal-to-noise ratio, the reliability of gray value based and texture based features for detectors will be lowered. To be able to use the object detector with a suitable parameter set, it is necessary to recognize the typical illumination situation before.
(a) (b)
Figure 2: Images of a vehicle camera system with original reso-lution, but increased brightness. Different appearance of pedes-trians: a) during a cloudy day, b) in the night.
Depending on the grade of attention, a driver assistance system can take different measures like showing an optical warning mes-sage to increase the situation awareness of the driver or do an automated braking to avoid a collision.
2. STATE OF THE ART
Recently, some projects handling crowd sourced data have started. Crowd sourced data can be described as big set of data obtained from a high number of sources. This strategy can be used to collect traffic data using several vehicles as sources (Jirka et al., 2013). For instance, the vehicle velocity can be obtained from sensors in vehicles. This data is acquired by many vehicles, sent with radio networks over the internet and collected on a central server (SmartRoad project, Hu et al. 2013a). In the SmartRoad project, vehicle status data acquired together with GPS data from 35 cars driving 6,500 km in total was used to detect and iden-tify traffic lights and stop signs (Hu et al., 2013b). A similar approach with more than 200,000 traces from a vehicle fleet is used by Ruhhammer et al. (2014) to extract multiple intersection parameters like the number of lanes or the probability of turning maneuvers. In contrast, Wang et al. (2013) use the term “so-cial sensing” for applications, where observations are collected by a group of sources, e.g. individuals and their mobile phones. They address the problem of possible unreliability of social sens-ing. As solution, they propose to introduce physical constraints, which for example allow to understand, which variables can be observed by a source at a certain location. Madan et al. (2010) show the high capability of social sensing systems by using only location information from mobile phones carried by individuals to derive information about their health status. With this data ba-sis, they were able to analyse, that illness of a person leads to a change in behavior and movements during a day.
Machine learning is often used to evaluate a large amount of data. Supervised learning techniques base on the availability of ground truth information for all training samples. This ground truth in-formation is not available for every learning task. Active learning is a strategy for supervised learning if ground truth information is only available for a small number of training samples or the effort for getting ground truth information is very high (Settles, 2010; Sivaranam & Trivedi, 2010). The basic idea of active learning is to obtain the highest possible amount of information for a classi-fier model by specific selection of only a number of training sam-ples, for which ground truth data must be obtained. The selection
is controlled by a selection function, which combines information about the distribution of all training data samples and the current classifier model. From this information, the expected improve-ment of the classification results is estimated and the ground truth information of the samples with the most influence on it requested by the classifier. The selection and training process is done itera-tively. Wuttke et al. (2015) present a method, how the usefulness for each unlabeled training sample can be rated. They create a hypothesis based on analyses of the following three components. First, information about the structure of the unlabeled data is ex-tracted. Furthermore the change of the hypothesis between before and after including ground truth information for new samples is considered. As the last part, the results of the prediction step of a classifier is compared with the ground truth information.
Machine learning techniques can also be used for object detec-tion. A wide variety of standard methods for machine learning on features extracted from images exists already. In many cases, a combination of a descriptor describing the image information and a classifier separating these descriptions into different object classes is used. HOG-SVM is such a descriptor-classifier model used to detect pedestrians (Dalal and Triggs, 2005). This de-scriptor calculates for each image block-wise information about the orientation of dominant gray scale edges. The SVM classi-fier with a linear kernel allows to determine a hyper plane sep-arating two classes in a passable time also for a high number of training samples. Dalal & Triggs (2005) use a model, which de-scribes objects as one part. Felzenszwalb et al. (2009) extend the HOG-SVM descriptor by introducing part-based models, which can handle deformations within an object.
Besides the HOG features, in the literature there are several mea-sures describing the quality of images, for example blur, noise or compression (Avcibas et al., 2002). For example, quality mea-sures exist based on low-level image features like the Minkowski measure (De Ridder, 1992), which can be obtained from the pixel-wise difference of image intensities. Furthermore, in Nill (1992) more complex methods based on the transformation of the image information into the frequency domain can be found. Another ap-proach described by Saghiri et al. (1989) is the modeling of the human visual system (HVS), in order to derive quality measures from it.
Image features are for example histogram based features, as de-scribed by Ross (2010). They can be calculated from statistical measures (e.g. mean value, standard deviation) of the gray value histogram of an image. With these features, it is possible to char-acterize on the one hand the histogram itself and on the other hand the image. The combination of intensity information with their corresponding geometrical distribution in an image is described by central image moments, according to the first description in Hu (1962) and an analysis of their usage for geometric image transformations (Huang & Leng, 2010). For example, these fea-tures determine the center of gravity of the intensity distribution in an image and therefore allow to draw conclusions on the posi-tion and strength of light sources shown in the image.
3. CONCEPT FOR IMAGE BASED RECOGNITION OF DYNAMIC TRAFFIC SITUATIONS
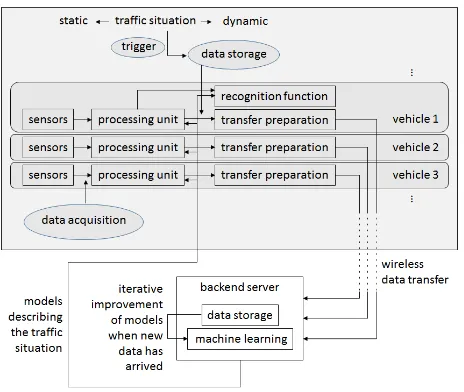
In this section, the concept for image based recognition of dy-namic traffic situations is shown. The functionality will be em-bedded in a client-server system (process flow see Figure 3).
Figure 3: Process flow of the client-server system for image based recognition of dynamic traffic situations.
The key objective of this work is to develop new strategies to use unsupervised or semi-supervised machine learning techniques (e.g. active learning or transfer learning) based on image data in order to recognize dynamic traffic situations. In sum, several vehicles (clients) will acquire data about the traffic situation they are driv-ing in and send it to a server. On the server, the data will be aggregated continuously and used iteratively for machine learn-ing. The resulting machine learning models describing the traffic situation will be sent back to the vehicles and used there for the recognition of the current traffic situation.
3.1 Traffic situations and sensor setup
The recognition of traffic situations is based on images of cam-eras, which are mounted in vehicles (Figure 1). One camera in each vehicle will look at the driver and the other one will look at the street scene in front of the vehicle. The area aside or behind a recording vehicle will not be taken into account at the moment. In addition, internal measuring instruments (GPS receiver, IMU) of the vehicles will be used to acquire vehicle status data. This sen-sor setup will be integrated in a vehicle fleet, whereby all vehicles will get the same devices.
In this paper, a traffic situation consists of a recording vehicle and its driver as well as of the objects surrounding this vehicle. A traf-fic situation can be described as static or dynamic. The dynamic description contains all objects of the traffic situation and their current movements and their intentions. The static description can be seen as a single snapshot of the dynamic traffic situation. Only objects being around and present at the same time as the recording vehicle are relevant for the description of the traffic sit-uation. The space, which is considered for other objects around the recording vehicle depends on the possibility, that these ob-jects may influence the recording vehicle and has to be restricted
due to the range of the measuring instruments. Objects can also be dynamic (e.g. vehicles, pedestrians) or static (e.g. light poles, trees).
3.2 Data acquisition and triggering for storage
The first part of the processing chain is the acquisition of images and vehicle status data. This will be done by the vehicle fleet driving around for a certain time and capturing data about the traffic situations they are in. In other machine learning projects, this is done by only a single vehicle or a small number of vehicles due to the high cost and time efforts. For example, in a project described by Dollar et al. (2009), a single driver acquired data for approximately 10 hours containing only around 2,300 pedestrians (cf. data set used for training in chapter 4). By using a fleet of vehicles, a much larger amount of data can be obtained and used for machine learning.
After acquisition, the images as well as the vehicle status data will be transmitted to a processing unit in the vehicle. The acqui-sition and transmission of data will be done continuously with a frequency depending on the instruments (e.g. exposure time of a camera) and on the underlying physical principles (e.g. position from GPS is not needed as often as accelerations from IMU). The data collected in the processing unit will be used as input for the transfer preparation (see subsection 3.3).
The transmission to the transfer preparation unit is controlled by a trigger. Triggering will be started in road spots, which are in-teresting for a certain function of an advanced driver assistance systems. For example, intersections can be interesting road spots if the behavior of road users at intersections should be learned. Interesting road spots and features to recognize them must be de-fined prior to the data acquisition. The features should ensure a low false detection rate and therefore avoid manual intervention. For the example described above, triggering will start when an algorithm detects traffic lights or stop signs from images. Then the acquired data will be transmitted to the transfer preparation unit and the following processing tasks are started. Triggering will be stopped after a few seconds depending on the type of road spot. As of now, the acquired data will be deleted until triggering is started again.
3.3 Transfer preparation
The objective of this step is to reduce the amount of data, before it is transmitted (subsection 3.4) to and stored on the server. This step is necessary to be able to send the data wireless from the ve-hicles to the server, because restrictions on the data rates of the wireless transmission techniques must be met. Especially, this is important for memory consuming image data. As a further ad-vantage, the reduction of data allows to send more different types of data and to increase the sending frequency of data samples. In this step, the number of data samples will not be reduced, be-cause this would have an negative influence on the reliability of the machine learning.
dimensionality will be performed by the extraction of features, which describe relevant parts of the data. If extraction is per-formed, only the features will be stored, but not the acquired raw data. The feature extraction can be applied especially for mem-ory consuming image data and is less relevant for memmem-ory saving numerical data.
3.4 Data transfer
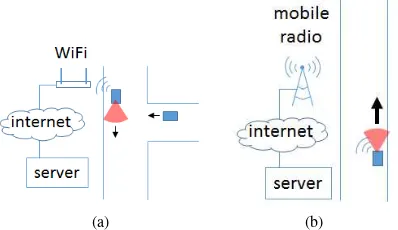
After the preparation of the data in each vehicle of the fleet, it will be transferred wireless from the vehicle via the internet to the server and stored there. For transfer, either WiFi networks or mobile radio networks are used (Figure 4). The decision which technique is used is based on the availability of hot spots and on the vehicle velocity. The key problem of wireless data transfer is, that a data packet has to be sent again, if the connection to the hot spot gets lost while sending (e.g. because the vehicle is moving). The influence of this problem becomes bigger if the vehicle velocity increases and may prevent, that as much data is transferred as it is acquired.
(a) (b)
Figure 4: Techniques for wireless data transfer between vehicles and a server. The black arrows indicate the driving direction; the red circular segments indicate the field of view of a vehicle camera: a) WiFi, used for communication at low vehicle speed, e.g. at intersections, b) mobile radio, used at higher speeds or if WiFi is not available.
Transfer via WiFi (Figure 4a) uses public WiFi networks, which are offered in some cities. This method is preferred over the other one, because of higher data rates. A vehicle will search for WiFi networks, if the velocity is lower than a threshold around 10 km/h. This threshold ensures, that the connection does not get lost too fast due to the small covered area of a single WiFi hot spot, if the vehicle is moving fast. When having found a hot spot, the connection to it will be established and the data packets will be sent. The data transfer will end and the connection will terminate, when the velocity threshold is exceeded.
Transfer via mobile radio networks (Figure 4b) will only be used if no public WiFi network is available or the vehicle velocity is higher than the threshold. Due to the larger covered area of cel-lular hot spots, it is possible to transmit data with mobile radio networks for a longer time period even if the vehicle is moving.
3.5 Machine learning on the server
When data from the vehicles is available on the server, features used to model traffic situations have to be extracted from it. As an advantage compared to the processing unit in the vehicles, a higher computational power is available on the server, which al-lows to extract more complex features. Additionally, the feature calculation in the “post-processing” on the server can take more time than the processing of continuously acquired data allows.
As an example for low-level features used for object detection from images, HOG features (see section 2) describing gray value edges in images can be extracted. Also a sequence of images can be used to derive features. For example, information about the relative distance between the camera and an object can be de-rived from consecutive images. The position data of the vehicle obtained from the vehicle status data can integrate scale informa-tion. As an example for high-level features, the attention of the driver can be described by calculating the frequency of his eye blinks or the frequency how often he turns his head from images. These values and their changes allow to draw conclusions on the grade of attention.
These features are the input, on which new strategies for ma-chine learning techniques will be applied. The first training step will take place, when a certain amount of data has arrived on the server. Up-to-date learning approaches like active learning or transfer learning will be used. With active learning, ground truth information has to be determined only for a small subset of all training samples (samples used for a pedestrian detector see Figure 8). In the first iteration, ground truth (example: does the sample contain a pedestrian or not?) will be provided for each training sample. In the following iterations, only the samples re-quested by the algorithm will be labeled. This reduces high label-ing effort, which can take easily 40 times as much time as needed for data recording (Dollar et al., 2009). Transfer learning should be used to cover a wider variety of object classes.
The machine learning algorithms on the server will learn a model of the driver of the recording vehicle as well as models of the ob-jects surrounding this vehicle. The mutual dependency of these two kinds of models will be considered. Especially, geometric and semantic links between the models will be taken into account for the learning and analysed subsequently. By using image se-quences, the behavior of the driver and the objects will also be modeled. The resulting models describing the driver and the sur-rounding objects will be transmitted back to each vehicle of the fleet. There, they will be integrated into advanced driver assis-tance systems and used for the recognition function for dynamic traffic situations. Underlying models for the detection and classi-fication of objects will also be sent to the vehicles and integrated in the existing detection and classification systems.
During and after the learning, the acquisition, preparation and transfer will continue. The learning algorithms will be applied again, when a certain amount of new data has arrived on the server. The models resulting from the iterative learning will be sent to the vehicles again. To make the strategy more efficient, the learning will be done incrementally with only the new data and update the already learned models.
3.6 Recognition of the illumination situation for object de-tection
Figure 5: Flow chart for recognizing the illumination situation. For an image or image cutout, an image description is obtained. A classification based on this description leads to the illumination class for the global (whole scene) or local (only parts of the scene) illumination situation of the scene, which is shown in the image.
3.6.1 Definition of the term “illumination situation” In this subsection, the term "illumination situation" describes the illumi-nation of a scene, which consists of the combiillumi-nation of several light sources with different positions, orientations and power (ex-ample see Figure 6). The illumination of a scene can be influ-enced by natural and artificial light sources. Natural sources like the sun or the moon illuminate the scene widely. In the follow-ing text, the term "global illumination situation" is used, if a light source has influence on the illumination of the whole scene. The global illumination situation can be distinguished into daylight and nighttime. Artificial light sources can be for instance street lights or vehicle head lights, which illuminate a local area of the scene. The “local illumination situation” is defined as the combi-nation of global and local light sources. In general, the illumina-tion of a scene captured in an image is not uniform. Especially, this is important for images of night drives, which are taken in a scene with an illumination consisting of different light sources like vehicle head lights and street lights. If looking at different spots in the image, they will have different light exposures in the image depending on the viewing angle and the orientation of the camera and the current illumination situation in the scene.
Figure 6: Example image (gray scale), taken at night in a resi-dential area. The illumination of the scene in the image is mainly influenced by the vehicle head lights. For better presentability, the contrast of the image was increased.
The wide variety of possible illumination situations is divided in a few illumination classes, in order to use different parame-ter sets for object detectors depending on the illumination. Il-lumination situations with low ilIl-lumination can be separated in descending order into the three classesnight: urban area(head light of recording and other vehicles and street lights),night: res-idential area(head light of recording vehicle and street lights) andnight: country road(only head lights of recording vehicle). Illumination situations with bright illumination are summarized in the classdaylight, which contains sunny, shadowed as well as clouded areas of the scene in one class.
3.6.2 Image description and classification As image descrip-tion, histogram based features as well as central image moments
(section 2) are used. Both feature groups consist of a high num-ber of single features. The value for each single feature can be calculated for a certain image or a cutout of the image. The com-position of all feature values for a certain image or image cutout forms the feature vector, which is used as the image description. To obtain information about the global illumination, the composi-tion of the feature vector is done for the feature values of a whole image. To get information about the local illumination, this com-position is done for an image cutout. The cutout is represented by a search window, which is moved in a sliding window approach with a grid shape over the whole image. The position, shape and size of this window can be influenced by the search window of an object detector. For instance for a pedestrian detector, a vertically aligned rectangle suits very well.
Finally, the feature vector can be evaluated with a classifier al-gorithm. It assigns an image or a cutout to an illumination class. For this purpose, the Bayes classifier (section 2) will be used. If the feature vector of the whole image is being evaluated, the illu-mination class for the global illuillu-mination situation is determined. If on the other hand only a local image cutout is being evaluated, the illumination class for the local illumination situation is deter-mined.
In a previous step, the classifier must be trained on the server with a data set (see chapter 4) of images and image cutouts of all illumination classes. This step is made separately for whole im-ages and for image cutouts. To use the data samples for training, the feature vectors must be calculated and the true class (ground truth) must be known. After this, it is possible to assign images or image cutouts without known ground truth to a certain illumi-nation class using the classifier model. This assignment will be done standalone in vehicles for images acquired by the cameras.
By combining the global and local illumination class of a cutout, profound information about the illumination of the part of the scene shown in the cutout can be given. Thereby it is possible to link the global illumination of a scene with the local variations of the illumination within the scene.
3.6.3 Improvement of object detections If the global and lo-cal illumination situation is known for a certain image cutout, it is possible to choose a suitable detector model for an object detector (example see Figure 7). An illumination specific detector model will give the object detector additional a-priori knowledge about the appearance of the objects and therefore improve the reliability of the detector. A look-up table can be used to link the illumina-tion informaillumina-tion and the detector model. This table stores for each combination of global and local illumination situation the information in a 2d matrix, which descriptor and classifier with which parameters fits best for object detection.
4. EXPERIMENTS
For the recognition of the illumination situation (subsection 3.6), 32,000 images are recorded by the exterior vehicle camera. These images are used as data set for training and testing. Therefore, cutouts with a fixed size of 320x160 px are taken from these im-ages. Positive cutouts (Figure 8a) are obtained using ground truth information and contain the picture of a single pedestrian with a certain background in each direction around the person. Negative cutouts (Figure 8b) are sampled randomly and contain the picture of arbitrary objects in the scene, but no pedestrians. Altogether, in all illumination classes around 18,000 positive and 60,000 neg-ative image cutouts are used. Such an domination of negneg-ative samples is typical for object detectors, as shown by Dalal and Triggs (2005). Approximately 38% of all images are from the il-lumination classnight: residential area, 29% fromnight: urban area, around 19% fromnight: country roadand 14% from the
daylightclass. This imbalance is caused by the higher number of pedestrians in urban areas and therefore a higher importance of such areas for pedestrian detection. For all this data the correct class membership (ground truth) is known. For the whole images as well as for the two types of cutouts, the features are calculated and the feature vectors obtained separately. The total data set is divided randomly in a 80% part used for training and a 20% part used for validation of the detector.
(a) (b)
Figure 8: Image cutouts used to train the pedestrian detector: a) positive cutout showing a pedestrian, b) negative cutout showing no pedestrians.
Having the feature vector, the proposed Bayes classifier will be trained with the training data. Finally, with the learned model, the validation data samples can be assigned to one of the illumi-nation classes. The proposed classifier reliability measures can be calculated by comparing the classifier results with the ground truth information.
5. RESULTS AND DISCUSSION
In this part, the expected results of the recognition of the traf-fic situation and the recognition of the illumination situation are described.
5.1 Expected results of the recognition of the traffic situa-tion
It can be expected, that the quality of the recognition of dynamic traffic situations will be improved with the proposed concept. For comparison, a recognition system based only on numeric data
will be considered (e.g. described in Ruhhammer et al. (2014)). In more detail, precise information about the current traffic situ-ation should be obtained by the system in the vehicle. Further-more, the detection and classification rate of objects will raise probably. The advantage of using image data compared to us-ing only position data (e.g. vehicle trajectory from GPS) will be shown and evaluated. The completeness and the geometrical accuracy of the detected objects can be evaluated by comparing with manually labeled image data used as ground truth. The qual-ity of the prediction of the intention of the driver and the intention of other traffic users should be analysed in respect with the results of the estimation of the attention of the driver. The evaluation of the prediction for few seconds can be made with the consecu-tively recorded image data. Furthermore, the different reduction methods should be compared considering the trade-off between the grade of reduction and loss of information. For evaluation, real use cases in the topic of vehicle safety will be applied. The decision between dangerous and non-dangerous traffic situations for a vehicle by using the recognition for dynamic traffic situa-tions should be taken as example.
5.2 Results of recognizing the illumination situation
In the following part, the results of the illumination classification are shown. The method is being evaluated for positive cutouts (Table 1), negative cutouts (Table 2) and whole images (Table 3) with the proposed classifier reliability measures (see section 2).
Class UA PA OA
Night: Residential Area 69.63% 86.21%
82.63%
Night: Urban Area 94.51% 67.47%
Night: Country Road 66.81% 95.77%
Daylight 98.31% 96.13%
Table 1: Quality measures overall accuracy (OA), user’s accuracy (UA) and producer’s accuracy (PA) for evaluation of the illumi-nation recognition for positive image cutouts.
Class UA PA OA
Night: Residential Area 77.68% 77.87%
86.12%
Night: Urban Area 83.44% 85.21%
Night: Country Road 58.62% 48.30%
Daylight 97.34% 95.42%
Table 2: Quality measures overall accuracy (OA), user’s accuracy (UA) and producer’s accuracy (PA) for evaluation of the illumi-nation recognition for negative image cutouts.
Class UA PA OA
Night: Residential Area 89.42% 99.33%
96.01%
Night: Urban Area 99.46% 88.45%
Night: Country Road 98.19% 100%
Daylight 100% 99.78%
Table 3: Quality measures overall accuracy (OA), user’s accuracy (UA) and producer’s accuracy (PA) for evaluation of the illumi-nation recognition for whole images.
the strongly varying appearance of pedestrians in the image fore-ground in the positive cutouts. Especially, pedestrians can have bright or dark cloths. On the other hand, the negative cutouts showing an arbitrary part of a scene contain more often objects from the background of the scene, like parked cars or the street surface. Such objects have especially in night images a lower variety in the appearance.
Confusions between the classes occur mainly between the differ-ent night classes, what can be seen at the lower values for UA and PA compared to thedaylightclass. In this context, it is re-markable, that the classnight: urban areahas a far lower value for PA compared to the other classes for positive cutouts. In-stead, the other two night classes have a notable lower value for the UA. This difference in the values for the UA and PA shows, that samples of the classnight: urban areaare assigned to one of the other two night classes sometimes. For instance, a pedestrian shown in a cutout belonging in fact to the classnight: urban area
is illuminated directly and strongly by the head light of a vehicle, but only hardly by street lights. Then the illumination classifier might assign this cutout with a high probability to the classnight: country roadornight: residential area. The reason may be, that for these two classes pedestrians are typically illuminated only by the vehicle head light, but not by other light sources. This conclu-sion can be turned around for negative cutouts. This means, that negative cutouts belonging in fact to the classnight: urban area
are assigned to this class correctly in the vast majority of cases, which can be seen from the high value for the PA. Instead, for the other two night classes, this value decreased a lot.
Compared to the cutouts, for whole images wrong classifications do not occur for any of the three night classes in a notable number, what can be seen from the permanently high values of UA and PA. All kinds of images and cutouts have it in common, that the
daylightclass can be assigned correctly with a higher reliability than the night classes.
For a pedestrian detector based on the HOG-SVM model, using an unique parameter set for all illumination classes gives an av-erage precision of around 28% for the pedestrian detection. Sep-arate models for each illumination class give values from 65% up to 85% for the night classes. Only the average precision of thedaylightclass remains with around 23% at a low level. This means, that the quality of the pedestrian detection can be im-proved by considering the illumination situation for the selection of the detector parameters. A more detailed discussion of the re-sults of the pedestrian detector is provided in a preceding master’s thesis (Hanel, 2015).
6. CONCLUSION
In this article, a concept to recognize dynamic traffic situations from images is described. The concept proposed to mount cam-eras in vehicles to use them to observe the driver as well as the objects around the vehicle. The images will be acquired by a vehicle fleet and aggregated on a server. On the server, differ-ent types of low-level and high-level features will be extracted from images and used as input for learning. New strategies for machine learning will be used to learn models describing traffic situations. After back-transfer of the models to the vehicles of the fleet, they will be used there for standalone recognition of traffic situations. It can be expected, that the models allow to separate different situations reliably. The prediction of actions of road users for the next seconds should be possible. Further, the mod-els will probably make the detection and classification of objects around the vehicles more reliable. One of the learned models is
used to recognize the illumination situation of a scene from im-ages. Therefore, low level features calculated from an image or an image cutout are used by a classifier to assign the image to an illumination class. With this information, it is possible to use specific parameters for an object detector depending on the rec-ognized illumination situation. The results show, that only sim-ple image features based on the image intensities are necessary to recognize the correct illumination situation. No transforma-tions with a high computational effort or features using reference images are needed. The quality of the illumination recognition is very high for whole images as well as for cutouts of images. The results of the illumination recognition lead to a higher over-all accuracy and reliability of a pedestrian detector compared to leaving out the recognition of the illumination situation. It can be shown, that the greatest negative influence on the reliability of the illumination classification is caused by confusions between night time classes.
Future work on this part of the concept can be done on finding features, which allow a more robust classification. Additionally, more illumination classes should be identified and distinguished from the current ones in order to increase the overall accuracy. In this article, for daylight scenes only one illumination class was taken. It can be assumed, that for example frontlighting (low po-sition of the sun in the evening) or drives through tunnels can cause special illumination conditions, which should be captured by additional illumination classes. Also different weather con-ditions (e.g. fog, rain, snowfall) can lead to special illumination conditions, which should be evaluated.
REFERENCES
Avcibas, I., Sankur, B. and Sayood, K., 2002. Statistical evalu-ation of image quality measures.Journal of Electronic Imaging, 2002. Vol. 11(2), pp. 206-223.
Baraniuk, R., 2007. Compressive Sensing [Lecture Notes].IEEE Signal Processing Magazine, Vol. 24(4), pp. 118-121.
Congalton, R., 1997. A review of assessing the accuracy of classi-fication of remotely sensed data.Remote Sensing of Environment, Vol. 37(1), pp. 35-46.
Dalal, N. and Triggs, B., 2005. Histograms of oriented gradients for human detection. In: Computer Vision and Pattern Recogni-tion, 2005. CVPR 2005. IEEE Computer Society Conference on. Vol. 1, pp. 886-893.
De Ridder, H., 1992. Minkowsky Metrics as a Combination Rule for Digital Image Coding Impairments. In:Human Vision, Visual Processing, and Digital Display III, 1992, pp. 17-27.
Dollar, P., Wojek, C., Schiele, B. and Perona, P., 2009. Pedes-trian detection: A benchmark. In: Computer Vision and Pattern Recognition, 2009. CVPR 2009. IEEE Computer Society Confer-ence on, pp. 304-311.
Felzenszwalb, P.F., Girshick, R.B., McAllester, D., Ramanan, D., 2010. Object Detection with Discriminatively Trained Part-Based Models. In: Pattern Analysis and Machine Intelligence, IEEE Transactions on, Vol. 32(9), pp. 1627-1645.
Fukunaga, K., 1990. Introduction to Statistical Pattern Recogni-tion. Academic Press Processional Inc, Waltham, Massachusetts, USA.
Fahrzeugkamerasystems. Master’s thesis. Technische Universität München, Faculty of Civil, Geo and Environmental Engineering, Photogrammetry and Remote Sensing.
Hu, M.-K., 1962. Visual pattern recognition by moment invari-ants. In:Information Theory, IRE Transactions on. Vol. 8(2), pp. 179-187.
Hu, S., Liu, H., Su, L., Wang, H. and Abdelzaher T.F., 2013a. SmartRoad: A Mobile Phone Based Crowd-Sourced Road Sens-ing System. Technical Report, University of Illinois at Urbana-Champaign.
Hu, S., Liu, H., Su, L., Wang, H. and Abdelzaher T.F., 2013b. SmartRoad: A Crowd-Sourced Traffic Regulator Detection and Identification System. Technical Report, University of Illinois at Urbana-Champaign.
Huang, Z., Leng, J. 2010. Analysis of Hu’s Moment Invariants on Image Scaling and Rotation. In: Computer Engineering and Technology, 2010 2nd International Conference on. Vol. 7, pp. 476-480.
Jirka, S., Remke, A., Bröring, A., 2013. enviroCar - Crowd Sourced Traffic and Environment Data for Sustainable Mobility. Technical Report, 52°North Initiative for Geospatial Open Source Software GmbH.
Madan, A., Cebrian, M., Lazer, D., Pentland, A., 2010.Social Sensing for Epidemiological Behavior Change. In: Proceedings of the 12th ACM International Conference on Ubiquitous Com-puting, pp. 291-300.
Nill, N., 1992. Objective image quality measure derived from digital image power spectra.Optical Engineering, Vol. 31(4), pp. 813-825.
Ross, J., 2010. Introductory Statistics. Elsevier Science, Amster-dam, Netherlands.
Ruhhammer, C., Hirsenkorn, N., Klanner, F. and Stiller, C., 2014. Crowdsourced intersection parameters: A generic approach for extraction and confidence estimation. In: Intelligent Vehicles Symposium Proceedings, 2014 IEEE, pp. 581-587.
Saghiri, J., Cheatham, P. and Habibi, A., 1989. Image quality measure based on a human visual system model.Optical Engi-neering, Vol. 28(7), pp. 813-818.
Settles, B., 2010. Active Learning Literature Survey. Technical Report, University of Wisconsin-Madison.
Sivaraman, S., Trivedi, M.M., 2010. A General Active-Learning Framework for On-Road Vehicle Recognition and Tracking. In:
Intelligent Transportation Systems, IEEE Transactions on, Vol. 11(2), pp. 267-276.
Sokolova, M. and Lapalme, G., 2010. A Systematic Analysis of Performance Measures for Classification Tasks.Information Pro-cessing & Management, Vol. 45(4), pp. 427-437.
Wang, D., Abdelzaher, T., Kaplan, L., Ganti, R., Hu, S., Liu, H., 2013. Exploitation of Physical Constraints for Reliable Social Sensing. In: Real-Time Systems Symposium (RTSS), 2013 IEEE 34th, pp. 212-223.
Wuttke, S., Middelmann, W. and Stilla, U., 2015. Concept for a compound analysis in active learning for remote sensing. In: