www.elsevier.com/locate/eja
Reducing atrazine leaching by integrating reduced herbicide
use with mechanical weeding in corn (
Zea mays
)
L. Heydel
a,b
, M. Benoit
a,
*, M. Schiavon
b
aINRA Station SAD, Domaine du Joly, BP 29, Mirecourt Cedex, France
bEcole Nationale Supe´rieure d’Agronomie et des Industries Alimentaires, B.P. 172, 54505, Vandoeuvre-Le`s-Nancy, France
Accepted 10 May 1999
Abstract
Concern about the effects of pesticides on the environment and the desire to reduce purchased inputs are stimuli to reduce herbicide use. Field research was conducted for three growing seasons to compare the chemical contamination and effectiveness of three weed management practices. Weed control treatments included application of a herbicide mixture of 1.5 kg ai ha−1 of atrazine plus 0.9 kg ai ha−1 of pyridate, this mixture being broadcast alone or band-applied in combination with mechanical weeding, and mechanical weeding alone. The results show that it is possible to decrease the amount of atrazine residue in soil with the band-applied treatment. Such a method is very attractive because crop yields were not decreased, at least in the short run. However, we do not yet know the long-term efficiency of this method regarding groundwater quality, weed population dynamic and crop yield. Further work is therefore needed to assess the long-term impact of this weeding method. © 1999 Elsevier Science B.V. All rights reserved.
Keywords:Alternative weeding practices; Atrazine leaching; Corn weeds; Corn yields
1. Introduction chemicals (Nicholls et al., 1982; Villeneuve et al., 1990; Barriuso et al., 1993).
Two factors influence the amount of atrazine Atrazine is a widely used, soil applied herbicide
leaching into a watershed: the leaching per field that provides excellent weed control in corn (Zea
and the area of corn in the watershed. The area
maysL.). Perhaps due to its persistence in soil and
of corn is linked to the total area of corn in the extensive use for the past 30 years, atrazine has
farms and to its location in the farm territory. been detected in groundwater (Babut et al, 1992,
Modifications in farm management are very 1996; Adamski and Pugh, 1996; Heydel, 1998).
difficult if the farmer practices have to be changed. In France during the last 30 years, the
pro-Therefore, we evaluated the potential reduction of duction of corn has increased by a factor of 16,
atrazine leaching by decreasing the atrazine residue due to increases in areas planted and the yields
concentration per field. per unit area. There are relatively few published
In the studied area, the area of corn has reports on field studies of herbicide residue in
increased rapidly from 1970 to 1985, and the groundwater despite the widespread use of these
amount of applied atrazine per hectare was stable until 1992 (Heydel, et al., 1997). Since 1992, the
* Corresponding author. Tel.:+33-3-2938-5500;
amount of applied atrazine decreased from 2.5 to
fax:+33-3-2938-5519.
E-mail address:[email protected] (M. Benoit) 1.5 l/ha. Thus, two questions have to be solved:
(1) what level of contamination is created by these Four replications were carried out for the broad-cast and the band treatment, but only three carried agricultural methods, and (2) how can we decrease
the atrazine residue concentration per field with out done for the mechanical weeding alone. Treatments were randomly assigned to each plot. innovative methods?
The objective of this research was to compare The experiment ran from 1995 to 1997 for the broadcast and the band treatment, but only in the effects of three weed control strategies on soil
water contamination, yields, weed population and 1995 and 1996 for the mechanical weeding alone. The amount of weeds was so high in the mechan-weed control cost. Control strategies included: (1)
herbicide alone, (2) mechanical weeding alone ical weeding treatment that we could not execute this treatment in 1997.
(between-row cultivation), and (3) band herbicide applications plus mechanical weeding.
2.2. Corn culture and treatment
Each year, the plots were planted with corn
2. Materials and methods
(Zea maysL.) in May. Corn was sown with a row
spacing of 75 cm. Corn residue was left on all
2.1. Site description
plots during the winter. They were soil-incorpo-rated each year in the early spring when the plots The research field was located at the INRA’s
(National Institute of Agricultural Research) had been chisel-ploughed.
Pesticide treatments were surface-applied, as a Mirecourt station about 50 km south of Nancy
(Meurthe et Moselle, France). commercial formulation, on the same date for each treatment. After emergence, herbicides were The field, with no slope, is a brown soil.
Table 1lists the soil’s physico-chemical characteris- applied in 145 l/ha of water. For the broadcast treatment, a 12 m sprayer with 8003 flat fan nozzles tics. This soil type is one of the predominant
agricultural soils in north-easthern France. (TeeJet) was used. For the band herbicide applica-tions associated with mechanical weeding, a six-Precipitation data were recorded at a
meteoro-logical station near (about 100 m) the research row Schmotzer hoe with flat fan nozzles (8003E TeeJet) spaced at 75 cm was used. Herbicides were field. The annual rainfall is 980 mm (30 years
average), and the water surplus, i.e. rainfall minus applied within a 20 cm band centered on the corn row. The normal rate of herbicide consisted of evapotranspiration, is 275 mm per year (30 years
average). 1.5 kg ai/ha of atrazine and 0.9 kg ai/ha of pyri-date. Herbicide use was reduced by 73% with the The field had a 5 year history of alfalfa
(Medicago sativaL.) without any atrazine applica- band application. The mechanical weeding
treat-ment was done with the same six-row Schmotzer tion. In 1995, the field site was chisel-ploughed in
early spring and divided into 11 small plots, each hoe. Hoeing was scheduled by weed populations and corn heights (two or three harrowings were 12 m wide by 20 m long. Grass alleyways (2 m
wide) were established around each plot. necessary).
Table 1
Soil characteristics: particle size and organic carbon (C ) Depth (cm) Partical-size distribution (g/kg)
Clay Fine silt Coarse silt Fine sand Coarse sand C
0–30 206 403 227 80 41 13.3
30–40 244 391 211 74 48 7
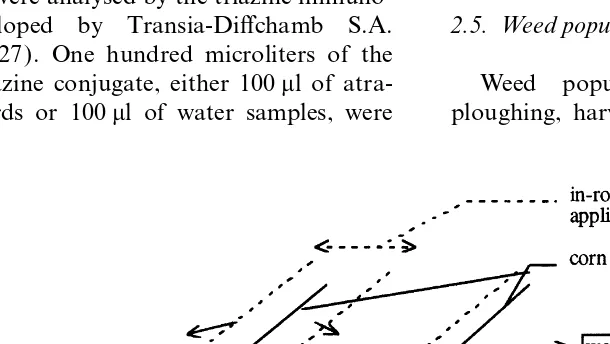
2.3. Soil water solution sampling and analysis added to the microplate wells coated with the anti-triazine antibody. After incubation for 30 min at room temperature while being shaken, the solid Each plot was equiped with three porous
ceramic cups. Each comprised a ceramic cup residue was washed five times with distilled water. Then, 50ml of substrate (urea peroxide) and 50ml 63 mm in diameter, 90 mm long and 6 mm in
thickness, extended with a PVC tube (Nardeux of chromogen (tetramethylbenzydine solution) were added to each sample and left for 30 min at Company, France). Samplers were installed
verti-cally with their ceramic parts at 80 cm depth. The room temperature while being shaken. The color-ation development was stopped by adding 50mL device was completed by two tubes used to apply
vacuum and to collect water samples on the field of sulfuric acid solution. The yellow color intensity was evaluated at 450 nm with a microplate reader. border. The porous ceramic cups were installed in
the row after the sowing ( Fig. 1). Atrazine sample concentrations were determined to within 0.02–1mg/l by comparing the absor-After each rainfall event, the porous cups were
purged, and a 0.7 bar vacuum was applied. Suction bances of samples to a linear regression log–logit standard curve prepared from atrazine standard was achieved within 48 h with decreasing vacuum.
Soil water samples were then extracted, and the solution. Duplicates were made for each sample. volume of extracted water was measured. Samples
smaller than 250 ml were discarded to avoid con- 2.4. Corn yields
centration disturbance by the ceramic
(Perrin-Ganier et al., 1994, 1996). Water samples were Corn was hand-harvested and weighed. For each plot, ten corn plants and whole ear samples collected, and those obtained on the same plot
were brought together and mixed. Then, they were were weighed, shelled and the grain reweighed to determine the shelling percentage. Moisture was transported to the laboratory and immediately
frozen until analysis. The lack of soil moisture determined for plant and grain samples from each plot and yield adjusted for 30%moisture.
prevented sample collection in some periods. Samples were analysed by the triazine
immuno-assay developed by Transia-Diffchamb S.A. 2.5. Weed populations
(Ref. PE 0727). One hundred microliters of the
enzyme–atrazine conjugate, either 100ml of atra- Weed populations were estimated before ploughing, harvesting and before and after each zine standards or 100ml of water samples, were
weed treatment. Weeds were recorded by species tive in limiting pesticide transfer from one plot to and were further identified by location within the the others; (3) no other molecule interfered during plot. Those that fell within a 20 cm band centered atrazine residue dosage.
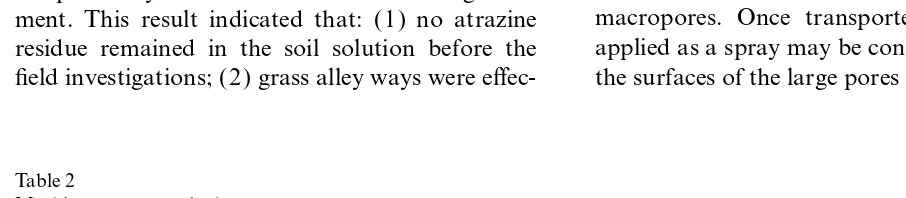
on the corn-row were recorded as ‘in-row’ and all Atrazine residue concentrations measured in others as ‘between-row’. Three measurements were broadcast and band treatments using a porous taken per plot for each weed estimation. cup, throughout the 3 year study, are presented in Fig. 2. For each treatment, the concentrations were extremely variable. Indeed, they ranged from 0.02
2.6. Weeding control cost
(detection limit) to 18mg/l; the highest values being observed 2–6 weeks after atrazine applications. Weeding costs were determined using a
machinery costs work sheet ( Table 2) provided by These results are consistent with those of other the Bureau Commun du Machinisme Agricole researchers (Jayachandran et al., 1994), who ( Krebs, 1997). Weeding time requirements were reported similar concentrations of atrazine residue evaluated by using the average speed observed on found in shallow groundwater systems.
large fields. Despite the concentration variability, the gene-ral shapes of the two curves were similar: in June, after atrazine application, the concentrations of
2.7. Statistical analysis
atrazine residue observed in the water samples Data were subjected to analysis of variance reached a peak. Then, they decreased gradually using the SAS glm procedure, which tested treat- until October or November. After that, they lev-ment effects and interaction of years. Means were eled off until the next atrazine application. compared by Fisher’s protected LSD at the 0.05 Therefore, two levels of atrazine residue concen-probabilty level. tration could be distinguished: (1) a higher level between June and October–November and (2) a lower level from November to the next atrazine application. These results agree with those of Tasli
3. Results and discussion
et al. (1996), who reported the highest concen-trations in June after atrazine application and
3.1. Atrazine residue concentrations: general trend
lowest concentrations after November.
The rapid increase in atrazine residue in June Atrazine residues were never detected in the
probably resulted from preferential flow through samples analysed for the mechanical weeding
treat-macropores. Once transported, atrazine residue ment. This result indicated that: (1) no atrazine
applied as a spray may be concentrated on or near residue remained in the soil solution before the
field investigations; (2) grass alley ways were effec- the surfaces of the large pores where they are again
Table 2
Machinery costs work sheet
Commercial value Use Cost
F (Euros) F ( Euros)
Work short 60 (9.1)/h
Tractor 75 HP 2 wheel drive 170 000 (25875) 700 h/year 64 (9.7)/h Six-row hoe with band sprayer (1.5 ha/h) 65 000 (9900) 150 ha/year 70 (10.7)/ha 12 m sprayer (3 ha/h) 70 000 (10650) 150 ha/year 75 (11.4)/ha
Atraphyt (50%atrazine) 20.9 (3.2)/l 3 l/ha 63 (9.6)/ha
Fig. 2. Dynamics of atrazine residue concentrations (mg/l ) in porous cups according to the method of atrazine application [average atrazine residue concentrations (mg/l ): broadcast application: 1.95; band application+mechanical weeding: 0.52].
susceptible to transport by additional rainfall cup, was larger than the 20 cm band over the corn row which received atrazine. Consequently, suction (Isensee et al., 1990). This assumption seemed
relevant because we observed numerous macro- cup sampled water came from with in-row and between-row which did not receive atrazine, (3) pores due to earthworms and clay desiccation.
Such rapid leaching through macropores has also the atrazine residue movement in the soil was not vertical and only a part of the residues could be been observed by Baer et al. (1992) and Graham
et al. (1992). sampled by the suction cup. This hypothesis is consistent with Sadeghi and Isensee (1992) who Atrazine residue identifications several months
after atrazine aplication may be explained by studied the spatial distribution of atrazine in soil and found that the atrazine movement in soil is migration through the microporous structure and
by adsorption/desorption on soil particles. Such not vertical. The spatial distribution of atrazine is extremely variable and depends on tillage practice, slow leaching has also been observed by Buhler
et al. (1993). rainfall timing and rainfall distribution. This hypothesis also agree with Heddadj (1996) who reported atrazine movement from with in-row to
3.2. Atrazine residue concentrations: comparison
between broadcast and band treatment between with row after a band treatment.
Large differences appeared between the data for
the two weed treatments for concentration levels. 3.3. Corn yield
Average concentration of atrazine from band
treat-ment was about 73% less than from broadcast There were no differences between treatments at harvest in 1995, but differences were observed treatment (Fig. 2). Factors that may have
contrib-uted to the lower concentration of atrazine residue in 1996 ( Table 3). Corn yields were lower in mechanical weeding alone compared with the two in the band treatment are: (1) the lower amount
of applied atrazine due to the banded application other treatments. Differences between those treat-ments were entirely attributable to the weed pop-(only a 20 cm band over the corn row received
Table 3
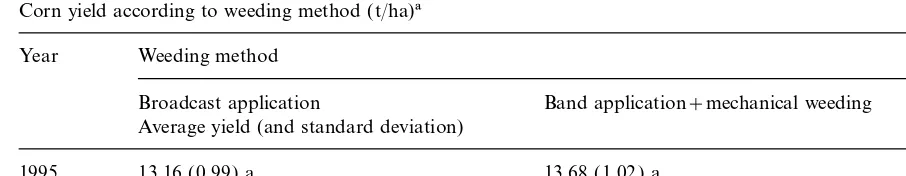
Corn yield according to weeding method (t/ha)a Year Weeding method
Broadcast application Band application+mechanical weeding Mechanical weeding Average yield (and standard deviation)
1995 13.16 (0.99) a 13.68 (1.02) a 13.19 (0.37) a
1996 16.75 (1.34) a 16.15 (1.79) a 7.03 (0.88) a
1997 14.41 (1.22) a 13.60 (1.26) a –
aMeans followed by the same letter do not differ (P=0.05), as deduced from the Newman–Keuls least difference test. Yields were not measured in the mechanical weeding treatment in 1997.
and Doll, 1993; Pleasant et al., 1994; Seconda, combined herbicide plus mechanical weeding. The weed cover ranged from 16 to 20%.
1994; Imgraben and Juncker-Schwing, 1995).
3.4. Weed control 3.4.3. Weed cover distribution
In 1995 and 1996, the in-row weed cover was higher, compared with the between-row cover, in
3.4.1. Composition of the weed population
Before the experiment, the weed population was the mechanical weeding alone ( Table 5). This emphasized the difficulty of controlling weeds in essentially composed ofPoa annuaL.,Poa trivialis
L.,Alopecurus myosuroidesHuds.,Medicago sativa the corn row with conventional cultivation
equip-ment. Band application of herbicide over the row L.,Taraxacum officinalisL.,Capsella bursa pastoris
Moench.,Veronica hederifoliaL.,Veronica persica eliminated this problem as there were no diff er-ences in the distribution of weed cover in any plots Poir.,Lamium purpureumL. andRumex crispusL.
There were no differences in composition of the of the band treatment. These results agree with those of Pleasant et al. (1994), who reported the weed population among plots. Throughout the
3 years of the experiment, the weed population has efficiency of combining cultivation with banded herbicides to control weeds in corn.
changed ( Table 4), but there were no differences in composition in the weed population between
treatments. 3.5. Weeding control cost
Armstrong et al. (1968) indicated that if only
3.4.2. Weed cover
Weed cover in 1995 ranged from 14 to 58% yield and costs were considered and mechanical weeding was timely, mechanical weeding methods with differences between weed control treatments.
Weed cover was much higher in the plot with were more profitable than chemical weeding. When the risk of untimely mechanical weeding was con-mechanical weeding alone compared with the two
other treatments. Among those two treaments, sidered, banded atrazine with one cultivation gave the highest return (Mulder and Doll, 1993). In there were no differences in weed cover.
The weed pressure in 1996 was higher than that our research, corn yields were equivalent for the chemical weeding method and for the banded of the previous year, ranging from 16 to 73%
cover. Plots with cultivation alone averaged more atrazine with one cultivation, and the weeding cost was lower for the combined method ( Table 6). than 70% cover, compared with less than 21% in
the treatment with herbicide or a combination of This suggested that the combined weeding method gave higher economic returns than the broadcast herbicides plus mechanical weeding.
Table 4
Weed changes among years on mechanical weeding plotsa
Weed 1995 1996 1997
Spring Autumn Spring Autumn Spring Autumn
Alopecurus myosuroidesHuds. ++ + ++ + ++ +
Anagallis arvensisL ++ + ++ + ++ +
Capsella bursa pastorisMoench. ++ + + + + +
Chenopodium albumL. + +++ +++ +++ +++ +++
Fumaria officinalisL. + +++ ++ +++ +++ +++
Lamium purpureumL. + + ++ + ++ +
Matricaria recutitaL. + ++ ++ +++ ++ +++
Medicago sativaL. +++ + + + 0 0
Poa annuaL. +++ + + + + +
Poa trivialisL. + + + + + +
Rumex cripusL. ++ + + + + +
Stellaria mediaL. + + +++ + ++ +
Taraxacum officinalisL. + 0 + 0 + 0
Veronica hederifoliaL. ++ ++ ++ + ++ +
Veronica persicaPoir. ++ ++ ++ + ++ +
aRelative abundance: 0, none;+, some;++, presence;+++, coverage.
Table 5
Visual in-row, between-row and plot weed cover between weeding methodsa Localisation Weeding method
Broadcast application Band application+mechanical weeding percentage weed cover Mechanical weeding
1995 1996 1997 1995 1996 1997 1995 1996
In-row 14 a 15 a 13 a 14 a 15 a 18 a 67 c 73 c
Between row 14 a 16 a 16 a 24 a 24 a 22 a 43 b 70 c
Plot 14 a 16 a 16 a 20 a 21 a 20 a 58 bc 73 c
aMeans followed by the same letter do not differ (P=0.05), as deduced by the Newman–Keuls least difference test.
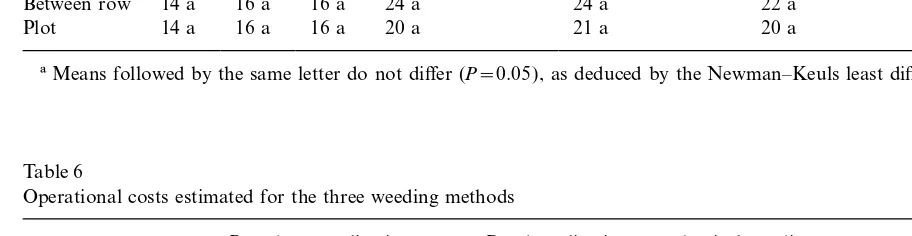
Table 6
Operational costs estimated for the three weeding methods
Broadcast application Band application+mechanical weeding Mechanical weeding
Field time 20 min/ha 90 min/ha 60 min/ha
Number of runs Two broadcast applications One band application+one mechanical weeding Two mechanical weeding Work force 40 F (6 Euros)/ha 150 F (23 Euros)/ha 120 F (18 Euros)/ha Draught 43 F (6.5 Euros)/ha 160 F (24 Euros)/ha 128 F (19 Euros)/ha Herbicide application 150 F (23 Euros)/ha 70 F (11 Euros)/ha 0 F/ha
Herbicides 372 F (57 Euros)/ha 99 F (15 Euros)/ha 0 F/ha
sons of mechanical and chemical weed control. Weed Sci. 4. Conclusions
16, 369–371.
Babut, M., Bombarde, P., Breuzin, C., Dory, C., Limaux, F.,
The combination of banded herbicides with
Hartmann, V., Bellot, A., 1992. Recherche de pesticides
mechanical weeding was as effective in controlling dans des captages AEP en Lorraine campagne 1991. Agence weeds as a broadcast application of herbicide. The de l’Eau Rhin Meuse, Metz, France. 7 pp.+annexes.
Babut, M., Bombarde, P., Breuzin, C., Dory, C., Haller, M.,
banded herbicide controlled in-row weeds whereas
Limaux, F., 1996. Recherche de pesticides dans des captages
mechanical weeding removed weeds between the
AEP en Lorraine campagne 1992. Agence de l’Eau Rhin
rows. This integrated approach reduced herbicide
Meuse, Metz, France. 14 pp.+annexes.
use by 73% and provided adequate weed control Baer, J.U., Powers, W.L., Shea, P.J., Stuefer-Powell, C.L., 1992. and crop yields, at least in the short run. Moreover, Pore size distribution index as an indicator of atrazine move-atrazine residue concentrations observed in porous ment in a crete silt loam soil. Soil Sci. 154, 377–386.
Barriuso, E., Calvet, R., Houot, S., 1993. Field study of the
cups showed that this combined method may
effect of sewage sludge. Application on atrazine behaviour
reduce the amount of atrazine residue in soil. Such
in soil. J. Environ. An. Chem. 59, 107–121.
a method is very attractive because it may give the
Buhler, D.D., Randall, G.W., Koskinen, W.C., Wyse, D.L.,
highest economic returns. However, labor avail- 1993. Atrazine and alachlor losses from subsurface tile ability for timely mechanical weeding may still drainage of a clay loam soil. J. Environ. Qual. 22, 583–588. limit the effectiveness and acceptance of this prac- Graham, R.C., Ulery, A.L., Neal, R.H., Teso, R.R., 1992. Her-bicide residue distributions in relation to soil morphology
tice by farmers.
in two california vertisols. Soil Sci. 153, 115–121.
These results allow us to extrapolate the band
Heddadj, D., 1996. Programme Bretagne Eau Pure —
Ope´ra-application and mechanical weeding practice in
tion pilote de maıˆtrise des transferts de surface: ruissellement
the farm management of corn. This new aspect is et polluants associe´s. ENSA Rennes, laboratoire de sciences in accord with the proposal put forward by Knisel du sol, Rennes, France. 19 pp.
et al. (1995). Therefore, a future use of our data Heydel, L., Benoıˆt, M., Schiavon, M., 1997. Estimation des apports de produits phytosanitaires a` l’e´chelle de bassins
is to test pesticide transport models, as described
d’alimentation. Agronomie 17, 25–33.
in Villeneuve et al. (1988) and Leonard and
Heydel, L., 1998. Diagnostic et maıˆtrise des contaminations des
Knisel (1990).
eaux souterraines par les re´sidus d’atrazine. The`se INPL, 160 pp.
Imgraben, H.J., Juncker-Schwing, F., 1995. Strate´gie de de´sher-bage en maı¨s — re´duction de l’usage de matie`res actives et Acknowledgements
de´sherbage me´canique — rapport AGPM. 9 pp.
Isensee, A.R., Nash, R.G., Helling, C.S., 1990. Effect of
The authors wish to thank the reviewers, and
no-tillage vs conventionnal tillage corn production on the
would like to express their appreciation to movement of several pesticide to groundwater. J. Environ. Jean-Emmanuel Etienne, Damien Foissy, Gilles Qual. 19, 434–440.
Rouyer (INRA Mirecourt), and the Mirecourt Jayachandran, K., Steinheimer, T.R., Somasundaram, L., Moorman, T.B., Kanwar, R.S., Coats, J.R., 1994.
Occur-Experimental Unit members, for their valuable
rence of atrazine and degradates as contaminants of
subsur-assistance in executing this research project.
face drainage and shallow groundwater. J. Environ. Qual.
Financial support was provided to the first author
23, 311–319.
by the Water Agency of Rhin Meuse with help Knisel, W.G., Leonardo, R.A., Davis, F.M., 1995. Represent-from Marc Babut and by the National Institute of ing management practices in GLEAMS. Proc. of the
Euro-Agricultural Research (INRA). pean Society for Agronomy Workshop ‘Modelling the Fate of Agrochemicals and Fertilizers in the Environment’, Venice, Italy, March 3–5, 1994. Eur. J. Agron. 4, 499–505. Krebs, C., 1997. Bare`me d’entraide 97, in: Le Paysan
Vos-References gien, 9–12.
Leonard, R.A., Knisel, W.G., 1990. Can Pesticide Transport Models be Validated Using Field Data — Now and in the Adamski, J.C., Pugh, A.L., 1996. Occurrence of pesticides in
Future. Agric. Engineering Department, University of groundwater of the Ozark plateaus province. Water Resour.
Georgia, Georgia, USA. Depart. Publication No. 3, 26 pp. Bull. 32 (1), 97–105.
use with mechanical weeding in corn (Zea mays). Weed Seconda, L., 1994. Prairie et maı¨s: un duo e´cologique. Top culture 41, 12–15.
Technol. 7, 382–389.
Nicholls, P.H., Walker, A., Baker, R.J., 1982. Measurement Tasli, S., Patty, L., Boetti, H., Ravanel, P., Vachaud, G., Scharff, C., Favre-Bonvin, J., Kaouadji, M., Tissut, M., and simulation of the movement and degradation of atrazine
and metribuzin in a fallow soil. Pestic. Sci. 13, 484–494. 1996. Persistence and leaching of atrazine in corn culture in the experimentel site of ‘la Coˆte St Andre´’ (Ise`re, France). Perrin-Ganier, C., Schiavon, M., Portal, J.M., Babut, M.,
Breu-zin, C., 1994. Alteration of pesticide content in the soil solu- Arch. Environ. Contam. Toxicol. 30, 203–212.
Villeneuve, J.P., Lafrance, P., Banton, O., Frechette, P., Robert, tion collected by a porous cup. Chemosphere 29 (1), 63–70.
Perrin-Ganier, C., Portal, J.M., Benoit, M., Schiavon, M., 1996. C., 1988. A sensitivity analysis of adsorption and degrada-tion parameters in the modelling of pesticide transport in Monitoring isoproturon leaching in the field by drainage
and porous cup sampling. Chemistry 32 (10), 2043–2048. soil. J. Contam. Hydrol. 3, 77–96.
Villeneuve, J.P., Banton, O., Lafrance, P., 1990. A probabilistic Pleasant, J.M., Burt, R.F., Frish, J.C., 1994. Integrating
mechanical and chemical weed management in corn (Zea approach for the groundwater vulnerability to contamina-tion by pesticides — the vulpest model. Ecol. Modell. 51,
mays). Weed Technol. 8, 217–223.
Sadeghi, A.M., Isensee, A.R., 1992. Effect of tillage systems 47–58. and rainfall patterns on atrazine distribution in soil. J.

![Fig. 2. Dynamics of atrazine residue concentrations (mg/l ) in porous cups according to the method of atrazine application [averageatrazine residue concentrations (mg/l): broadcast application: 1.95; band application+mechanical weeding: 0.52].](https://thumb-ap.123doks.com/thumbv2/123dok/3125760.1380216/5.842.118.439.53.243/concentrations-application-averageatrazine-concentrations-broadcast-application-application-mechanical.webp)