www.elsevier.nlrlocateraqua-online
Concentration of 22,23-dihydroavermectin B
1adetected in the sediments at an Atlantic salmon
farm using orally administered ivermectin to control
sea-lice infestation
Andrew Cannavan
a, Rosie Coyne
b, D. Glenn Kennedy
a,
Peter Smith
b,)a
Veterinary Sciences DiÕision, Department of Agriculture for Northern Ireland, Ireland
b
Fish Disease Group, Department of Microbiology, UniÕersity College Galway, Galway, Ireland
Accepted 2 July 1999
Abstract
An HPLC analytical method based on a methanol extraction, C clean-up, derivatization using8 trifluoroacetic acid anhydride and reverse-phase HPLC was developed for the detection of 22,23-dihydroavermectin B1a in marine sediment. The limit of quantitation was determined as
Ž .
0.93 ng 22,23-dihydroavermectin B1a H B2 1a per g of sediment. This method was used to determine the concentrations of H B2 1a in sediments taken from under a fish farm where ivermectin had been administered orally, at 0.05 mgrkg twice weekly, to control sea-lice infestation in 350,000 post-smolt Atlantic salmon. Prior to sampling, a total of 23 g of ivermectin had been administered during the current production cycle. The sediment was sampled using diver-collected cores at sample sites 25 m apart. The mean concentration of H B2 1adetected in the six sediment cores taken directly under the cage block was 5.0 ngrg in the top 3 cm, 3.1 ngrg in the 3–6 cm fraction and 0.7 ngrg in the 6–9 cm fraction. Concentrations were under the limit of quantitation at depths below 9 cm in all cores taken from directly under the cage block. H B2 1a was not detected in any samples taken further than 22.5 m from the cage block in the eastern, western and southern directions. To the north of the cage block, H B2 1awas detected in samples taken 31 m from the cage block and the limit of distribution in this direction was not established. Despite the limitations of this study, it is difficult to reconcile the concentrations of H B2 1a
)Corresponding author. Fax:q353-91-750514; E-mail: [email protected]
0044-8486r00r$ - see front matterq2000 Elsevier Science B.V. All rights reserved.
Ž .
detected in this study with long term accumulation and persistence of ivermectin in sediments under fish farms.q2000 Elsevier Science B.V. All rights reserved.
Keywords: Ivermectin; Analytical method; Marine sediment; Salmon farm; Environmental impact
1. Introduction
Ž .
Lunestad 1992 argued that the majority of chemotherapeutants orally administered to fish in marine cage farms will leave the cages and enter the environment. Variations in the bioavailability of therapeutic agents will alter the kinetics with which they leave the farms but will not necessarily alter the amount that does so. Unless an agent is significantly metabolised by the fish, it can be assumed that the quasi-totality of the administered chemical will, ultimately, enter the environment. In the majority of studies on the fate of orally administered chemotherapeutants, it has been a common assumption that a significant proportion of the agents will leave the cages associated with uneaten
Ž .
feed or with faeces Smith, 1996 . It has further been assumed that such particle associated chemicals will be deposited on the sediments under the farms. Therefore, the majority of the studies of the fate of chemotherapeutic agents has focused on the
Ž .
concentrations in these sediments that result from therapy. Smith 1996 has recently reviewed the data that have been presented from the study of 17 administrations of oxytetracycline in marine fish farms and has questioned the validity of the assumption that sediment deposition is the dominant fate of this agent.
Ž .
The data of Høie et al. 1990 indicated that ivermectin is excreted from fish in an unmodified form and therefore it is reasonable to assume that the quasi-totality of the
Ž . agent administered will enter the environment of the farm. Davies et al. 1998 have used a variety of modelling approaches to attempt an estimate of the concentrations of ivermectin that will accumulate in the sediment under fish farms. These estimates were, however, theoretical and there are at present no published data on the concentrations of orally administered ivermectin that accumulate in the sediments under farms.
This paper reports the concentration of 22,23-dihydroavermectin B1a detected at a farm using orally administered ivermectin as an agent to control sea-lice infestations in Atlantic salmon. Preliminary studies of the biological impact of this treatment have been
Ž . presented by Costelloe et al. 1998 .
2. Materials and methods
2.1. Farm stocking and treatment
The site at which this study was performed was located approximately 1 km off-shore on the west coast of Ireland. Between 7 and 12 March 1997, the site was stocked with
Ž .
that were surface coated with sufficient ivermectin to provide a dose of 0.05 mgrkg. The amount of ivermectin added to the feed was calculated from weekly estimations of fish weight. Farm records show that a total of 23 g of ivermectin were use at the farm between stocking and sampling.
2.2. Sample collection
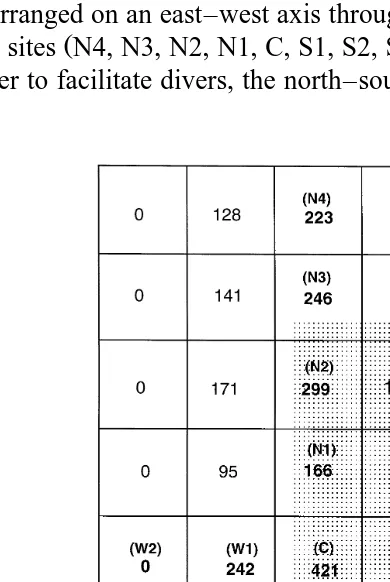
The cage block at the farm was 138 m=35 m in area and was arranged with its Ž
longest axis lying in a north–south direction. Seven sites E3, E2, E1, C, W1, W2 and
. Ž .
W3 were arranged on an east–west axis through the centre of the cage block Fig. 1 . A
Ž .
further nine sites N4, N3, N2, N1, C, S1, S2, S3 and S4 were aligned on a north–south axis. In order to facilitate divers, the north–south axis did not pass through the centre of
Ž .
Fig. 1. Estimates of total amount of 22,23-dihydroavermectin B1a H B2 1a detected at all depths in the sediment, with respect to the location of the cages of the Atlantic salmon farm. The area covered by the cages
Ž35 m=138 m is shaded. Each square represents 25 m of sediment. Numerical values refer to mg H B. 2 2 1a
estimated to be present in each 25-m square using data not corrected for analytical recovery. Numbers in bold
Ž .
the cage block but was offset 10 m to the west of the centre line. Sampling sites were 25 m apart and as the site C was common to both sampling axes a total of 15 sites were used. Sample sites were located using a weighted, measured rope placed on the sediment surface. Sediment sample cores were collected on 10 July 1997 by divers using 25 cm long plexiglass tubes of 4.5 cm internal diameter. A minimum of 15 cm sediment was collected in each core. Sediment cores were transported to the laboratory on ice and were vertically sectioned on the day of collection. Homogenised material from each
Ž .
3-cm section of each core was stored aty208C until it was analysed 4–6 weeks . Three samples cores, collected from the sediment at this farm in 1992 and 1993, were also analysed. These had been collected from a sample site approximately equivalent to the site C. These cores had been stored at y208C for 4 and 5 years prior to their analysis. As a result of the changes in the ownership of the farm, no detailed records were available of the amounts of ivermectin being administered at the time these samples were collected.
2.3. Current flow measurement
Current flows over a 24-h period were assessed from hourly readings taken with a
Ž .
directional meter B7M 008, Mark III, Valeport Marine Scientific, Dartmouth, UK . On the manufacturers recommendation the limit of quantitation of the current flow meter was taken to be 0.05 mrs. Current flow measurements were taken close to sample site N3 at 1 m below the surface and 1 m above the sediment.
2.4. Sediment density measurement
Ž To determine the density of the sediment, the vertical sections of sediment cores 3
. Ž .
cm deep were homogenised and triplicate aliquots approximately 15 g were intro-duced into preweighed 50 ml volumetric flasks. The weight of each sediment aliquot was determined by reweighing the flasks after the introduction of the sediment and then the sediment volume was determined by measuring the amount of water required to bring the total flask contents to 50 ml. The mean of the three determinations of the
Ž .
sediment density weightrvolume was calculated for each 3-cm vertical section made from the cores taken at E1 and N1.
2.5. Chromatographic materials
All solvents were of HPLC grade and other chemicals were of analytical reagent
Ž .
grade. Ivermectin was obtained from Merck Sharp and Dohme Hoddeston, UK . A
Ž .
stock standard solution 1 mgrml was prepared in methanol and stored at y208C. A
Ž .
dilute standard 100 ngrml was prepared by dilution of the stock standard in methanol and was shown to be stable for at least 3 months when stored at 48C. Working standards
Ž .
were prepared with each batch of test samples by evaporating aliquots 500ml of dilute standard solution to dryness at 708C under nitrogen. These were derivatised as described in Section 2.9 below. The standard was equivalent to a concentration of 18.6 ng
Ž .
2.6. HPLC system
The HPLC system consisted of a model L-6000 pump, AS 2000A autosampler, Ž
F-1050 fluorescence spectrophotometer, and D-2500 chromato-integrator Merck-Hitachi,
. Ž . Ž
Tokyo, Japan , and a Partisil 5 ODS-3 25=4.6 cm column Whatman, Clifton, NJ, .
USA . The excitation and emission wavelengths were set to 365 and 470 nm,
respec-Ž .
tively. The mobile phase was methanolrwater 95:5, vrv , degassed by filtration through a 0.45-mm filter under vacuum.
2.7. Sample extraction
Ž .
Sediment samples 5 g were weighed into 50-ml plastic centrifuge tubes. Spiked samples were prepared by adding an appropriate amount of ivermectin to known negative sediment samples taken from the core W5. The spiked samples were allowed to
Ž .
stand for 10 min before extraction. Methanol 10 ml was added and the tubes were capped and shaken vigorously on a mechanical shaker for 30 min. The tubes were
Ž . Ž .
centrifuged 600=g, 48C for 10 min and aliquots 5 ml of the supernatants transferred into 100=12 mm tubes. The extracts were evaporated to dryness at 708C under nitrogen
Ž .
and the residues redissolved in acetonitrilerwater 30:70, vrv containing 0.1% trieth-Ž .
ylamine 5 ml .
2.8. Sample clean-up
Ž .
Sample clean up was performed using Bond-Elut C8 3 ml disposable extraction
Ž . Ž .
columns Varian, Harbour City, CA, USA with a Vac-Elut vacuum manifold Varian fitted with stainless steel Luer stopcocks. Columns were conditioned immediately before
Ž . Ž .
use with acetonitrile 4 ml followed by acetonitrilerwater 30:70, vrv containing Ž .
0.1% triethylamine 5 ml and were not allowed to dry out before the application of sample extracts. The tubes containing the extracts were washed with acetonitrilerwater Ž30:70, vrv containing 0.1% triethylamine 2 ml and this was also applied to the. Ž . columns. The columns were dried under vacuum for 5 min and ivermectin was eluted
Ž . with acetonitrile 3 ml .
2.9. DeriÕatization
The eluates from the C columns were evaporated to dryness at 708 8C under nitrogen
Ž .
as were the working standards. The residues were dissolved in an aliquot 200 ml of
Ž . Ž .
1-methylimidazole Aldrich Chemical, UK in acetonitrile 1:1, vrv . Aliquots of 300
Ž .
ml of trifluoroacetic acid anhydride in acetonitrile 1:2, vrv were added and the tubes
Ž .
were capped and allowed to stand for a few minutes. Aliquots 200ml were transferred to autosampler vials for analysis.
2.10. HPLC analysis
Mobile phase was pumped through the system for 10 min to equilibrate the system Ž .
Ž . Ž . until reproducible peaks were obtained usually three injections . Aliquots 25ml of the samples were then injected, with a standard injection after every 4–5 samples. Results were expressed as ng H B2 1a per g sample by comparison with standards. When results from a number of samples were combined these were presented as means"SD.
Inter- and intra-assay precision and recovery were assessed by extracting and analysing replicates of known negative sediment, spiked with H B2 1a at 0.93 and 4.65 ngrg, on three separate occasions. Except when estimates of the total amount of H B2 1a present in the sediment were being made the analytical data were not corrected for analytical recovery.
3. Results
3.1. Validation
The results of inter- and intra-assay precision studies are presented in Table 1. No Ž .
Certified Reference Material CRM for ivermectin in marine sediment exists. Accord-ingly, the method was validated using known negative sediment samples fortified with ivermectin at two concentrations. Analysis of the data in this table using ANOVA demonstrated that, at both test concentrations, the variation in the assay performance on
Ž .
different days was not significant P)0.05 . The assay was shown to be linear by Ž
analysing a series of standards over the range 0–200 ngrml equivalent to 0–37.2 ngrg .
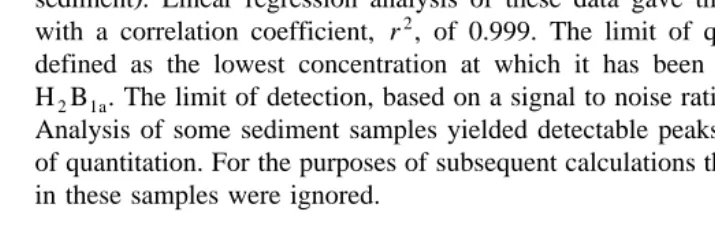
sediment . Linear regression analysis of these data gave the equation ys2.3 xy1.0 with a correlation coefficient, r2, of 0.999. The limit of quantitation of the method, defined as the lowest concentration at which it has been validated, was 0.93 ngrg H B . The limit of detection, based on a signal to noise ratio of 3:1, was2 1a -0.5 ngrg. Analysis of some sediment samples yielded detectable peaks that were below the limit of quantitation. For the purposes of subsequent calculations the concentrations of H B2 1a in these samples were ignored.
Table 1
Validation data on the analytical method for the detection of 22,23-dihydroavermectin B1ain sediments
Ž .
Nominal Test n Measured concentration Percent recovery CV %
concentration Žngrg. Mean SD
Žngrg.
Mean SD
0.93 1 4 0.76 0.02 81.8 2.5 3.0
2 4 0.73 0.08 78.5 8.6 11.0
3 5 0.74 0.09 79.3 9.3 11.7
All 13 0.74 0.07 79.8 7.1 8.9
4.65 1 5 4.06 0.17 87.3 3.8 4.3
2 5 3.90 0.17 83.8 3.7 4.4
3 7 4.04 0.48 86.8 10.3 11.8
3.2. Current flow
Data acquired in the current flow study are shown in Fig. 2. In analysing these data,
Ž .
all currents below 0.05 mrs were ignored. At the surface Fig. 2a , the median speed was 0.06 mrs and speeds over 0.1 mrs were recorded on only 4 of the 24 measure-ments. At this depth the fastest currents were in a southeasterly direction. At the
Ž .
sediment surface Fig. 2b , the median current flow was 0.06 mrs and only on five occasions were speeds over 0.1 mrs recorded. At this depth the dominant movement of the current was in the westerly and southwesterly direction. As analysis was confined to a single 24-h period these data can only provide an indication of the water movements occurring at the site.
3.3. Sediment properties
All sediment cores were composed primarily of grey-brown shell sand and there was little evidence of sulphide-induced blackening. The average of the mean density of the two sediment cores analysed increased with the depth and was 1.4 grcm3 in the top 3 cm and 1.5 grcm3, 1.7 grcm3 and 1.7 grcm3, respectively, in the subsequent 3 cm sections.
3.4. Concentrations of H B2 1a
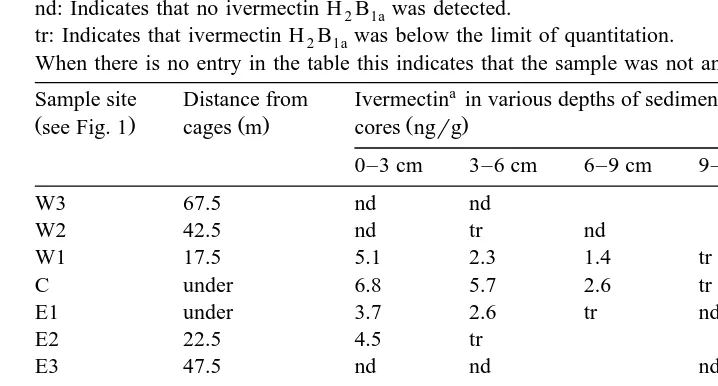
The results of the analysis of the sediment cores are shown in Table 2. Given the absence of CRMs for ivermectin in sediment these data have not been corrected for analytical recovery. Six of the sediment cores were collected from directly under the cages. In the top 3 cm of these cores, the mean concentration of H B2 1awas 5.0"1.5 Ž"SD ng. rg and in the 3–6 cm section it was 3.1"1.4 ngrg. In the 6–9 cm section,
Fig. 2. Hourly current speed and direction in the vicinity of an Atlantic salmon farm. The data were collected
Ž . Ž .
close to sample site N3 see Fig. 1 . Current speeds under 0.05 mrs are not shown. a Currents measured 1 m
Ž .
Table 2
Ž .
Concentration of 22,23-dihydroavermectin H B2 1a B1adetected in the sediment cores from under and near an Atlantic salmon farm
nd: Indicates that no ivermectin H B2 1awas detected.
tr: Indicates that ivermectin H B2 1awas below the limit of quantitation.
When there is no entry in the table this indicates that the sample was not analysed.
a
Sample site Distance from Ivermectin in various depths of sediment Total ivermectin
2
Ivermectin measured as H B . Concentrations are not corrected for analytical recovery.2 1a
the concentration of H B2 1awas above the limit of quantitation in only two of the six cores. In the five cores taken outside the edges of the cage block, the mean concentra-tion in the top 3 cm was 4.8"0.7 ngrg and 1.9"1.1 ngrg in the 3–6 cm section. In the 6–9 cm and the 9–12 cm sections of these five cores, the concentrations of H B2 1a were over the limit of quantitation in only one of the cores.
3.5. Horizontal distribution of H B2 1a
H B2 1awas detected in all cores taken from under the cage block. In the easterly and westerly directions, H B2 1awas detected in cores E2 and W1, taken 22.5 m and 17.5 m from the edge of the cage block, respectively, but not in E3 and W2 taken 47.5 m and 42.5 m from the edge of the cages. In the southerly direction, H B2 1awas detected in the
Ž . Ž .
sediment core S3 taken 6 m outside the cages but not in the core S4 taken 31 m Ž .
away. In the northern direction, however, H B2 1awas detected in the core N4 taken 31 m from the edge of the cages and the limit of deposition was not detected in this direction.
3.6. Vertical distribution of H B2 1a
the sediment density at different depths in the cores allowed the calculation of the percentage of the total ivermectin present in the cores that was present in each of the 3-cm vertical sections. When all 11 positive samples are considered, the top 3 cm contained 58%, the 3–6 cm section 33%, the 6–9 cm section 7.4% and 9–12 cm section 1.9%. When only the sediments taken directly under the cages are considered, the relevant figures were 52%, 36%, 12% and, in these samples, none of the cores contained quantifiable concentrations in their 9–12 cm sections.
3.7. Estimation of amount of H B2 1a per surface area
The right hand column of Table 2 presents the amount of ivermectin calculated to be present in each core. These data are expressed as ng H B under each cm2 of the core
2 1a
surface. They were obtained using the concentrations detected in the 3-cm sections of
Ž .
each core and the mean densities of the under cage sediments see Section 3.3 . In the cores taken from under the cages, the estimated amounts varied from 67.5 ngrcm2 in
Ž . 2
the centre core c to 22.9 ngrcm for core S2.
3.8. Analysis of sediment cores after long-term storage
Analysis of the top 2 cm of the three sediment samples that had been collected from the farm and stored for 4 or 5 years revealed H B2 1a concentrations of 5.6 ngrg, 1.4 ngrg and 1.8 ngrg. It must be stressed that no determination of the effect of long-term storage on the stability of H B2 1a has been performed and the assay used here has not been validated for the analysis of samples that have been stored for this length of time under these conditions.
4. Discussion
The data presented in Table 1 demonstrate that the precision of the assay procedure developed in this work was satisfactory. The limit of quantitation of the assay, 0.93 ngrg, was similar to those previously reported for the detection of H B2 1a in fish tissue ŽKennedy et al., 1993; Roth et al., 1993 ..
There are no other published studies of the concentrations of H B2 1a that have been detected in sediments under commercial farms using this agent. Stephen and Iwama Ž1997 have, however, quoted unpublished work by Kwok who, using an analytical. method with a limit of quantitation of 10 ngrg, failed to detect any H B2 1a residues in farm sediments. A previous Irish study, using a method with a limit of quantitation of 50 ngrg, failed to detect H B2 1a in sediments under cages where ivermectin therapy was
Ž .
being used Nixon, E., pers. comm. . These unpublished results are, therefore, not inconsistent with the data presented in this paper. Ivermectins have a high affinity for
Ž . Ž . Ž .
soils KDs227–333 and organic matter Kocs12,600–15,700 Halley et al., 1989b . In considering the chemical concentrations reported in this paper, it should be noted that there are considerable data that the biological activity of ivermectin is considerably
Ž
.
1989; Davies et al., 1998 . The concentrations reported in this paper, therefore, have an unknown quantitative relationship to the biological activity of the residues present in the sediment.
The pattern of the distribution of ivermectin in the sediments at this farm clearly demonstrates that residues are only found in the close proximity of the cages themselves. With respect to its extension in the western, southern and eastern directions, the sampling programme allowed the determination of the limit of detectable residues. In each of these directions, no trace of H B2 1awas detectable in cores taken further than 22.5 m from the edge of the cage block. To the north, the horizontal limit of deposition
Ž .
was not detected. Residues 5.4 ngrg in the top 3 cm were detected in sample N4 which was 31 m from the edge of the cages.
With respect to its vertical distribution, these data demonstrated that, even after approximately 4 months recent use, H B2 1awas primarily located in the top 3 cm of the
Ž . sediments and that little or none was present below 9 cm. Samuelsen et al. 1992 have argued that the primary factor leading to the appearance of chemotherapeutants in lower sediment depths is the deposition of additional feed material onto the sediment. Coyne et
Ž .
al. 1994b have, however, argued that, if infaunal polychaetes are present, bioturbation will result in the continual mixing of the upper 10 cm of the sediment and that this
Ž . process will limit any burying of chemicals in the sediment. Costelloe et al. 1998 have presented studies of the species distribution recorded at this farm on the same day as the analyses reported here. These studies revealed extensive polychaete populations in the
Ž
sediments under the cages. The mean worm densities reported Capitella cf. capitata,
2 2 2.
2503r0.1 m ; Malacoceros fuligenosus, 1985r0.1 m ; Anaitides mucosa, 693r0.1 m would have been adequate to maintain mixing in the upper 10 cm of the sediments. The vertical distribution of H B2 1a reported here can be compared with the data on the
Ž .
vertical distribution of oxytetracycline reported by Samuelsen et al. 1992 , Coyne et al. Ž1994a and Capone et al. 1996 . Each of these three studies demonstrated that the. Ž . majority of the chemotherapeutant was confined to the top 6 cm of the sediment.
4.1. Estimation of the total amount of iÕermectin detected
The right hand column of Table 2 presents the H B2 1a detected in each sediment expressed as ng per cm2 of sediment surface. To estimate the total amount of H B2 1a detected under the farm, it was considered reasonable to treat each sample as
representa-2 Ž .
tive of the 625 m sector in which they are set Fig. 1 . The contents of each of these 625 m2 sectors was calculated by multiplying the figures in Table 2 by 6,250,000. A sufficiently accurate estimate of the amounts of H B2 1a in sectors of the under-farm sediment not containing a sample site is more difficult. The approach that has been taken
sector C. The result of these estimates is presented in Fig. 1. Summing the estimated contents of all the sectors suggests that the data collected in this survey can account for the presence of approximately 4.26 g of H B . It should be noted that the number of2 1a assumptions that have been made in estimating this figure suggests that it cannot be assumed to have a high degree of accuracy.
The failure to detect the northern limit of the deposition of H B2 1a places a further limitation of the confidence which can be given to the estimate of 4.26 g as the total amount of this chemical in the under farm sediment. The four most northerly sectors shown in Fig. 1, those on an east–west axis through N4, were estimated to contain 128 mg, 223 mg, 90 mg and 61 mg. Thus, these four sectors were estimated to contain 502 mg or 12% of the total H B2 1adetected under the farm. In the admittedly limited studies
Ž .
of current flow Fig. 2a and b , no significant northerly movement was detected at either depth at which measurements were taken. This suggests that it is reasonable to assume that the row of four sectors immediately to the north of N4 would not contain more than 500 mg H B . If this assumption is valid it suggests that the error in the estimate of2 1a 4.26 g, deriving from the failure to determine the northern limit, is probably less than 12%. If an allowance for an additional 12% is made, then the estimate of the total sediment loading would be 4.77 g.
It should be noted that all the above estimates of the amounts of H B2 1aare based on data that were not corrected for analytical recovery. In attempting any total budget it would, however, seem reasonable to make some attempt to correct for this factor from the data presented in Table 2 and Fig. 1. The average recovery from spiked samples was
Ž .
approximately 83% Table 1 . This suggests that the 4.26 g of H B2 1a detected might indicate that a reasonable estimate of the amount present would be to 5.13 g H B2 1aand that the higher estimate of 4.77 g would be equivalent to 5.75 g.
Although the sampling programme used in this study cannot establish that all the H B2 1a estimated to be present in the sediment was introduced during the current production cycle it is still of interest to compare these estimates with the amount of ivermectin administered. Between 12 March and 10 July, farm records demonstrate that feed containing a total of 23 g of ivermectin was presented to the fish. As the minimum
Ž .
percentage of H B2 1a present in ivermectin is 80% Campbell, 1989 , the administration of 23 g of ivermectin can be considered as equivalent to an input of 18.4 g H B . The2 1a estimate of 5.13 g H B2 1a as the total amount in the sediment, therefore, represents approximately 28% of the total H B2 1aadministered in the current production cycle. The higher estimate of 5.75 g represents 31%. As discussed above, both the values 5.13 g and 5.75 g are estimates based on the application of a number of assumptions to data generated from the analysis of a limited number of samples. Thus, these calculations represent, at best, only approximate estimates of the percentage of the input that can be found in the sediment. They are, however, sufficient to raise questions as to the validity
Ž .
of the assumption underlying the models used by Davies et al. 1998 to estimate the predictive environmental concentrations of ivermectin. These models assume that 100% of ivermectin administered to fish is deposited on the sediments.
Considerations of the physical and chemical properties of ivermectin have led Roth et Ž .
these studies were made suggests that ivermectin therapy has been routinely used to treat first sea-summer fish at this site for 9 years. Although the validity of the data generated by the analysis of cores that have been stored for long periods aty208C is unknown, the detection of 5.6 ngrg, 1.9 ngrg and 1.4 ngrg in samples taken in 1992 and 1993 does confirm that the sediments have been exposed to H B2 1a over a significant period. The main study reported here, however, presents the analysis of cores collected on one day. Thus, the data generated cannot be used to estimate changes in H B2 1a concentra-tions over time. Not withstanding these limitaconcentra-tions it is, however, difficult to reconcile the concentrations of H B2 1a detected in this study with the concept of a long-term accumulation and persistence of the agent in sediments under fish farms.
References
Campbell, W.C., 1989. Ivermectin and Abamectin. Springer, New York.
Capone, D.G., Weston, D.P., Miller, V., Shoemaker, C., 1996. Antibacterial residues in marine sediments and invertebrates following chemotherapy in aquaculture. Aquaculture 145, 55–75.
Costelloe, M., Costelloe, J., O’Connor, B., Smith, P., 1998. Densities of polychaetes in sediments under a salmon farm using ivermectin. Bull. Euro. Assoc. Fish Pathol. 18, 1–4.
Coyne, R., Smith, P., 1996. Quantitation of sediment loading by oxytetracycline under a marine salmon farm.
Ž .
In: Haagsma, N., Ruiter, A. Eds. , Residues of Veterinary Drugs in Food. Euroresidue 111, Veldhoven, The Netherlands, Vol. 1, pp. 357–361.
Coyne, R., Hiney, M.P., O’Connor, B., Kerry, J., Cazabon, D., Smith, P., 1994a. Concentration and persistence of oxytetracycline in sediments under a marine salmon farm. Aquaculture 123, 31–42. Coyne, R., Hiney, M., Smith, P., 1994b. Evidence associating overfeeding on a salmon farm with a prolonged
half-life of oxytetracycline in under-cage sediments. Bull. Euro. Assoc. Fish Pathol. 14, 207–210. Davies, I.M., Gillibrand, P.A., McHenery, J.G., Rae, G.H., 1998. Environmental risk of ivermectin to
sediment dwelling organisms. Aquaculture 163, 29–46.
Halley, B.A., Jacob, T.A., Lui, A.Y.H., 1989a. The environmental impact of the use of ivermectin: environmental effects and fate. Chemosphere 18, 1543–1563.
Halley, B.A., Nessel, R.J., Lu, A.Y.H., 1989b. Environmental aspects of ivermectin use in livestock: general
Ž .
considerations. In: Campbell, W.C. Ed. , Ivermectin and Abamectin. Springer, New York, pp. 162–172.
Ž .
Høie, T., Horsberg, T.E., Nafstad, I., 1990. The disposition of ivermectin in Atlantic salmon Salmo salar . Pharmacol. Toxicol. 67, 307–312.
Kennedy, D.G., Cannavan, A., Hewitt, S.A., Rice, D.A., Blanchflower, W.J., 1993. Determination of
Ž .
ivermectin residues in the tissues of Atlantic salmon Salmo salar using HPLC with fluorescence detection. Food Addit. Contam. 10, 579–584.
Lunestad, B.T., 1992. Fate and effects of antibacterial agents in aquatic environments. In: Michel, C.M.,
Ž .
Alderman, D.J. Eds. , Chemotherapy in Aquaculture: From Theory to Reality. Office Internationale des Epizooties, Paris, pp. 151–161.
Ž .
Roth, M., Rae, G., McGill, A.S., Young, K.W., 1993. Ivermectin depuration in Atlantic salmon Salmo salar . J. Agric. Food Chem. 41, 2434–2436.
Samuelsen, O.B., Torsvik, V., Ervik, A., 1992. Long-range changes in oxytetracycline concentration and bacterial resistance towards oxytetracycline in a fish farm sediment after medication. Sci. Total. Environ. 114, 25–36.
Smith, P., 1996. Is sediment deposition the dominant fate of oxytetracycline used in marine fish farms; a review of available evidence. Aquaculture 146, 157–169.
Stephen, C., Iwama, G., 1997. Salmon Aquaculture Review; Part C. Environmental Assessment Office, British Columbia, Victoria.
Wislocki, L.S., Grosso, L.S., Dybas, R.A., 1989. Environmental aspects of Abamectin use in crop protection.
Ž .