Inside Windows
®Debugging
Published with the authorization of Microsoft Corporation by: O’Reilly Media, Inc.
1005 Gravenstein Highway North Sebastopol, California 95472
Copyright © 2012 by Tarik Soulami
All rights reserved. No part of the contents of this book may be reproduced or transmitted in any form or by any means without the written permission of the publisher.
ISBN: 978-0-7356-6278-0
1 2 3 4 5 6 7 8 9 LSI 6 5 4 3 2 1
Printed and bound in the United States of America.
Microsoft Press books are available through booksellers and distributors worldwide. If you need support related to this book, email Microsoft Press Book Support at [email protected]. Please tell us what you think of this book at http://www.microsoft.com/learning/booksurvey.
Microsoft and the trademarks listed at http://www.microsoft.com/about/legal/en/us/IntellectualProperty/ Trademarks/EN-US.aspx are trademarks of the Microsoft group of companies. All other marks are property of their respective owners.
The example companies, organizations, products, domain names, email addresses, logos, people, places, and
events depicted herein are fictitious. No association with any real company, organization, product, domain name,
email address, logo, person, place, or event is intended or should be inferred.
This book expresses the author’s views and opinions. The information contained in this book is provided without any express, statutory, or implied warranties. Neither the authors, O’Reilly Media, Inc., Microsoft Corporation, nor its resellers, or distributors will be held liable for any damages caused or alleged to be caused either directly or indirectly by this book.
Acquisitions Editor: Russell Jones Developmental Editor: Russell Jones Production Editor: Melanie Yarbrough Editorial Production: Waypoint Press Technical Reviewer: John Mueller Copyeditor: Roger LeBlanc Indexer: Christina Yeager
Contents at a Glance
Foreword
xvIntroduction
xviiPART I A BIT of BACkgRounD
ChapTer 1 Software Development in Windows 3
PART II DEBuggIng foR fun AnD PRofIT
ChapTer 2 Getting Started 33
ChapTer 3 how Windows Debuggers Work 85
ChapTer 4 postmortem Debugging 125
ChapTer 5 Beyond the Basics 159
ChapTer 6 Code analysis Tools 195
ChapTer 7 expert Debugging Tricks 219
ChapTer 8 Common Debugging Scenarios, part 1 267
ChapTer 9 Common Debugging Scenarios, part 2 323
ChapTer 10 Debugging System Internals 365
PART III oBsERvIng AnD AnAlyzIng sofTwARE BEhAvIoR
ChapTer 11 Introducing Xperf 391
ChapTer 12 Inside eTW 415
ChapTer 13 Common Tracing Scenarios 457
appenDIX a WinDbg User-Mode Debugging Quick Start 505
appenDIX B WinDbg Kernel-Mode Debugging Quick Start 519
Contents
Foreword . . . .xv
Introduction . . . .xvii
Who Should Read This Book . . . xviii
Assumptions . . . xviii
Organization of This Book . . . xviii
Conventions in This Book . . . .xix
System Requirements . . . xx
Code Samples . . . xxi
Installing the Code Samples . . . xxi
Running the Code Samples . . . xxii
Acknowledgments . . . xxvi
Errata & Book Support . . . xxvii
We Want to Hear from You . . . xxvii
Stay in Touch . . . xxviii
PART I
A BIT of BACkgRounD
Chapter 1 software Development in windows
3
Windows Evolution . . . 3Windows Release History . . . 3
Supported CPU Architectures . . . 4
Windows Build Flavors . . . 5
Windows Servicing Terminology . . . 6
Windows Architecture . . . 7
Kernel Mode vs. User Mode . . . 8
User-Mode System Processes . . . 9
User-Mode Application Processes . . . 10
Low-Level Windows Communication Mechanisms . . . .13
vi
Developer Documentation Resources . . . 16
WDM, KMDF, and UMDF . . . 17
The NTDLL and USER32 Layers . . . .18
The Win32 API Layer . . . .18
The COM Layer . . . .19
The CLR (.NET) Layer . . . .25
Microsoft Developer Tools . . . .28
The Windows DDK (WDK) . . . .29
The Windows SDK . . . .29
Summary. . . .30
PART II
DEBuggIng foR fun AnD PRofIT
Chapter 2 getting started
33
Introducing the Debugging Tools . . . .34Acquiring the Windows Debuggers Package . . . .34
Acquiring the Visual Studio Debugger . . . .38
Comparing the WinDbg and Visual Studio Debuggers . . . .38
User-Mode Debugging . . . .39
Debugging Your First Program with WinDbg . . . .39
Listing the Values of Local Variables and Function Parameters . . . . 47
Source-Level Debugging in WinDbg . . . .52
Symbol Files, Servers, and Local Caches . . . .53
Caching Symbols Offline for WinDbg . . . 55
Troubleshooting Symbol Resolution Issues in WinDbg . . . .56
Name Decoration Considerations . . . .57
Getting Help for WinDbg Commands . . . .58
Kernel-Mode Debugging . . . .60
Your First (Live) Kernel Debugging Session . . . 61
Setting Up a Kernel-Mode Debugging Environment Using Physical Machines . . . .67
Diagnosing Host/Target Communication Issues . . . 76
Understanding the KD Break-in Sequence . . . .77
Controlling the Target in the Kernel Debugger . . . 78
Setting Code Breakpoints in the Kernel Debugger . . . 81
Getting Help for WinDbg Kernel Debugging Commands . . . .83
Summary. . . .83
Chapter 3 how windows Debuggers work
85
User-Mode Debugging . . . .85Architecture Overview. . . .86
Win32 Debugging APIs . . . .87
Debug Events and Exceptions . . . .88
The Break-in Sequence . . . .91
Setting Code Breakpoints . . . .93
Observing Code Breakpoint Insertion in WinDbg . . . 93
Kernel-Mode Debugging . . . .98
Architecture Overview. . . .98
Setting Code Breakpoints . . . .100
Single-Stepping the Target . . . .100
Switching the Current Process Context . . . .101
Managed-Code Debugging . . . .103
Architecture Overview. . . .103
The SOS Windows Debuggers Extension . . . .106
Script Debugging . . . .112
Architecture Overview. . . .112
Debugging Scripts in Visual Studio . . . .114
Remote Debugging . . . .116
Architecture Overview. . . .116
Remote Debugging in WinDbg . . . .117
Remote Debugging in Visual Studio . . . .121
viii
Chapter 4 Postmortem Debugging
125
Just-in-Time Debugging . . . .125
Your First JIT Debugging Experiment . . . .126
How Just-in-Time Debugging Works . . . .128
Using Visual Studio as Your JIT Debugger . . . .132
Run-Time Assertions and JIT Debugging . . . .138
JIT Debugging in Session 0 . . . .139
Dump Debugging . . . .139
Automatic User-Mode, Crash-Dump Generation . . . .139
Analyzing Crash Dumps Using the WinDbg Debugger . . . .143
Analyzing Crash Dumps in Visual Studio . . . .150
Manual Dump-File Generation . . . .151
“Time Travel” Debugging . . . .153
Kernel-Mode Postmortem Debugging . . . .153
Summary. . . .157
Chapter 5 Beyond the Basics
159
Noninvasive Debugging . . . .159Data Breakpoints . . . .162
Deep Inside User-Mode and Kernel-Mode Data Breakpoints . . . .163
Clearing Kernel-Mode Data Breakpoints . . . .165
Execution Data Breakpoints vs. Code Breakpoints . . . .166
User-Mode Debugger Data Breakpoints in Action: C++ Global Objects and the C Runtime Library . . . .168
Kernel-Mode Debugger Data Breakpoints in Action: Waiting for a Process to Exit . . . .170
Advanced Example: Who Is Changing a Registry Value? . . . .172
Scripting the Debugger . . . .176
Replaying Commands Using Debugger Scripts . . . 176
Debugger Pseudo-Registers . . . .178
Resolving C++ Template Names in Debugger Scripts . . . .180
WOW64 Debugging . . . .183
The WOW64 Environment . . . .183
Debugging of WOW64 Processes . . . .184
Windows Debugging Hooks (GFLAGS) . . . .187
Systemwide vs. Process-Specific NT Global Flags . . . .187
The GFLAGS Tool . . . .188
The !gflag Debugger Extension Command . . . .191
Impact of User-Mode Debuggers on the Value of the NT Global Flag . . . .193
The Image File Execution Options Hooks . . . .193
Summary. . . .194
Chapter 6 Code Analysis Tools
195
Static Code Analysis . . . .195Catching Your First Crashing Bug Using VC++ Static Code Analysis . . . .196
SAL Annotations . . . .199
Other Static Analysis Tools . . . .202
Runtime Code Analysis . . . .206
Catching Your First Bug Using the Application Verifier Tool . . . . .206
A Behind-the-Scenes Look: Verifier Support in the Operating System . . . .209
The !avrf Debugger Extension Command . . . .214
The Application Verifier as a Quality Assurance Tool . . . .217
Summary. . . .217
Chapter 7 Expert Debugging Tricks
219
Essential Tricks . . . .220Waiting for a Debugger to Attach to the Target . . . .220
Breaking on DLL Load Events . . . .222
Debugging Process Startup . . . .227
x
More Useful Tricks . . . .245
Debugging Error-Code Failures . . . .245
Breaking on First-Chance Exception Notifications . . . .252
Freezing Threads . . . .253
Kernel-Mode Debugging Tricks . . . .255
Breaking on User-Mode Process Creation . . . .255
Debugging the Startup of User-Mode Processes . . . .259
Breaking on DLL Load Events . . . .260
Breaking on Unhandled SEH Exceptions . . . .262
Freezing Threads . . . .262
Summary. . . .265
Chapter 8 Common Debugging scenarios, Part 1
267
Debugging Access Violations . . . .267Understanding Memory Access Violations . . . .268
The !analyze Debugger Extension Command . . . .269
Debugging Heap Corruptions . . . .271
Debugging Native Heap Corruptions . . . .271
Debugging Managed (GC) Heap Corruptions . . . .281
Debugging Stack Corruptions . . . .291
Stack-Based Buffer Overruns . . . .291
Using Data Breakpoints in Stack Corruption Investigations . . . .294
Reconstructing Call Frames from Corrupted Stacks . . . .295
Debugging Stack Overflows . . . .297
Understanding Stack Overflows . . . .297
The kf Debugger Command . . . .299
Debugging Handle Leaks . . . .300
A Handle Leak Example . . . .300
The !htrace Debugger Extension Command . . . .302
Debugging User-Mode Memory Leaks . . . .307
Detecting Resource Leaks Using the Application Verifier Tool . . .307
Investigating Memory Leaks Using the UMDH Tool . . . .310
Debugging Kernel-Mode Memory Leaks . . . .316
Kernel Memory Basics . . . .316
Investigating Kernel-Mode Leaks Using Pool Tagging . . . .318
Summary. . . .322
Chapter 9 Common Debugging scenarios, Part 2
323
Debugging Race Conditions . . . .323Shared-State Consistency Bugs . . . .324
Shared-State Lifetime Management Bugs . . . .330
DLL Module Lifetime-Management Bugs . . . .340
Debugging Deadlocks . . . .343
Lock-Ordering Deadlocks . . . .344
Logical Deadlocks . . . .348
Debugging Access-Check Problems . . . .352
The Basic NT Security Model . . . .353
Windows Vista Improvements . . . .358
Wrapping Up . . . .362
Summary. . . .363
Chapter 10 Debugging system Internals
365
The windows Console subsystem . . . . 365The Magic Behind printf . . . . 366
Handling of Windows UI Events . . . .373
Handling of the Ctrl+C Signal . . . 374
Anatomy of System Calls . . . .380
The User-Mode Side of System Calls . . . .381
The Transition into Kernel Mode . . . .383
The Kernel-Mode Side of System Calls . . . .385
xii
PART III
oBsERvIng AnD AnAlyzIng sofTwARE BEhAvIoR
Chapter 11 Introducing Xperf
391
Acquiring Xperf . . . .391
Your First Xperf Investigation . . . .396
Devising an Investigation Strategy . . . .397
Collecting an ETW Trace for the Scenario . . . .397
Analyzing the Collected ETW Trace . . . .399
Xperf’s Strengths and Limitations . . . .411
Summary. . . .412
Chapter 12 Inside ETw
415
ETW Architecture . . . .416ETW Design Principles . . . .416
ETW Components . . . 417
The Special NT Kernel Logger Session . . . .418
Configuring ETW Sessions Using Xperf . . . .419
Existing ETW Instrumentation in Windows . . . .422
Instrumentation in the Windows Kernel . . . .422
Instrumentation in Other Windows Components . . . .426
Understanding ETW Stack-Walk Events . . . .431
Enabling and Viewing Stack Traces for Kernel Provider Events . . .432
Enabling and Viewing Stack Traces for User Provider Events . . . . .434
Diagnosing ETW Stack-Trace Issues . . . .436
Adding ETW Logging to Your Code . . . .441
Anatomy of ETW Events . . . .441
Logging Events Using the ETW Win32 APIs . . . .445
Boot Tracing in ETW . . . .449
Logging Kernel Provider Events During Boot . . . .450
Logging User Provider Events During Boot . . . .452
Chapter 13 Common Tracing scenarios
457
Analyzing Blocked Time. . . .458
The CSwitch and ReadyThread ETW Events . . . .459
Wait Analysis Using Visual Studio 2010 . . . .461
Wait Analysis Using Xperf . . . .467
Analyzing Memory Usage . . . .473
Analyzing High-Level Memory Usage in a Target Process . . . 474
Analyzing NT Heap Memory Usage . . . .475
Analyzing GC Heap (.NET) Memory Usage . . . .481
Tracing as a Debugging Aid . . . .490
Tracing Error Code Failures . . . .490
Tracing System Internals . . . .494
Summary. . . .502
Chapter 14 winDbg user-Mode Debugging Quick start
505
Starting a User-Mode Debugging Session . . . .505Fixing the Symbols Path . . . .505
Fixing the Sources Path . . . .506
Displaying the Command Line of the Target Process . . . .507
Control Flow Commands . . . .507
Listing Loaded Modules and Their Version . . . .508
Resolving Function Addresses . . . .509
Setting Code (Software) Breakpoints . . . .509
Setting Data (Hardware) Breakpoints . . . .510
Switching Between Threads . . . .511
Displaying Call Stacks . . . .511
Displaying Function Parameters . . . .512
Displaying Local Variables . . . .513
What do you think of this book? We want to hear from you! Microsoft is interested in hearing your feedback so we can continually improve our books and learning resources for you. To participate in a brief online survey, please visit:
microsoft.com/learning/booksurvey
Navigating Between Call Frames . . . .514
Listing Function Disassembly . . . .515
Displaying and Modifying Memory and Register Values . . . .516
Ending a User-Mode Debugging Session . . . .518
Chapter 15 winDbg kernel-Mode Debugging Quick start
519
Starting a Kernel-Mode Debugging Session . . . .519Switching Between CPU Contexts . . . .519
Displaying Process Information . . . .520
Displaying Thread Information . . . .521
Switching Process and Thread Contexts . . . .522
Listing Loaded Modules and Their Version . . . .523
Setting Code (Software) Breakpoints Inside Kernel-Mode Code . . . .524
Setting Code (Software) Breakpoints Inside User-Mode Code . . . .525
Setting Data (Hardware) Breakpoints . . . .525
Ending a Kernel-Mode Debugging Session . . . .526
Index 527
Foreword
L
ike many others, I am a firm believer in using tools to expand our understandingof how systems really work. In fact, I began my career as a performance tools developer. My boss at that time had many simple sayings; among them was one of my favorites, “Our team is only as good as our people and our people are only as good as our tools.” As a manager, I’ve made it a priority to ensure we dedicate many of our top engineers to tools development and I have always encouraged using tools to teach and grow engineers.
Teaching books such as Tarik’s are meant to help improve the productivity,
understanding, and confidence of others. Being an individual who has had both a
lifelong passion for tools and learning, as well as someone who has spent more than a decade and a half working in Windows, it is an honor and a pleasure for me to write the foreword to Tarik’s insightful book.
For decades, the Windows team has worked tirelessly to improve the core capabilities of the platform and to make it more suitable for increasingly diverse
hardware configurations and software stacks. This hard work has paid off; Windows
today is the preeminent platform for developers, consumers, and businesses across the globe. With more than 1 billion PCs and customers, Windows is both the market- leading server and client computing platform. Variants of Windows run on small form-factor mobile devices, within embedded intelligent systems, on uniform and non-uniform (NUMA) memory architectures, on the XBOX gaming console, and on single CPU systems as well as those with hundreds of processors. Windows runs in
clustered configurations with failover capabilities and sits atop hypervisors and Virtual
Machines. And of course, Windows is in the cloud.
Enormous platform success and diversity can be accompanied by an equally enormous and diverse set of technical challenges. Thousands of engineers at Microsoft, and tens to hundreds of thousands outside of Microsoft, are involved in building,
debugging, and troubleshooting a multitude of diverse configurations and solutions.
xvi
To that end, Tarik has done an excellent job in detailing how a set of key
foundational Windows tools work. In detailing these tools, Tarik succeeds in expanding the reader’s awareness of key operating system concepts, architectures, strengths, and limitations. With the concepts understood and the tools mastered, readers can expect to be able to tackle all types of performance and debugging challenges. I believe Tarik’s book will become a staple for a broad set of individuals, from novices to experts.
Introduction
O
ne exciting aspect of software programming is that there are usually many ways to accomplish the same goal. Unfortunately, this also presents software engineers with unique challenges when trying to make the best design or implementation choice for each situation. Experience plays a major role, and the learning process is often progressive as one learns to avoid past mistakes. Sadly, though, experience is often a variable concept. I have met several software engineers who, after spending a very long time working on an area, still lacked a basic understanding of how it really worked beyond the repetitive day-to-day tasks they grew accustomed to. I have also met otherswho have perfected their craft in a field after only a few years of working experience.
This book introduces a few techniques for methodically approaching software development problems primarily using the two “Swiss Army knives” of expert Microsoft Windows developers—namely, the Windows debuggers (WinDbg) and the Windows Performance Toolkit (Xperf). By focusing on why features and components work the way they do in the system rather than simply on how they work or what they do, this book tries to accelerate the process of learning by experience and to minimize the number of mistakes made when approaching new problems. An important part of the process is learning to compare and contrast with known solutions to existing ones.
Software engineering is still inherently a practical science. (Some might even argue it’s an art rather than a science.) While there is certainly no substitute for real
experi-ence, the topic can definitely be approached with the same methodical persistence that works so well for other scientific disciplines. In fact, this approach works even better in
software engineering because all behaviors can be explained rationally. After all, it is all just code—whether it’s your own code or code written by others that you end up consuming in your software—and code can always be traced and understood.
Although this book deals with several architectural pillars of the Windows operating system as part of its debugging and tracing experiments, my main goal in writing it is less about covering those details and more about encouraging and developing this critical mindset. I hope to demonstrate how this approach can be used for solving a few interesting problems as part of this book, and that you continue to systematically apply debugging and tracing as you expand your learning beyond the topics directly covered here.
This book is not really about teaching native or managed code programming, either,
although you’ll find several good coding examples in the companion source code.
xviii
and tracing tools, this book will probably appeal more to software engineers with the desire to understand system internals rather than those with a need to quickly learn
how to make use of a specific technology. However, I believe the approach and mindset
it aspires to inculcate are applicable regardless of the technology or level of expertise. In fact, contrary to what many think, the higher the level of technology involved, the harder it becomes to grasp what goes on behind the scenes and the more expertise is needed in order to investigate failures when things inevitably go awry and require debugging skills to save the day. In pure C, for example, a call to malloc is just that: a function call. In C++, a call to the new keyword is emitted by the compiler as a call to the new operator function to allocate memory for the object, followed by code to con-struct the object (again, emitted by the compiler to possibly initialize a virtual pointer and invoke the constructors of the base classes, construct member data objects, and
finally invoke the user-provided constructor code for the target leaf class). In C# (.NET),
things get even more involved, because a one-line call to the new keyword might involve compiling new code at runtime, performing security checks by the .NET
execu-tion engine, loading the modules where the target type is defined, tracking the object
reference for later garbage collection, and so on.
who should Read This Book
This book is aimed at software engineers who desire to take their game to the next level, so to speak, and perfect their mastery of Windows as a development platform through the use of debugging and tracing tools.
assumptions
Readers should have basic familiarity with the C/C++ and C# programming languages.
A basic knowledge of the Win32 and .NET platforms is helpful, but not strictly required, because this book makes every effort to introduce basic concepts before expanding into more advanced topics.
organization of This Book
This book is divided into three parts:
■ Part 1, “A Bit of Background,” provides a brief overview of Windows
basic knowledge is important to have when trying to make sense of the data surfaced by debugging and tracing tools.
■ Part 2, “Debugging for Fun and Profit,” covers the architectural foundations of debuggers in the Windows operating system. It also presents a number of ex-tensible strategies that will help you make the most of the Windows debuggers. In addition, this part also shows how to use the WinDbg debugger to better understand system internals by analyzing the important interactions between your code and the operating system.
■ Part 3, “Observing and Analyzing Software Behavior,” continues this theme. It
presents the Event Tracing for Windows (ETW) technology and illustrates how to
leverage it in debugging and profiling investigations.
■ Finally, you’ll find two short appendices at the end of the book that recap the most common debugging tasks and how to accomplish them using WinDbg.
The table of contents will help you locate chapters and sections quickly. In addition, each chapter starts with a list of the main points covered in the chapter, and concludes with a summary section. You can also download the source code for all the experiments and examples shown throughout the book.
Conventions in This Book
This book presents information using conventions (listed in the following table) designed to make the information readable and easy to follow:
Convention Meaning
Sidebars Boxed sidebars feature additional bits of information that might be helpful for a given subject.
Notes Notes provide useful observations related to the content discussed in the main text.
Inline Code Inline code—that is, code that appears within a paragraph—is shown in italic font.
Code Blocks Code blocks are shown in a different font to help you distinguish code from text easily. Important statements appear in bold font to help you focus on those aspects of the code.
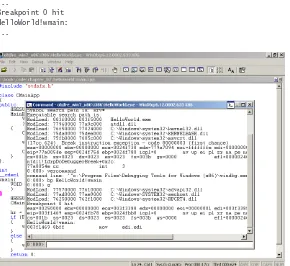
Debugger Listings Debugger listings are shown in a different font, and important commands are bolded to highlight them. The listings are also often prefixed with the out-put from the standard vertarget debugger command, which displays the OS version and CPU architecture where the experiment was conducted.
xx
system Requirements
You will need the following hardware and software to follow the experiments and code samples in this book:
■ operating system Windows Vista or later. Windows 7 (or Windows Server 2008 R2) is highly recommended.
■ hardware Any computer that supports the Windows 7 operating system (OS) requirements. Except for the live kernel debugging experiments, a second com-puter to serve as a host kernel-mode debugger machine is typically required for kernel debugging.
note The target and host don’t really need to be separate physical machines. A common kernel debugging configuration—detailed in Chapter 2, “Getting Started”—is to run the target machine where you conduct the experiments as a Windows 7 virtual OS on a Windows Server 2008 R2 physical host computer, and run the kernel debugger in the host OS.
■ hard disk 1 GB of free hard-disk space to download and save the Windows Software Development Kit (SDK) and Driver Development Kit (DDK) ISO images. 40 MB of free hard-disk space to download and compile the companion source code. An additional 3 GB is required for installing Microsoft Visual Studio 2010.
■ software The following tools are used in the debugging and tracing examples shown throughout this book:
•
Version 7.1 of the Windows 7 SDK, which can be downloaded from the Microsoft Download Center at http://www.microsoft.com/download/en/details.aspx?id=8442. Both the Windows Debuggers (WinDbg) and Windows Performance Toolkit (Xperf) are part of this SDK.
•
The Application Verifier tool, which can also be downloaded from theMicrosoft Download Center at http://www.microsoft.com/download/en
/details.aspx?id=20028.
•
The System Internals suite of developer tools, which can be downloaded from http://technet.microsoft.com/en-us/sysinternals/bb842062.•
Visual Studio 2010, any edition (excluding the free, stripped-down Express edition). The Visual Studio Ultimate edition is preferred because some-ing, are not supported in other editions. The 90-day, free trial version of Visual Studio offered by Microsoft, which can be downloaded at
http://www.microsoft.com/download/en/details.aspx?id=12187, should suffice.
•
The Windows 7 Driver Development Kit (DDK) is used to compile the companion source code and can also be downloaded from the Microsoft Download Center at http://www.microsoft.com/download/en/details.aspx?id=11800.
Code samples
Most of the chapters in this book include experiments and examples that let you interactively try out new material introduced in the main text. The programs used in these experiments can be downloaded from the following page:
http://go.microsoft.com/FWLink/?Linkid=245713
Follow the instructions to download the Inside_Windows_Debugging_Samples.zip
file.
Installing the Code Samples
Follow these steps to install the code samples on your computer so that you can use them with the experiments and examples provided in this book:
1. Unzip the Inside_Windows_Debugging_Samples.zip file that you downloaded from the book’s website into a folder named \Book\Code.
Warning Do not use directory names with spaces in the path hierarchy that you choose to download the samples to. The DDK build environment, which will be described shortly in the “Compiling the Code Samples” section, will fail to compile the source code if you do. It is recommended that you use \Book\Code as the root of the source code because this is the assumed location used when referencing the programs in the main text. The samples in the companion source code are organized by chapter, so there should be a folder for every chapter under this root path location.
2. If prompted, review the displayed end user license agreement. If you accept the
xxii
note If the license agreement doesn’t appear, you can access it from the same webpage from which you downloaded the Inside_Windows_Debugging_ Samples.zip file.
running the Code Samples
The code samples are organized by chapter and are referenced in the book main text by
their respective directory path locations to help you find them easily.
Local Administrator rights are required by some sample programs. In Windows Vista and later, a command prompt must be launched as elevated in order to have full administrative privileges even when the user account is a member of the local built-in Administrators security group. To do so in Windows 7, for example, you need to right-click the Command Prompt menu item in the Windows Start menu, and select Run As Administrator, as shown in the following screen shot:
Compiling the Code Samples
The supporting programs used in the experiments presented in the book main text fall into three categories:
■ C++ samples The binaries for these programs are deliberately omitted from the downloadable ZIP file. When you compile these code samples locally, WinDbg locates their symbols and source code files automatically. So the
experiments presented in the early chapters of this book will “just work” in this
configuration, without needing to specify the source and symbol locations
■ C# ( .nET) samples For convenience, the compiled .NET programs are
included in the downloadable ZIP file. You can use them as-is and you won’t lose
much, given WinDbg doesn’t support source-level .NET debugging, but you can also follow the instructions included in the following section to recompile them if you prefer.
■ Javascript and visual Basic samples These scripts are interpreted by the corresponding scripting engines and do not require compilation.
Compiling the .neT Code Samples
Compiling the .NET code samples from the companion source code requires version 4.0 of the Microsoft .NET Framework or later. Though this version isn’t installed by default on Windows 7, .NET Framework 4.0 gets installed by many other dependent programs, such as Visual Studio 2010. You can also download and install a standalone version from the Microsoft download center at http://www.microsoft.com/download/en
/details.aspx?id=17851.
Each C# code sample from the companion source code will have a helper
compilation script under the same directory. This script uses the .NET 4.0 C# compiler
directly and is easy to invoke, as illustrated in the following command:
C:\book\code\chapter_04\LoadException>compile.bat
If this script fails to find the C# compiler, you should verify that you’ve installed .NET
4.0 in the default directory location where this script expects it to exist. If .NET 4.0 exists but was installed to a different location on your system, you need to modify the script and provide that path instead.
Compiling the C/C++ Code Samples
You can compile the C/C++ code samples from the companion source code using the Windows 7 Driver Development Kit (DDK) build tools. The following steps detail this process. I strongly recommend that you complete these steps before you start read-ing, because you’ll need the code samples to follow the experiments shown later in this book.
1. Download the Windows 7 DDK ISO image from the Microsoft Download Center
at http://www.microsoft.com/download/en/details.aspx?id=11800,and save it to your local hard drive. Set plenty of time aside for this download if you have a
xxiv
2. After the download is complete, mount the saved ISO file into a drive letter. There are several free tools for mounting ISO images on Windows. Virtual Clone Drive,
which you can find on the Internet, is good freeware that works well both on
Windows Vista and Windows 7. With that freeware installed, you should be able to
3. Double-click the newly mounted drive to kick off the DDK setup program, as
shown here:
4. Select the Full Development Environment components from the DDK.
5. Then Install the components to the C:\DDK\7600.16835.1 directory, as shown in
xxvi
6. You can now unmount the DDK drive by right-clicking the mounted drive letter
and selecting the Unmount menu action. This concludes this one-time installa-tion of the Windows DDK build tools.
7. To build x86 binaries, first start a command prompt window and type the following command:
C:\DDK\7600.16385.1>bin\setenv.bat c:\DDK\7600.16385.1
8. You can then build all the native code samples at once. Simply navigate to the
root directory that you extracted the companion source code to and issue the following command. It should take only a minute or so to build all the C/C++ code from the companion source code:
C:\book\code>bcz
Acknowledgments
I am indebted to Vance Morrison for reviewing my rough drafts. Vance has been a role model for me since I joined Microsoft, and his critical insight was tremendously helpful in improving the quality of my writing. I only hope that I came close to his high standards.
I’d also like to thank Silviu Calinoiu and Shawn Farkas for their detailed review of my draft chapters. Their attention to detail and precise feedback was tremendously helpful.
Ajay Bhave, Cristian Levcovici, and Rico Mariani provided several ideas for improving the material covered in this book. This book certainly wouldn’t be the same without their help and guidance.
Special thanks to Michael Fortin for writing the foreword, and to all my colleagues in the Windows fundamentals team for their support during the writing of this book.
Finally, I have to acknowledge my family, who play an important part in my life. I would like to dedicate this book to my parents for providing me with the opportunity to reach for my dreams and always being there when I needed them. Your love and support mean the world to me.
Errata & Book support
We’ve made every effort to ensure the accuracy of this book and its companion content. Any errors that have been reported since this book was published are listed on our Microsoft Press site at oreilly.com:
http://go.microsoft.com/FWLink/?Linkid=245712
If you find an error that is not already listed, you can report it to us through the
same page.
If you need additional support, email Microsoft Press Book Support at
Please note that product support for Microsoft software is not offered through the addresses above.
we want to hear from you
At Microsoft Press, your satisfaction is our top priority, and your feedback our most valuable asset. Please tell us what you think of this book at:
http://www.microsoft.com/learning/booksurvey
xxviii
stay in Touch
Introduction
O
ne exciting aspect of software programming is that there are usually many ways to accomplish the same goal. Unfortunately, this also presents software engineers with unique challenges when trying to make the best design or implementation choice for each situation. Experience plays a major role, and the learning process is often progressive as one learns to avoid past mistakes. Sadly, though, experience is often a variable concept. I have met several software engineers who, after spending a very long time working on an area, still lacked a basic understanding of how it really worked beyond the repetitive day-to-day tasks they grew accustomed to. I have also met otherswho have perfected their craft in a field after only a few years of working experience.
This book introduces a few techniques for methodically approaching software development problems primarily using the two “Swiss Army knives” of expert Microsoft Windows developers—namely, the Windows debuggers (WinDbg) and the Windows Performance Toolkit (Xperf). By focusing on why features and components work the way they do in the system rather than simply on how they work or what they do, this book tries to accelerate the process of learning by experience and to minimize the number of mistakes made when approaching new problems. An important part of the process is learning to compare and contrast with known solutions to existing ones.
Software engineering is still inherently a practical science. (Some might even argue it’s an art rather than a science.) While there is certainly no substitute for real
experi-ence, the topic can definitely be approached with the same methodical persistence that works so well for other scientific disciplines. In fact, this approach works even better in
software engineering because all behaviors can be explained rationally. After all, it is all just code—whether it’s your own code or code written by others that you end up consuming in your software—and code can always be traced and understood.
Although this book deals with several architectural pillars of the Windows operating system as part of its debugging and tracing experiments, my main goal in writing it is less about covering those details and more about encouraging and developing this critical mindset. I hope to demonstrate how this approach can be used for solving a few interesting problems as part of this book, and that you continue to systematically apply debugging and tracing as you expand your learning beyond the topics directly covered here.
This book is not really about teaching native or managed code programming, either,
although you’ll find several good coding examples in the companion source code.
xxx
and tracing tools, this book will probably appeal more to software engineers with the desire to understand system internals rather than those with a need to quickly learn
how to make use of a specific technology. However, I believe the approach and mindset
it aspires to inculcate are applicable regardless of the technology or level of expertise. In fact, contrary to what many think, the higher the level of technology involved, the harder it becomes to grasp what goes on behind the scenes and the more expertise is needed in order to investigate failures when things inevitably go awry and require debugging skills to save the day. In pure C, for example, a call to malloc is just that: a function call. In C++, a call to the new keyword is emitted by the compiler as a call to the new operator function to allocate memory for the object, followed by code to con-struct the object (again, emitted by the compiler to possibly initialize a virtual pointer and invoke the constructors of the base classes, construct member data objects, and
finally invoke the user-provided constructor code for the target leaf class). In C# (.NET),
things get even more involved, because a one-line call to the new keyword might involve compiling new code at runtime, performing security checks by the .NET
execu-tion engine, loading the modules where the target type is defined, tracking the object
reference for later garbage collection, and so on.
who should Read This Book
This book is aimed at software engineers who desire to take their game to the next level, so to speak, and perfect their mastery of Windows as a development platform through the use of debugging and tracing tools.
assumptions
Readers should have basic familiarity with the C/C++ and C# programming languages.
A basic knowledge of the Win32 and .NET platforms is helpful, but not strictly required, because this book makes every effort to introduce basic concepts before expanding into more advanced topics.
organization of This Book
This book is divided into three parts:
■ Part 1, “A Bit of Background,” provides a brief overview of Windows
basic knowledge is important to have when trying to make sense of the data surfaced by debugging and tracing tools.
■ Part 2, “Debugging for Fun and Profit,” covers the architectural foundations of debuggers in the Windows operating system. It also presents a number of ex-tensible strategies that will help you make the most of the Windows debuggers. In addition, this part also shows how to use the WinDbg debugger to better understand system internals by analyzing the important interactions between your code and the operating system.
■ Part 3, “Observing and Analyzing Software Behavior,” continues this theme. It
presents the Event Tracing for Windows (ETW) technology and illustrates how to
leverage it in debugging and profiling investigations.
■ Finally, you’ll find two short appendices at the end of the book that recap the most common debugging tasks and how to accomplish them using WinDbg.
The table of contents will help you locate chapters and sections quickly. In addition, each chapter starts with a list of the main points covered in the chapter, and concludes with a summary section. You can also download the source code for all the experiments and examples shown throughout the book.
Conventions in This Book
This book presents information using conventions (listed in the following table) designed to make the information readable and easy to follow:
Convention Meaning
Sidebars Boxed sidebars feature additional bits of information that might be helpful for a given subject.
Notes Notes provide useful observations related to the content discussed in the main text.
Inline Code Inline code—that is, code that appears within a paragraph—is shown in italic font.
Code Blocks Code blocks are shown in a different font to help you distinguish code from text easily. Important statements appear in bold font to help you focus on those aspects of the code.
Debugger Listings Debugger listings are shown in a different font, and important commands are bolded to highlight them. The listings are also often prefixed with the out-put from the standard vertarget debugger command, which displays the OS version and CPU architecture where the experiment was conducted.
xxxii
system Requirements
You will need the following hardware and software to follow the experiments and code samples in this book:
■ operating system Windows Vista or later. Windows 7 (or Windows Server 2008 R2) is highly recommended.
■ hardware Any computer that supports the Windows 7 operating system (OS) requirements. Except for the live kernel debugging experiments, a second com-puter to serve as a host kernel-mode debugger machine is typically required for kernel debugging.
note The target and host don’t really need to be separate physical machines. A common kernel debugging configuration—detailed in Chapter 2, “Getting Started”—is to run the target machine where you conduct the experiments as a Windows 7 virtual OS on a Windows Server 2008 R2 physical host computer, and run the kernel debugger in the host OS.
■ hard disk 1 GB of free hard-disk space to download and save the Windows Software Development Kit (SDK) and Driver Development Kit (DDK) ISO images. 40 MB of free hard-disk space to download and compile the companion source code. An additional 3 GB is required for installing Microsoft Visual Studio 2010.
■ software The following tools are used in the debugging and tracing examples shown throughout this book:
•
Version 7.1 of the Windows 7 SDK, which can be downloaded from the Microsoft Download Center at http://www.microsoft.com/download/en/details.aspx?id=8442. Both the Windows Debuggers (WinDbg) and Windows Performance Toolkit (Xperf) are part of this SDK.
•
The Application Verifier tool, which can also be downloaded from theMicrosoft Download Center at http://www.microsoft.com/download/en
/details.aspx?id=20028.
•
The System Internals suite of developer tools, which can be downloaded from http://technet.microsoft.com/en-us/sysinternals/bb842062.•
Visual Studio 2010, any edition (excluding the free, stripped-down Express edition). The Visual Studio Ultimate edition is preferred because some-ing, are not supported in other editions. The 90-day, free trial version of Visual Studio offered by Microsoft, which can be downloaded at
http://www.microsoft.com/download/en/details.aspx?id=12187, should suffice.
•
The Windows 7 Driver Development Kit (DDK) is used to compile the companion source code and can also be downloaded from the Microsoft Download Center at http://www.microsoft.com/download/en/details.aspx?id=11800.
Code samples
Most of the chapters in this book include experiments and examples that let you interactively try out new material introduced in the main text. The programs used in these experiments can be downloaded from the following page:
http://go.microsoft.com/FWLink/?Linkid=245713
Follow the instructions to download the Inside_Windows_Debugging_Samples.zip
file.
Installing the Code Samples
Follow these steps to install the code samples on your computer so that you can use them with the experiments and examples provided in this book:
1. Unzip the Inside_Windows_Debugging_Samples.zip file that you downloaded from the book’s website into a folder named \Book\Code.
Warning Do not use directory names with spaces in the path hierarchy that you choose to download the samples to. The DDK build environment, which will be described shortly in the “Compiling the Code Samples” section, will fail to compile the source code if you do. It is recommended that you use \Book\Code as the root of the source code because this is the assumed location used when referencing the programs in the main text. The samples in the companion source code are organized by chapter, so there should be a folder for every chapter under this root path location.
2. If prompted, review the displayed end user license agreement. If you accept the
xxxiv
note If the license agreement doesn’t appear, you can access it from the same webpage from which you downloaded the Inside_Windows_Debugging_ Samples.zip file.
running the Code Samples
The code samples are organized by chapter and are referenced in the book main text by
their respective directory path locations to help you find them easily.
Local Administrator rights are required by some sample programs. In Windows Vista and later, a command prompt must be launched as elevated in order to have full administrative privileges even when the user account is a member of the local built-in Administrators security group. To do so in Windows 7, for example, you need to right-click the Command Prompt menu item in the Windows Start menu, and select Run As Administrator, as shown in the following screen shot:
Compiling the Code Samples
The supporting programs used in the experiments presented in the book main text fall into three categories:
■ C++ samples The binaries for these programs are deliberately omitted from the downloadable ZIP file. When you compile these code samples locally, WinDbg locates their symbols and source code files automatically. So the
experiments presented in the early chapters of this book will “just work” in this
configuration, without needing to specify the source and symbol locations
■ C# ( .nET) samples For convenience, the compiled .NET programs are
included in the downloadable ZIP file. You can use them as-is and you won’t lose
much, given WinDbg doesn’t support source-level .NET debugging, but you can also follow the instructions included in the following section to recompile them if you prefer.
■ Javascript and visual Basic samples These scripts are interpreted by the corresponding scripting engines and do not require compilation.
Compiling the .neT Code Samples
Compiling the .NET code samples from the companion source code requires version 4.0 of the Microsoft .NET Framework or later. Though this version isn’t installed by default on Windows 7, .NET Framework 4.0 gets installed by many other dependent programs, such as Visual Studio 2010. You can also download and install a standalone version from the Microsoft download center at http://www.microsoft.com/download/en
/details.aspx?id=17851.
Each C# code sample from the companion source code will have a helper
compilation script under the same directory. This script uses the .NET 4.0 C# compiler
directly and is easy to invoke, as illustrated in the following command:
C:\book\code\chapter_04\LoadException>compile.bat
If this script fails to find the C# compiler, you should verify that you’ve installed .NET
4.0 in the default directory location where this script expects it to exist. If .NET 4.0 exists but was installed to a different location on your system, you need to modify the script and provide that path instead.
Compiling the C/C++ Code Samples
You can compile the C/C++ code samples from the companion source code using the Windows 7 Driver Development Kit (DDK) build tools. The following steps detail this process. I strongly recommend that you complete these steps before you start read-ing, because you’ll need the code samples to follow the experiments shown later in this book.
1. Download the Windows 7 DDK ISO image from the Microsoft Download Center
at http://www.microsoft.com/download/en/details.aspx?id=11800,and save it to your local hard drive. Set plenty of time aside for this download if you have a
xxxvi
2. After the download is complete, mount the saved ISO file into a drive letter. There are several free tools for mounting ISO images on Windows. Virtual Clone Drive,
which you can find on the Internet, is good freeware that works well both on
Windows Vista and Windows 7. With that freeware installed, you should be able to
3. Double-click the newly mounted drive to kick off the DDK setup program, as
shown here:
4. Select the Full Development Environment components from the DDK.
5. Then Install the components to the C:\DDK\7600.16835.1 directory, as shown in
xxxviii
6. You can now unmount the DDK drive by right-clicking the mounted drive letter
and selecting the Unmount menu action. This concludes this one-time installa-tion of the Windows DDK build tools.
7. To build x86 binaries, first start a command prompt window and type the following command:
C:\DDK\7600.16385.1>bin\setenv.bat c:\DDK\7600.16385.1
8. You can then build all the native code samples at once. Simply navigate to the
root directory that you extracted the companion source code to and issue the following command. It should take only a minute or so to build all the C/C++ code from the companion source code:
C:\book\code>bcz
Acknowledgments
I am indebted to Vance Morrison for reviewing my rough drafts. Vance has been a role model for me since I joined Microsoft, and his critical insight was tremendously helpful in improving the quality of my writing. I only hope that I came close to his high standards.
I’d also like to thank Silviu Calinoiu and Shawn Farkas for their detailed review of my draft chapters. Their attention to detail and precise feedback was tremendously helpful.
Ajay Bhave, Cristian Levcovici, and Rico Mariani provided several ideas for improving the material covered in this book. This book certainly wouldn’t be the same without their help and guidance.
Special thanks to Michael Fortin for writing the foreword, and to all my colleagues in the Windows fundamentals team for their support during the writing of this book.
Finally, I have to acknowledge my family, who play an important part in my life. I would like to dedicate this book to my parents for providing me with the opportunity to reach for my dreams and always being there when I needed them. Your love and support mean the world to me.
Errata & Book support
We’ve made every effort to ensure the accuracy of this book and its companion content. Any errors that have been reported since this book was published are listed on our Microsoft Press site at oreilly.com:
http://go.microsoft.com/FWLink/?Linkid=245712
If you find an error that is not already listed, you can report it to us through the
same page.
If you need additional support, email Microsoft Press Book Support at
Please note that product support for Microsoft software is not offered through the addresses above.
we want to hear from you
At Microsoft Press, your satisfaction is our top priority, and your feedback our most valuable asset. Please tell us what you think of this book at:
http://www.microsoft.com/learning/booksurvey
xl
stay in Touch
Pa r t 1
A Bit of Background
ChAPTER 1 Software Development in Windows . . . .3
One of my esteemed mentors at Microsoft once told me the following story. He came back home one night to be greeted by a dismayed look on his wife’s face. Her cherished wedding ring had just vanished down the bathroom sink drain and she was completely stumped. For all she knew, the wedding ring might very well have been in the ocean by the time they were having that conversation. To her, anything beyond the drain plug was a black box. My mentor, using the slight advantage of plumb-ing knowledge he had over his wife, knew about those nifty structures called “sink traps,” which are usually J-shaped pipes located just beneath the sink. These are intended to “trap” a
little bit of water and prevent sewer gas from flowing out of the
drain pipes into the living space. But in addition, the traps also conveniently capture objects and keep them from going down the drain immediately. As it turned out, the ring was indeed in the sink trap, and he was able to retrieve it relatively easily.
The first part of this book explores how your programs
interact with the Microsoft Windows operating system (in a loose sense) and demonstrates why it’s useful to have at least a cursory understanding of both those interactions and of the role of each subsystem. It also examines some important development frameworks shipped by Microsoft, and analyzes their positions relative to each other and to the operating system (OS) developer interfaces. It then concludes by introduc-ing the Windows Software Development Kit (SDK) tools and,
more specifically, the Swiss Army knives of expert Windows
C h A P T E R 1
Software Development
in Windows
In this chapter
Windows evolution . . . 3
Windows architecture . . . 7
Windows Developer Interface. . . 16
Microsoft Developer Tools. . . 28
Summary . . . 30
windows Evolution
Though this book focuses primarily on the post-Vista era of Windows, it’s useful to look back at the history of Windows releases, because the roots of several building blocks of the underlying architecture can be traced all the way back to the Windows NT (an abbreviation for “New Technology”) operating system. Windows NT was first designed and developed by Microsoft in
the late '80s, and continued to evolve until its kernel finally became the core of all client and server
versions of the Windows operating system.
Windows release history
Windows XP marked a major milestone in the history of Windows releases by providing a unified
code base for both the business (server) and consumer (client) releases of Windows. Though Windows XP was a client release (its server variant was Windows Server 2003), it technically suc-ceeded both Windows 95/98/ME (a lineage of consumer operating systems that find their roots in the MS-DOS and Windows 3.1 operating systems) and Windows NT 4/Windows 2000, combining for
the first time the power of the Windows NT operating system kernel and its robust architecture with
4
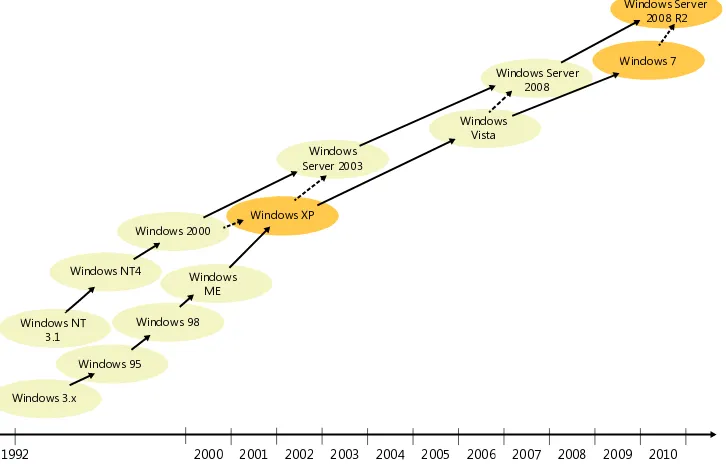
Though both the server and client releases of Windows now share the same kernel, they still differ in many of their features and components. (For example, only the server releases of Windows sup-port multiple concurrent remote desktop user sessions.) Since the release of Windows XP in 2001, Windows Server has followed a release cycle that can be loosely mapped to corresponding Windows client releases. Windows Server 2003, for instance, shares many of the new kernel and API features that were added in Windows XP. Similarly, Windows Server 2008 R2 represents the server variant of Windows 7, which was released in late 2009. (Don’t confuse this with Windows Server 2008, which is the server variant of Windows Vista.)
Figure 1-1 illustrates the evolution of the Windows family of operating systems, with their approximate release dates relative to each other.
2010
fIguRE 1-1 Timeline of major client and server releases of the Windows operating system since the early 90s.
Supported CpU architectures
Windows was ported to many CPU architectures in the past. For example, Windows NT supported Alpha and MIPS processors until Windows NT 4. Windows NT 3.51 also had support for Power PC (another RISC family of processors that is used in many embedded devices, including, for example, Microsoft Xbox 360). However, Windows later narrowed its support to three CPU architectures: x86 (a 32-bit family of processors, whose instruction set was designed by Intel), x64 (also known as
Microsoft shipped the first ia64 version of Windows XP in late 2001 and followed it with an x64 version in 2005. Microsoft later dropped support for ia64 on client editions, including Windows XP. The x86, x64, and ia64 architectures supported in Windows Server 2003 and Windows XP are exactly those that were also supported when Windows Server 2008 R2 and Windows 7 shipped at the end of 2009, though x86 and x64 are clearly the more widely used Windows architectures nowadays. Note, however, that Windows Server no longer supports x86; it now supports only 64-bit architectures. Also, Microsoft announced early in 2011 that its upcoming release of the Windows operating system will be capable of running on ARM (in addition to the x86 and x64 platforms), a RISC instruction set that’s widely used in embedded utilities, smartphones, and tablet (slate) devices thanks in large part to its
efficient use of battery power.
Understanding the underlying CPU architecture of the Windows installation you are working on is very important during debugging and tracing because you often need to use native tools that correspond to your CPU architecture. In addition, sometimes you will also need to understand the disassembly of the code you are analyzing in the debugger, which is different for each CPU. This is one reason many debugger listings in this book also show the underlying CPU architecture that they were captured on so that you can easily conduct any further disassembly inspection you decide to do on the right target platform. In the following listing, for example, the vertarget command shows a Windows 7 AMD64 (x64) operating system. You’ll see more about this command and others in the next chapter, so don’t worry about how to issue it for now.
lkd> $ Multi-processor (2 processors or cores) Windows 7 x64 system
lkd> vertarget
Windows 7 Kernel Version 7600 MP (2 procs) Free x64
Built by: 7600.16385.amd64fre.win7_rtm.090713-1255
Given the widespread use of x86 and x64, and because you can also execute x86 programs on x64 machines, the majority of experiments in this book are conducted using the x86 architecture so that you can follow them the way they’re described in this book regardless of your target architecture. Though x86 has been the constant platform of choice for Windows since its early days in the '80s, 64-bit processors continue to gain in popularity even among home computers and laptops, which now often carry x64 versions of Windows 7.
Windows Build Flavors
The vertarget debugger command output shown in the previous section referred to the Windows version on the target machine as a “free” (also known as retail) build. This flavor is the only one ever shipped to end users by Microsoft for any of the supported processor architectures. There is, however,
another flavor called a “checked” (also known as debug) build, which MSDN subscribers can obtain
from Microsoft if they want to test the software they build with this flavor of the Windows operating
system. It’s important to realize that checked flavors are mostly meant to help driver developers; they don’t derive their name at all from being “tested”—or otherwise “checked”—more thoroughly than
6
If you recall, the Introduction of this book recommended using the Driver Development Kit (DDK) build environment if you wanted to recompile the companion C++ sample code. As was explained
then, you can also specify the build flavor you want to target (the default being x86 free in the
Windows 7 DDK) when starting a DDK build environment. This is, in fact, also how the checked flavor
of Windows is built internally at Microsoft because the same build environment made available in the DDK is also used by Windows developers to compile the Windows source code. For example, the following command starts a DDK build environment where your source code is compiled into
x64binaries using the checked (chk) build flavor. This essentially turns off a few compiler optimiza
-tions and defines debug build macros (such as the DBG preprocessor variable) that turn on “debug”
sections of the code, including assertions (such as the NT_ASSERT macro).
C:\DDK\7600.16385.1>bin\setenv.bat c:\DDK\7600.16385.1 chk x64
Naturally, you don’t really need a checked build of Windows to run your checked binaries, and the main difference between your “free” and “checked” binaries is that the assertions you put in your
code will occur only in the “checked” flavor. The benefit of the checked flavor of Windows itself is
that it also contains many additional assertions in the system code that can point out implementa-tion problems in your code, which is usually useful if you are developing a driver. The drawback to
that Windows flavor, of course, is that it runs much slower than the free flavor and also that you must
run it with a kernel debugger attached at all times so that you can ignore assertions when they’re hit; otherwise, those assertions might go unhandled and cause the machine to crash and reboot if they are raised in code that runs in kernel mode.
Windows Servicing Terminology
Each major Windows release is usually preceded by a few public milestones that provide customers with a preview of the features included in that release. Those prerelease milestones are usually called
Alpha, Beta1, Beta2, and RC or release candidate, in this chronological order, though several Windows releases have either skipped some of these milestones or named them differently. These prerelease milestones also present an opportunity for Microsoft to engage with customers and collect their
feedback before Windows is officially “released to manufacturing,” a milestone referred to as RTM.
You will again recognize the major version of Windows in the build information displayed by the
vertarget command that accompanies many of the debugger listings presented in this book. For example, the following listing shows that the target machine is running Windows 7 RTM and that
July 13, 2009 (identified by the “090713” substring in the following output) is the date this particular
Windows build was produced at Microsoft.
lkd> vertarget
In addition to the major client and server releases for each Windows operating system, Microsoft also ships several servicing updates in between those releases that get automatically delivered via the Windows Update pipeline and usually come in one of the following forms:
■ service packs These releases usually occur a few years apart after RTM and compile the smaller updates made in between (and, on occasion, new features requested by customers) into a single package that can be applied at once by both consumers and businesses. They are often referred to using the “SP” abbreviation, followed by the service pack number. For
example, SP1 is the first service pack after RTM, SP2 is the second, and so on.
Service packs are considered major releases and are subjected to the same rigorous release process that accompanies RTM releases. In fact, many Windows service packs also have one
or more release candidate (RC) milestones before they’re officially released to the public.
The number of service packs for a major Windows release is often determined by customer demand and also the amount of changes accumulated since the last service pack. Windows NT4, for example, had six service packs, while Windows Vista had three.
■ gDR updates GDR (General Distribution Release) updates are issued to address bugs with broad impact or security implications. The frequency varies by need, but these updates are
usually released every few weeks. These fixes are also rolled up into the following service pack
release.
For example, the following output indicates that the target debugging machine is running a version of Windows 7 SP1. Notice also that the version of kernel32.dll that’s installed on this machine comes from a GDR update subsequent to the initial Windows 7 SP1 release.
0:000> vertarget
Windows 7 Version 7601 (Service Pack 1) MP (2 procs) Free x86 compatible kernel32.dll version: 6.1.7601.17651 (win7sp1_gdr.110715-1504)
windows Architecture
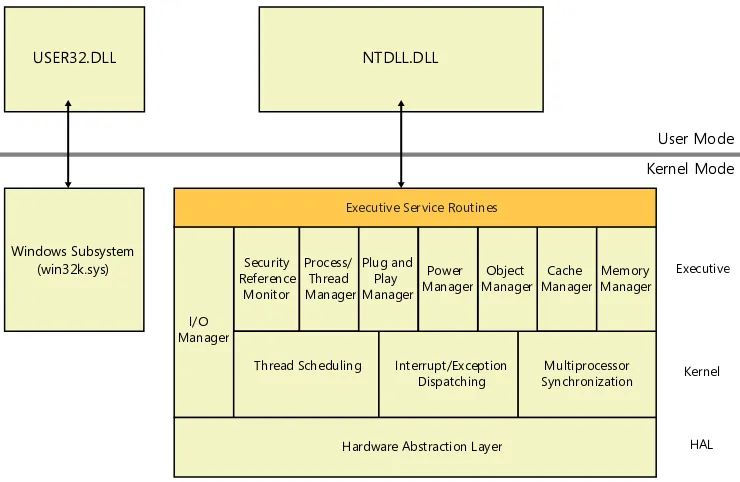
The fundamental design of the Windows operating system, with an executive that runs in kernel mode and a complementary set of user-mode system support processes (smss.exe, csrss.exe,
winlogon.exe, and so on) to help manage additional system facilities, has for the most part remained unchanged since the inception of the Windows NT operating system back in the late '80s. Each new version of Windows naturally brings about a number of new components and APIs, but
understanding how they fit in the architectural stack often starts with knowing how they interact