by Allen G. Taylor
Hoboken, NJ 07030-5774 www.wiley.com
Copyright © 2008 by Wiley Publishing, Inc., Indianapolis, Indiana Published by Wiley Publishing, Inc., Indianapolis, Indiana Published simultaneously in Canada
No part of this publication may be reproduced, stored in a retrieval system or transmitted in any form or by any means, electronic, mechanical, photocopying, recording, scanning or otherwise, except as permit-ted under Sections 107 or 108 of the 1976 Unipermit-ted States Copyright Act, without either the prior written permission of the Publisher, or authorization through payment of the appropriate per-copy fee to the Copyright Clearance Center, 222 Rosewood Drive, Danvers, MA 01923, (978) 750-8400, fax (978) 646-8600. Requests to the Publisher for permission should be addressed to the Legal Department, Wiley Publishing, Inc., 10475 Crosspoint Blvd., Indianapolis, IN 46256, (317) 572-3447, fax (317) 572-4355, or online at http: //www.wiley.com/go/permissions.
Trademarks:Wiley, the Wiley Publishing logo, For Dummies, the Dummies Man logo, A Reference for the Rest of Us!, The Dummies Way, Dummies Daily, The Fun and Easy Way, Dummies.com, and related trade dress are trademarks or registered trademarks of John Wiley & Sons, Inc. and/or its affiliates in the United States and other countries, and may not be used without written permission. Crystal Reports is a regis-tered trademark of Business Objects, SA. All other trademarks are the property of their respective owners. Wiley Publishing, Inc., is not associated with any product or vendor mentioned in this book.
LIMIT OF LIABILITY/DISCLAIMER OF WARRANTY: THE PUBLISHER AND THE AUTHOR MAKE NO REP-RESENTATIONS OR WARRANTIES WITH RESPECT TO THE ACCURACY OR COMPLETENESS OF THE CON-TENTS OF THIS WORK AND SPECIFICALLY DISCLAIM ALL WARRANTIES, INCLUDING WITHOUT LIMITATION WARRANTIES OF FITNESS FOR A PARTICULAR PURPOSE. NO WARRANTY MAY BE CRE-ATED OR EXTENDED BY SALES OR PROMOTIONAL MATERIALS. THE ADVICE AND STRATEGIES CON-TAINED HEREIN MAY NOT BE SUITABLE FOR EVERY SITUATION. THIS WORK IS SOLD WITH THE UNDERSTANDING THAT THE PUBLISHER IS NOT ENGAGED IN RENDERING LEGAL, ACCOUNTING, OR OTHER PROFESSIONAL SERVICES. IF PROFESSIONAL ASSISTANCE IS REQUIRED, THE SERVICES OF A COMPETENT PROFESSIONAL PERSON SHOULD BE SOUGHT. NEITHER THE PUBLISHER NOR THE AUTHOR SHALL BE LIABLE FOR DAMAGES ARISING HEREFROM. THE FACT THAT AN ORGANIZATION OR WEBSITE IS REFERRED TO IN THIS WORK AS A CITATION AND/OR A POTENTIAL SOURCE OF FUR-THER INFORMATION DOES NOT MEAN THAT THE AUTHOR OR THE PUBLISHER ENDORSES THE INFOR-MATION THE ORGANIZATION OR WEBSITE MAY PROVIDE OR RECOMMENDATIONS IT MAY MAKE. FURTHER, READERS SHOULD BE AWARE THAT INTERNET WEBSITES LISTED IN THIS WORK MAY HAVE CHANGED OR DISAPPEARED BETWEEN WHEN THIS WORK WAS WRITTEN AND WHEN IT IS READ.
For general information on our other products and services, please contact our Customer Care Department within the U.S. at 800-762-2974, outside the U.S. at 317-572-3993, or fax 317-572-4002. For technical support, please visit www.wiley.com/techsupport.
Wiley also publishes its books in a variety of electronic formats. Some content that appears in print may not be available in electronic books.
Library of Congress Control Number: 2008927910 ISBN: 978-0-470-29077-4
Dedication
This book is dedicated to my daughter, Jenny Taylor Warren, who has given me much excellent advice, as well as two outstanding grandsons.
Author’s Acknowledgments
Many people have contributed to the quality and content of this book. I would particularly like to recognize my Acquisitions Editor, Kyle Looper, for his overall management of the project and for keeping me honest, and my Project Editor, Rebecca Senninger, for the day-to-day coordination of the project.
Some of the people who helped bring this book to market include the following:
Acquisitions and Editorial
Project Editor:Rebecca Senninger
Acquisitions Editor:Kyle Looper
Senior Copy Editor:Teresa Artman
Technical Editor:Howard Hammerman
Editorial Manager:Leah Cameron
Editorial Assistant:Amanda Foxworth
Senior Editorial Assistant:Cherie Case
Cartoons:Rich Tennant (www.the5thwave.com)
Composition Services
Project Coordinator:Lynsey Stanford
Layout and Graphics: Reuben W. Davis, Alissa D. Ellet, Melissa K. Jester, Christine Williams
Proofreaders: Susan Moritz, Toni Settle
Indexer:Infodex Indexing Services Inc.
Publishing and Editorial for Technology Dummies
Richard Swadley,Vice President and Executive Group Publisher
Andy Cummings,Vice President and Publisher
Mary Bednarek,Executive Acquisitions Director
Mary C. Corder,Editorial Director
Publishing for Consumer Dummies
Diane Graves Steele,Vice President and Publisher
Joyce Pepple,Acquisitions Director
Composition Services
Gerry Fahey,Vice President of Production Services
Part I: Reporting Basics ...3
Part II: Moving Up to Professional-Quality Reports ...3
Part III: Advanced Report Types and Features ...3
Part IV: Crystal Reports in the Enterprise ...3
Part V: Publishing Your Reports...4
Part VI: The Part of Tens ...4
Icons Used in This Book...4
Where to Go from Here...5
Part I: Reporting Basics...7
Chapter 1: Transforming Raw Data into Meaningful Information . . . . .9
Major Features of Crystal Reports 2008...9
Formatting a report...10
Generating barcodes...11
Enhancing a report with formulas and custom functions...11
Getting visual with charts and maps ...11
Xcelsius integration ...12
Adobe Flash integration ...12
Displaying a report...12
Distributing a report ...12
Supplying Crystal Reports with data ...13
The Lone Edition of Crystal Reports 2008 ...13
Viewing a Report ...13
Reading a printed report ...13
Viewing a report with Crystal Reports ...14
Viewing a report on a LAN or on the Web ...16
Chapter 2: Create a Simple Report Right Now! . . . .17
First Things First: Finding the Sample Database...18
Starting Crystal Reports 2008...18
Creating a Report with the Blank Report Option...20
Allocating more space to the layout ...24
Introducing your report...25
Improving the readability of page headers ...29
Previewing the report ...30
Page footers carry useful information ...32
Wrapping things up with a report footer ...34
Recording helpful information about your report ...34
Printing a Report ...36
Where to Go from Here...36
Chapter 3: Report Design Guidelines . . . .37
Defining an Effective Report Design ...37
Defining Your Audience ...37
Defining the Report’s Purpose...38
Choosing Content for Your Report ...39
Choosing the Report Appearance...39
Making a good first impression ...40
Deciding how best to present the information...40
Choosing graphic elements for your report ...41
Style communicates meaning, too ...41
Making sure your report conveys your message ...42
Chapter 4: Starting Your Report . . . .43
Using the Report Creation Wizard ...43
Creating a report with the Standard Report Creation Wizard ...44
Using other report-creation wizards...49
Starting with a Blank Report...49
Connecting Your Report to Its Data Source...50
Accessing database files directly ...51
Connecting to ODBC data sources ...51
Retrieving data with SQL...52
Reporting on data in OLE DB data sources...53
Which interface should you use? ...53
Part II: Moving Up to Professional-Quality Reports ...55
Chapter 5: Pulling Specific Data from a Database . . . .57
Get Data Quickly with Select Expert...57
Using Formulas to Retrieve Data...64
Using Parameter Fields to Retrieve Data at Runtime ...66
Step 1: Creating a report that shows everything...67
Step 2: Giving the user the power to decide what to show ...70
Speed retrievals with indexes...72
Changing parameter values to change the report ...72
Keeping Track of Things with Running Totals...94
Troubleshooting Sorting, Grouping, and Totaling Problems...97
Sorting problems and how to solve them ...98
Unusual grouping options ...98
Getting the right totals ...99
Chapter 7: Mastering Report Sections . . . .101
Changing the Size of a Section...101
Formatting with the Section Formatting Menu ...103
Using Section Expert for Easy Section Formatting ...104
Common tab, Section Expert ...105
Paging tab, Section Expert ...106
Color tab, Section Expert ...107
Placing Groups Where You Want Them...110
Starting each group at the top of its own page ...110
Printing totals at the bottom of a page...112
Restarting page numbering at the beginning of each group...113
Hiding Details with Summary and Drill-Down Reports ...113
Generating Barcodes ...114
Creating Mailing Labels ...117
Saving Money on Postage with a ZIP Sort...120
Chapter 8: Enhancing Your Report’s Appearance . . . .123
Absolute Formatting ...124
Setting the fonts and their formatting for emphasis...124
Adding graphical elements for emphasis...128
Conditional Formatting Using the Format Editor...130
Creating Emphasis with Highlighting Expert ...132
Adding Pictures to Your Report ...134
Aligning Preprinted Forms ...136
Adding Text from a File ...136
Formatting Options...137
Special Fields Contain Report Metadata ...139
Raising a Red Flag with Report Alerts ...139
Using Report Templates to Save Time and Effort ...142
Applying a template to a report ...143
Applying a template to an existing report...143
Part III: Advanced Report Types and Features ...147
Chapter 9: Displaying Your Top Ten (Or Top N) with Group Sort . . . .149
Sorting Groups Based on Performance ...149
Starting a Top N Report ...150
Displaying a group total...154
Hiding the details ...155
Removing page breaks...157
Going with the Percentages ...160
What if you want the top 17 instead of the top 5? ...161
A Choice of Group Sorts...164
Troubleshooting Group Sort Problems ...165
Chapter 10: Adding Formulas to Reports . . . .167
Formula Overview and Syntax ...167
Lessening the Workload with Functions ...168
Creating a Custom Function in Formula Workshop...169
Formula Editor ...173
Formula Expert ...175
SQL Expression Editor ...177
Selection formulas...177
Formatting formulas...181
Changing and Deleting Formulas ...182
Data Types ...182
Simple data types ...182
Range data types ...184
Array data types ...184
Variables in Formulas ...185
Declaring a variable ...185
Assigning a value to a variable ...186
Control Structures...186
If-Then-Else...186
Select Case ...187
For loop...187
While Do loop ...188
Do While loop ...189
Chapter 11: Creating Reports within a Report . . . .191
Combining Unrelated Reports ...191
Underlay formatting for side-by-side location of subreport...195
Drilling down in a subreport ...196
Linking a Subreport to a Primary Report...197
On-Demand Subreports Boost Efficiency...203
Passing Data between Reports...204
Embedding or Linking an Object Taken from a File ...217
Integrating Shockwave Flash Objects into Your Reports...217
Chapter 13: Creating and Updating OLAP Reports . . . .219
What’s OLAP, and Why Might You Need It? ...219
Who uses OLAP?...220
Creating multidimensional views ...220
Connecting to an OLAP data source ...221
OLAP Reporting with Crystal Reports ...221
Operating on OLAP grid objects...222
Creating a three-dimensional report...222
Updating an OLAP Report...232
Formatting Data in an OLAP Report ...233
Changing a dimension’s background color...234
Creating an alias for a dimension ...235
Formatting grid lines...236
Labeling dimensions ...237
Changing Data Appearance in an OLAP Report ...238
Showing and hiding dimensions...239
Adding totals to an OLAP grid ...240
Pivoting an OLAP grid...240
Reordering fields ...241
Sorting data ...242
Filtering data ...243
Making calculations ...243
Chapter 14: Using Cross-Tab Reports to Mine Your Data . . . .245
Creating a Cross-Tab Object to Summarize All Report Data ...245
Summarizing the Contents of a Group with a Cross-Tab ...249
Making Calculations within a Cross-Tab Row or Column ...255
Enhancing the Appearance and Readability of a Cross-Tab Object ...256
Changing the width and height of cross-tab cells ...256
Formatting entire rows and columns...257
Formatting individual fields ...257
Suppressing selected cross-tab data ...258
Chapter 15: Enhancing Reports with Charts . . . .259
Color Highlight tab ...263
Text tab ...263
Creating a Chart ...263
Drilling down from a chart ...266
Changing a chart...267
Choosing the Best Chart Type for Your Data ...267
Side-by-side bar chart ...267
Percent bar chart ...268
Line chart ...268
Area chart...269
Pie chart ...270
Doughnut chart...270
3-D riser chart ...271
3-D surface chart ...272
XY scatter chart...272
Radar chart ...273
Bubble chart ...273
Stock chart ...274
Numeric axis chart ...275
Gauge chart ...276
Gantt chart ...276
Funnel chart ...277
Histogram ...278
Different Chart Layouts for Different Data Types ...278
Seeing How Chart Placement Affects the Data It Represents...280
Troubleshooting Chart Problems ...281
Selecting data to make a chart readable and meaningful ...281
The placement of chart elements matters ...282
Chapter 16: Adding Geographic Detail with Maps . . . .283
Choosing the Right Crystal Reports Map ...283
Map layouts...284
Map types ...284
Map placement ...286
Creating a Map Step by Step...286
Creating an advanced layout map...286
Creating a Group layout map ...288
Creating a Cross-Tab layout map ...289
Creating an OLAP layout map...290
Including maps in subreports...291
Changing maps ...291
Part IV: Crystal Reports in the Enterprise ...303
Chapter 18: Crystal Reports Server . . . .305
Connecting to Data Sources...306
Connecting directly or indirectly ...306
Using Business Views to simplify connectivity ...306
Formatting Reports with Crystal Reports Developer...307
Providing Platform Services ...307
Publishing and distributing reports...307
Providing security ...308
Managing the system ...308
Useful Management Tools ...309
Application Services ...309
Web Services...309
Viewing and Interacting with Reports ...310
Chapter 19: BusinessObjects Enterprise Repository . . . .311
Adding Folders to Your Repository ...312
Storing Your Valuables in BusinessObjects Enterprise Repository ...312
Adding text and bitmapped objects to the Repository...313
Adding custom functions to the Repository...313
Adding SQL commands to the Repository...314
Using Repository Objects in a Report ...314
Adding text objects and images ...314
Adding custom functions ...315
Adding SQL commands ...315
Modifying a Repository Object ...315
Deciding Whether to Update Reports Automatically ...317
Deleting Objects from the Repository...318
Chapter 20: Navigating with Report Parts . . . .319
Understanding Report Parts Navigation ...319
Using Report Parts to Navigate a Report ...320
Using the Report Parts Drill-down method...321
Part V: Publishing Your Reports ...327
Chapter 21: Sending Your Reports Out into the World . . . .329
Printing Your Report...329
Faxing a Report...330
Exporting a Report...331
Export format types ...331
Export destinations...334
Troubleshooting Output Problems ...342
Chapter 22: Displaying Reports Online . . . .343
Exporting to a Static HTML Page ...344
Adding a Hyperlink to a Report...346
Distributing Reports via crystalreports.com ...349
Integrating with salesforce.com ...350
Publishing to crystalreports.com with Crystal Reports Desktop Publisher ...351
Interactive Report Viewing with Crystal Reports Viewer ...354
Opening a report in Crystal Reports Viewer ...355
Navigating a report...355
Printing a report ...359
E-mailing reports to your friends and co-workers ...360
Sharing reports in a variety of formats...360
Searching a haystack for that elusive needle ...361
Accessing reports on crystalreports.com...361
Chapter 23: SQL Expression Fields . . . .363
Creating an SQL Statement ...363
Modifying an SQL Statement...366
Part VI: The Part of Tens...369
Chapter 24: Ten Things to Do Before You Create a Report . . . .371
Chapter 25: Ten Ways to Give Your Reports More Pizzazz . . . .375
currently bundled into Microsoft’s Visual Studio .NET.) However, Crystal Reports 2008 is available as a standalone product. And if you want to produce a high-quality report quickly, Crystal Reports is the top choice to do the job.
About This Book
Crystal Reports 2008 For Dummiesis a book that gets you using Crystal Reports quickly and effectively. This book covers all the major capabilities of Crystal Reports but doesn’t bog you down in intricate detail. The objective is to give you the information you need to produce the types of reports that most people need most of the time. I also get into some out-of-the-ordinary report types that you might be called upon to generate on occasion.
Use this book as a handy reference guide. Each chapter deals with an individ-ual feature that you might need at one time or another. Pull out the book, read the chapter, and then do what you need to do. In many cases, step-by-step procedures walk you through commonly needed operations. You might find it worthwhile to put the book beside your computer and perform the operations while you read about them.
Anyone who might be called upon to produce a report based on database data can profit from the information contained in this book. It’s also valuable for managers who might never produce a report but who oversee people who do. This book tells you what’s possible, what you can do easily, and what takes a little more effort to accomplish. This knowledge can help you estimate how long it should take to produce reports of various types.
Conventions Used in This Book
Anything you see that is printed in a monospaced font is code, or something you’ll run across in the course of programming a database. This is a monospaced font.Crystal Reports executes code that you enter as formulas or SQL statements.
What You’re Not to Read
You can certainly choose to read this book from cover to cover, working through the examples, although you don’t have to. Regardless of whether you read it all the way through in order, think of this book as a handy quick reference by your side when you want to perform a particular operation you haven’t used in a while (or ever).
An upcoming section of this introduction explains the icons you’ll normally run across, and there is a good reason for paying attention to each of them. However, consider yourself exempted from the requirement to read anything that appears by a Technical Stuff icon.
Material placed next to one of these icons might be interesting to techies like me (and like some of you out there) but generally isn’t necessary for a full understanding of how to use Crystal Reports.
Foolish Assumptions
I’ve never met you, but I have to make a few assumptions about you and what you know. For example, I assume that you know how to use a personal com-puter and that you’re somewhat familiar with Microsoft Word. If you know how to navigate Microsoft Word, you already know almost all there is to know about navigating Crystal Reports. The user interfaces of the two products are similar.
I assume that you’ve seen directory trees before, such as those extensively used in Microsoft Windows. You know that if you see a plus sign (+) to the left of a node that shows a folder (or other) icon, it means that you can click the plus sign to expand that node to see what the node contains. Crystal Reports treats directory trees in a similar way.
Part I introduces you to Crystal Reports and the art of report creation. You find out what a report should accomplish and what it should look like. Then you fire up Crystal Reports and use it to create a simple report based on data held in a database.
Part II: Moving Up to
Professional-Quality Reports
You can do many things beyond the basics to make reports more focused, more readable, and easier on the eye. This part gives you the information you need to do all those things.
Part III: Advanced Report
Types and Features
Part III gets into serious report creation. With the information in this part, you can zero in on exactly the data you want and display it in the most under-standable way. You’ll be able to nest one report within another, pull report elements from multiple non-database sources, present multidimensional data in OLAP cubes, illustrate points with charts and maps, and create stunning visuals with Xcelsius and Flash. With these tools, you can produce reports fit for the eyes of the organization’s CEO.
Part IV: Crystal Reports in the Enterprise
Part V: Publishing Your Reports
After you create a report, you’ll want to make it available to the people who need it. Crystal Reports makes it easy for you to distribute your report for viewing, whether to colleagues in your organization or to Internet users around the world. In addition, you can publish your reports using traditional methods. You can print it; export it to a file, or fax it to people far away. After you complete report development, distribution is easy.
Although Crystal Reports does a great job when used all by itself, you can also incorporate it into applications written in a computer language. The Crystal Reports SQL Expression Fields facility gives you direct control over the data in a report’s underlying database. Because a version of Crystal Reports is included as an integral part of the Microsoft .NET application development environment, you can incorporate the power of Crystal Reports into applica-tions you write in Visual Basic, Visual C++, Visual C#, or any language compat-ible with the .NET framework. This gives the applications you write the sophistication of the world’s leading report writer.
Part VI: The Part of Tens
It’s always good to remember short lists of best practices. That’s what The Part of Tens is all about. Listed here are pointers that help you produce outstanding reports with minimum effort, in the shortest possible time.
Icons Used in This Book
Tips save you a lot of time and keep you out of trouble.
Pay attention to the information marked by this icon because you might need it.
As I mention earlier, Technical Stuff icons denote detail that I find interesting (and you might, too). However, if you don’t, no big deal. These nuggets aren’t essential to gain an understanding of the topic being discussed. Skip them if you like.
T
here’s data in them thar databases, where it’s not doing anyone any good by itself. And your manager wants a coherent report, based on that data, on her desk by the close of business today. What should you do? Panic? Consider joining the Foreign Legion?In This Chapter
䊳Outlining the major features of Crystal Reports 2008
䊳Viewing an existing report
C
omputers can store and process enormous amounts of data, and with the relentless advance of technology, those capabilities will soon become even more mind-boggling. Even now, the major challenge of getting value from computer systems isn’t to make them more powerful but rather to harness the power they already have and in a way that delivers useful information to people.Megabytes or gigabytes of raw data are neither meaningful nor useful to people. Instead, you need organized information, distilled and focused on answering specific questions. In businesses and enterprises of all kinds, organizing and presenting information has traditionally been the job of documents called
reports.These documents generally comprise multiple pages that can include text, numbers, charts, maps, and illustrations. The best reports convey the facts needed to make the best decisions, unobscured by a clutter of data irrelevant to the task at hand.
Crystal Reports,a leading report-writing application package for more than a decade, is by far the most commonly used report writer in the world. Many people have used Crystal Reports unknowingly for years because it’s often integrated with other applications and not specifically identified by name.
Major Features of Crystal Reports 2008
work together seamlessly to support report creation, modification, and distri-bution. And the tight integration extends beyond Crystal Reports 2008 to BusinessObjects Enterprise, making the sharing of reports across large enter-prises not only feasible but downright convenient.
The Explorers and Experts within Crystal Reports provide highly intuitive visual tools that step you through creating a report. Features such as the Repository (which applies to enterprise installations) and report templates allow users throughout the organization to reuse components or entire reports. There is never any need to reinvent the wheel. If a component in the Repository or a report template comes close to meeting your requirements but doesn’t meet them exactly, you can easily make minor modifications and have a usable report quickly, which is a vast improvement over creating an equivalent component or report from scratch.
Formatting a report
The primary job of a report writer, such as Crystal Reports, is to take data from a database and put it into a pleasing, logical, and understandable format for viewing. With Crystal Reports, you are well equipped to give your reports the appearance you want — without having to become a formatting guru.
Crystal Reports offers both absolute and conditional formatting:
⻬Absolute formattingenables you to put text, titles, charts, maps, columns of figures, cross-tabs, and graphics pretty much anywhere you want on the screen. You can handle preprinted forms. You can optimize for screen display or for printing on paper. This is close to the ultimate freedom in report creation — but not quite.
⻬Conditional formattingtakes you one step further toward the ultimate: Using it, you can change the format of the data you’re displaying in response to the content of the data itself. With conditional formatting, every time the data in a report changes, a formula that you include in the report can make the appearance of the report change accordingly.
Chapter 8 covers absolute and conditional formatting.
One especially useful feature of Crystal Reports 2008 — carried over from earlier versions — is the Report Alert. Suppose that a value being displayed crosses a critical threshold that requires immediate action on the part of the report’s target audience. When that threshold is crossed, not only is its value displayed, but also a Report Alert dialog box pops up that can’t be ignored.
of what it would normally cost. Actually, if you already own Crystal Reports, all it costs you is the label stock and the ink it takes to print on it. See Chapter 7 to find out how to include barcodes in your reports.
Enhancing a report with formulas
and custom functions
Did I mention that conditional formatting makes use of formulas to change the format of a report? Well, you can use formulas for far more than that. A
formulais like a little computer program that can do computations or other manipulations of data before displaying the result. This makes Crystal Reports more than merely a report writer that puts your data in a nice format. By using formulas, you can make your report select specific records (or groups of records) and display them the way you want, controlling that process by declaring and using variables in your formulas. All the common flow-control structures (If-Then-Else, Select Case, For, While Do, and Do While) are available.
And after you create a useful formula to use later, you can save it as a custom function. Custom functions are added to the standard functions that come with Crystal Reports, keeping them available in one place.
I discuss formulas in Chapter 10.
Getting visual with charts and maps
Crystal Reports has excellent capabilities for the graphical display of data. All the most commonly used chart types are available, so you can display your data in the most meaningful way. If you have geographical data, Crystal Reports can display it in maps that show countries, regions, provinces, or cities. A variety of methods are available to associate values with specific regions, including colors, symbols of various sorts, and even charts.
Xcelsius integration
The Xcelsius design tool is a companion product that integrates tightly with Crystal Reports. You can use it to create What-if scenarios in which a change of input parameters causes an immediate change in visual indicators. You can instantly see the result of a proposed change, before you make it. Turn to Chapter 17 for more information about Xcelsius.
Adobe Flash integration
You can also include Flash animation files within a Crystal report, including dynamic charts, graphics, and even video. Data in the report can be dis-played in a dynamic manner, using Flash. Crystal Reports 2008 makes it easy to include Flash content in your report. Chapter 17 gives some pointers on adding Flash animations to a Crystal report.
Displaying a report
Crystal Reports is designed for distribution in today’s highly connected busi-ness environment. You can build reports that are optimized for viewing on computers attached to your organization’s local area network (LAN). You can also put a report on the Web for folks viewing via Web connection and browser.
Distributing a report
You can get your report into the hands of its intended recipients in many ways — print and deliver, fax directly from your computer to a fax machine anywhere in the world, or export the report to a file.
data source that complies with the Microsoft OLE DB standard. Essentially, if your data exists in a commonly used modern data source, Crystal Reports can use it.
The Lone Edition of Crystal Reports 2008
Whereas previous versions of Crystal Reports came in multiple editions, each aimed toward a different audience, Crystal Reports comes in only one edition, which contains the full feature set. Now, you will never be disappointed to find that the edition you bought doesn’t do everything you want. You never need to upgrade as your requirements grow. One product does it all.
Viewing a Report
The majority of this book tells you how to create a new report from data in a database file, using Crystal Reports. It also tells you how to modify a report so you can create a new report (similar to, but distinct from, the existing one). These are concerns of the report designer. But what if you just want to viewa report that has already been designed?
The world has many more people viewing reports than creating reports: maybe even you! No problem. Before I launch into telling you how to create reports in subsequent chapters of this book, I briefly describe the simple process of viewing reports that already exist.
Reading a printed report
For some kinds of information, however, printed reports aren’t as valuable as those you can view online. For example, printed reports aren’t updated when the database from which they were derived is updated. Thus, printed reports might contain obsolete — thus misleading — information. This is a factor you must always bear in mind when basing decisions on printed reports.
Viewing a report with Crystal Reports
As you might expect, you can do more than just create or modify a report with Crystal Reports software: You can also view an existing report. This has some major advantages over reading a printed report, provided that you have Crystal Reports software installed on your computer:
⻬The report is connected to the source database while the report is being viewed.This is an obvious advantage. If the data in the database has changed since the last time you viewed it, you can refresh the report before you view it again by pulling current information from the data-base. Crystal Reports automatically checks the database to see whether it has been updated since the last time your report was run. If so, it asks whether you want to refresh the report with current data.
⻬You can use the drill-down capability of Crystal Reports to selectively view the detail underlying summary reports.This enables you to get an overview of the subject by viewing the summary, and then drill down into the specific parts that interest you for more detail. (For more on drill-down, see Chapter 6.)
⻬Viewing a “live” report gives you access to the way Crystal Reports uses hyperlinks.You can follow a hyperlink from one part of a report to another part, from one report to another report on the same computer, or from one report to a report on another computer on your network.
⻬You can view reports that include color graphics or color text.For the many people who don’t have high-speed color printers, this provides a way to access the full richness of a report’s contents.
To view an existing report (on a computer with Crystal Reports installed), follow these steps:
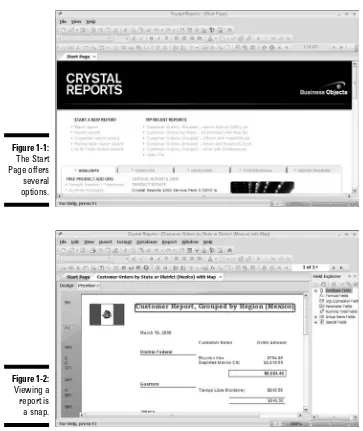
1. Launch Crystal Reports from your computer’s Start menu.
Figure 1-2:
Viewing a report is
a snap.
Figure 1-1:
3. Move through the report.
Scroll around the report, and move back and forth among its pages. You can drill down into any summary report that supports drill down. If the report contains hyperlinks, you can follow them to other locations in the report or in other reports.
4. When you’re finished viewing the report, choose File➪Close to close it.
Viewing a report on a LAN or on the Web
You can use Crystal Reports Server (a separate product) to display your reports to 20 simultaneous users on a LAN, or use BusinessObjects Enterprise to dis-tribute the report to thousands of enterprise users or millions of users on the World Wide Web. Users on a LAN that’s directly connected to Crystal Reports Server can use the free Crystal Reports Viewer to access the reports they need.
In This Chapter
䊳Starting Crystal Reports
䊳Creating your first report
䊳Printing your report
䊳Troubleshooting your report
W
hen you start Crystal Reports, you generally want to do one of three things:⻬Create a report.
⻬Modify a report.
⻬Run a report against the data in your database.
You use reportsto take data from a database and then process, format, and finally output that data to a printer, computer screen, or Web site.
You probably chose Crystal Reports because you have a database that con-tains information that’s important to you. In all likelihood, the data in that database changes with time, and you want to be able to keep up with its current status. Sure, you couldretrieve the information you want by making SQL queries, but that would be too much like work. It’s far better to create a report with Crystal Reports, and then run the report whenever you want the latest status of the information of interest. You need to create the report only once, and then you can run it many times, getting the latest results with each successive run. You don’t have to learn SQL or any other method of pulling data from a database. Reports created with Crystal Reports are easy to build, easy to read, and easy to understand. What could be better?
charts, graphs, and maps. You could even crank out a full-length science fic-tion novel with Crystal Reports if you wanted to (although other tools are better suited to that task).
In this chapter, I walk you through building your first report from scratch, using the Crystal Reports sample data as its basis. The sample’s tables are filled with data that you can manipulate and display with Crystal Reports. You can use this sample data as the basis for your first report. And if you’re not exactly sure what you need to choose from the sample database in this first-run report, don’t worry: I take you through all your choices, including which tables and what data items to use, how to manipulate the data, format-ting the report, and ways to output the report.
First Things First: Finding
the Sample Database
Crystal Reports has a sample database you can use for practice. It’s a Microsoft Access database for a fictitious bike shop, named Xtreme Mountain Bikes, Inc. If you don’t have a copy of xtreme.mdbon your computer, you can download a copy (a Zip file) from the Business Objects Web site at
http://support.businessobjects.com/downloads/samples.asp
Unless you recently downloaded the sample database, you probably have an older version of xtreme.mdb. This older version works fine. With the 2008 release, Business Objects made a serious attempt to reduce the “installation footprint” of the product. To do that, Business Objects left out a number of files that had been included in earlier versions. Many of these (including
xtreme.mdb) are available for download from the Business Objects Web address.
The xtreme.mdbdatabase contains a number of database tables that are representative of the tables that a real-world bike wholesaler might maintain. As I mention earlier, these tables are filled with sample data that you can manipulate and display with Crystal Reports.
Starting Crystal Reports 2008
You can choose from among five different ways to start a new report. You can create a Crystal Reports document by using one of several wizards or by starting with a blank report. Alternatively (as I demonstrate in Chapter 1), you can open a report that already exists, either to change it or to run it.
Although using the wizard can be a time- and labor-saver, it does constrain the form of a report. The special-purpose report wizards, such as the Cross-tab Report Wizard, are great for creating certain specialized reports. This chapter takes you right to the point and shows you how to create a report
yourway, starting from a blank report instead of using a report wizard.
Figure 2-1:
Welcome to Crystal
Reports!
several formats, but primarily it deals with the data in relational databases. Relational data-bases contain data in one or more tables that are organized like spreadsheets, with rows and columns. Each table contains data items that are related to each other. One table might con-tain data on a company’s customers. Another
Creating a Report with the
Blank Report Option
As I allude in the introduction of this chapter, here’s what you need to decide upfront when creating a report:
⻬Which tables in the database contain the data you want
⻬Which data items you want from those tables
⻬What manipulations of the data to perform to give you the information you want
⻬How you want your report to be formatted
⻬Whether the users of your report will retrieve it from a black-and-white printer, color printer, local computer screen, or Web site
For now, imagine you already know all those things.
To create a report from scratch, follow these steps:
1. Start Crystal Reports.
The Crystal Reports Start Page appears; refer to Figure 2-1.
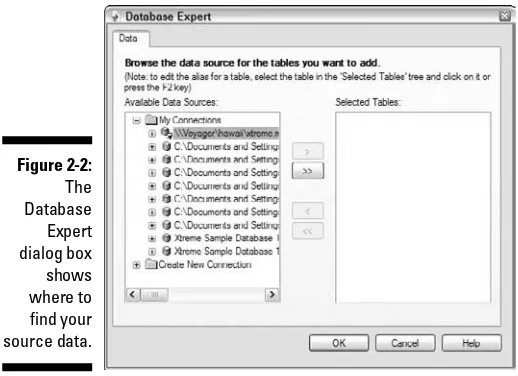
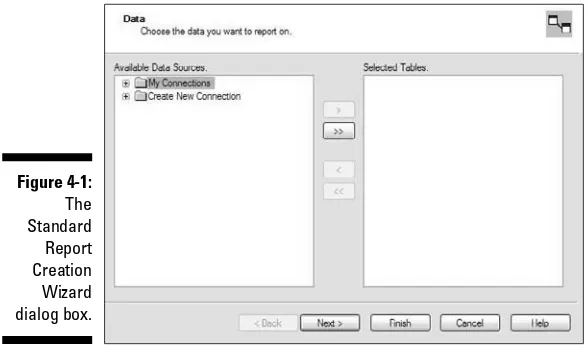
2. Select the Blank Report option.
The Database Expert dialog box appears, as shown in Figure 2-2, which shows you possible places to find the source of your data.
Figure 2-2:
You must select the right type. If you don’t know which type is correct, ask someone familiar with the data source.
To follow along with this example, double-click Access/Excel (DAO). The Access/Excel (DAO) dialog box appears, as shown in Figure 2-3.
5. Click the ellipsis (...) button to the right of the Database Name field.
The Open dialog box appears. If you are lucky, it displays the folder that contains the xtreme.mdbdatabase file. The sample database —
xtreme.mdb— is located wherever you placed it after you downloaded it. You might have to browse to find this file on your system.
6. Locate the xtreme.mdbon your computer and click the Open button to open the database file and dismiss the Open dialog box. Then, back in the Access/Excel (DAO) dialog box, click Finish.
Database Expert reappears, as shown in Figure 2-4, with the xtreme.mdb
database connected. You can tell the connection is successful if you see Add Command, Tables, Views, and Stored Procedures listed below the connection in the Available Data Sources pane.
Figure 2-3:
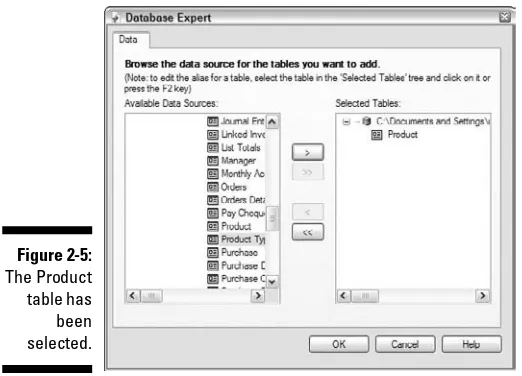
7. Expand the Tables node, and then double-click the table on which you want to base your report.
To follow along with the example, double-click Product.
The reference is moved to the Product table from the Available Data Sources pane to the Selected Tables pane as shown in Figure 2-5.
8. Click OK to close Database Expert.
A blank report fills the window, as shown in Figure 2-6.
Figure 2-5:
The Product table has been selected.
Figure 2-4:
The
xtreme. mdb
The Design tab (on the left edge) shows five sections of the report:
⻬Report Header:Appears only at the top of the report; the first thing that a viewer sees
⻬Page Header:Appears below the report header and at the top of all other pages in the report
⻬Details:The actual content of the report
⻬Report Footer:Appears after the last detailed information in the report
⻬Page Footer:Appears at the bottom of every page of the report
The toolbars at the top of the window give you immediate access to the major features of Crystal Reports. You are probably already pretty familiar with the first two toolbars, the Standard toolbar and the Formatting toolbar. They are similar to the corresponding toolbars on any Windows application, with a few additional items are specific to Crystal Reports. If you hover your cursor over any of these, a tooltip appears, telling you what each one is.
The third toolbar actually combines three separate toolbars: the Insert Tools toolbar, the Expert Tools toolbar, and the Navigation Tools toolbar. Figure 2-7 shows these toolbars.
Figure 2-7:
The Insert Tools (top), Expert Tools (middle), and Navigation Tools (bottom) toolbars.
Figure 2-6:
Allocating more space to the layout
Depending on the resolution of your computer screen, the Crystal Reports window might not display the full width of your report. You can give yourself a little more width in your display by changing one of the display options. Follow these simple steps:
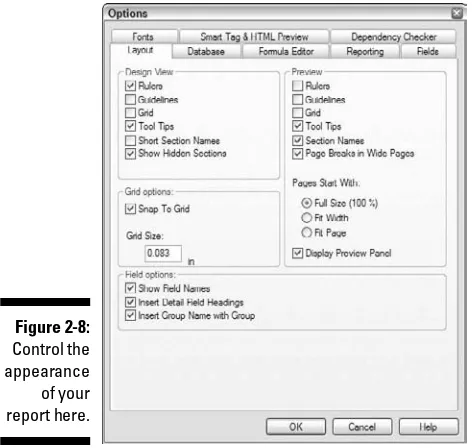
1. Choose File➪Options.
The Layout tab of the Options dialog box appears, as shown in Figure 2-8. Think of this as Control Center for the appearance of your report.
2. In the Design View section, select the Short Section Names check box.
This reduces the section names on the left edge of the window to one- or two-letter abbreviations, freeing up a little horizontal real estate.
3. Click OK.
4. Drag the left edge of Field Explorer farther to the right.
You won’t need Field Explorer right away. It’s your primary tool for placing data into your report.
This allocates more horizontal space to the work area, which allows you to view more of the report without resorting to horizontal scrolling.
Figure 2-8:
If you are Xtreme Mountain Bikes — and for this example, you are — the target audience for your Products report is potential customers. They surely will want to know what products you carry, including information on color and size, where appropriate. They probably want price information. They’ll also need to know the stock number of an item so they can specify it properly when they decide to purchase a bike.
Adding a company logo to a report header
Placing your company logo in the report header also makes sense. Unfortunately, the Xtreme logo isn’t available conveniently on the Crystal Reports distribution CD or on the Business Objects Web site. For the pur-poses of this demonstration, any logo-sized image file in one of the popular image file formats such as JPEG or GIF will do. BMP files are not supported, however. You can add one to the report header along with a title, such as
Product Price List.
To add a logo to a report, do the following:
1. Dismiss Field Explorer, if necessary, by clicking the X in its upper-right corner.
2. With the Design tab selected, click the Insert Picture icon on the Insert Tools toolbar.
You can find out the name of a toolbar icon (such as Insert Picture icon) by hovering your cursor over it. After a few seconds, a tooltip appears, telling you the name of the tool.
A dialog box appears, displaying the image files in the Databases folder. I had no image files in my database folder, so I looked around until I found a sample report with the logo on it. I copied it, saved it to JPEG format, and then inserted it into my report. Perhaps you’ll find a suitable image. Anything that is approximately the right size and shape is fine. Your organization’s own logo would do, as would a drawing your child made.
3. Click the picture’s filename to select it, and then click the Open button. An outline of the logo appears on the report layout. Place it in the upper-left corner of the report header with the mouse, and then click to fix it in place.
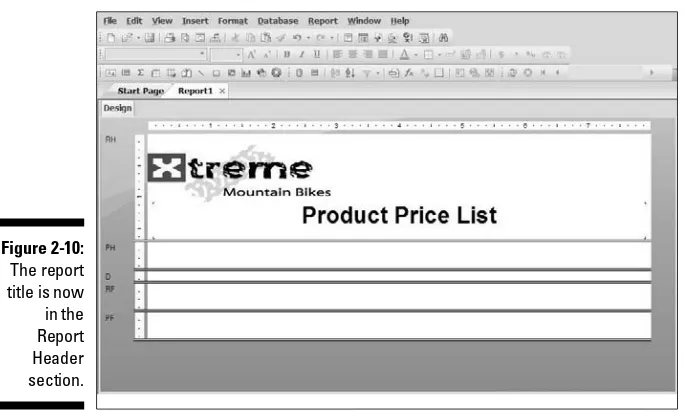
Adding a report title to your report header
Next, put a report title into the Report Header section. To do this, you use several tools from the Insert toolbar.
1. Pull down the dividing line between the Report Header section and the Page Header section so that you can place the report title below the level of the logo.
To pull down a dividing line, hover the cursor over it until the cursor changes shape, click and hold the left mouse button, drag the line to where you want it, and then release the mouse.
2. Click the Insert Text Object icon on the Insert Tools toolbar.
The cursor changes to a plus sign (+).
3. Move the cursor into the Report Header section, just below the logo. Click the mouse button to establish the upper-left corner of the text box and then drag across the page and release the button at the lower right of the Report Header section.
A text cursor starts to blink inside the rectangle you created.
4. At the blinking cursor’s location, type the report title.
For the example, type Product Price List.
5. Select the title you just typed, and then increase its size by clicking the Increase Font Size icon on the Formatting toolbar.
Figure 2-9:
Choosing the fields that
appear in your report
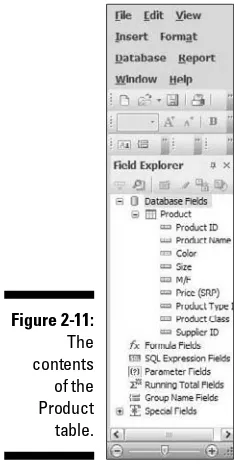
The next logical step is to place in the Details section the fields you want the report to display. Simply follow these steps:
1. In Field Explorer, click the plus sign to the left of Database Fields; click the plus sign to the left of Product to display its fields.
Because the Product table is the only available data source, it’s the only one listed.
If Field Explorer isn’t visible, choose View➪Field Explorer from the main menu.
Field Explorer displays the fields in the Product table, as shown in Figure 2-11.
Figure 2-10:
2. Click the first field that you want to include in the report, and then drag it to the left edge of the Details section.
For this example, click the Product ID field. When you drag the field, a rectangle appears. The field name appears in the rectangle in the Details section and also above it in the Page Header section. Later, you might want to change the column titles in the Page Header section for cos-metic reasons. For now, just leave the default column titles.
3. Repeat Step 2 for any other fields that you want to include in the report.
For this example, place the Product Name, Color, Size, and Price (SRP) fields in order in the Details section, leaving just a little space between them.
Crystal Reports 2008 automatically adjusts the fields displayed to match the field sizes you chose, and also spaces them proportionally. You can manually adjust the field sizes by grasping the handles on the left and right edges of the fields and moving them. Resize the fields and move them back and forth until you arrive at a good balanced appearance.
At this point, your report layout should look similar to the one shown in Figure 2-12.
Figure 2-11:
The contents
Improving the readability of page headers
Everything in the Page Header section appears just below the Report Header on the first page of the report and at the top of all following pages. By default, the field names in the Page Header section are displayed in a normal font and underlined. I think they look better in a bold font and not underlined, so I select the Bold attribute for each of them and deselect the Underline attribute. I’ll wait to see what the report looks like before deciding whether I want to change the font size as well. Figure 2-13 shows the layout with the enhanced column headings.
Figure 2-13:
Modify column headings to improve
their appearance.
Figure 2-12:
Previewing the report
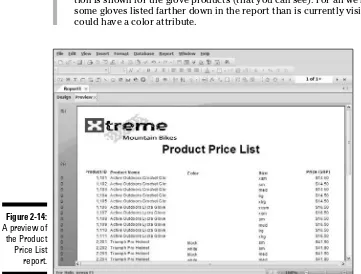
So far, you’ve been able to see the layout of your report only in the sectioned structure of Design mode. To get a better idea of what the report looks like at this point, switch to Preview mode by clicking the Print Preview icon on the Standard toolbar. This displays the Preview tab in the upper-left corner of the work area and displays your report, complete with data pulled from the Products table. Figure 2-14 shows as much of the report as the screen can hold.
Note a few things about the report at this point.
⻬Crystal Reports automatically inserts commas between groups of three digits in number fields, such as the Product ID field. This is not what you want.
⻬The Product Name field isn’t wide enough to display the full names of some products.
⻬The Color attribute must not apply to gloves because no color informa-tion is shown for the glove products (that you can see). For all we know, some gloves listed farther down in the report than is currently visible could have a color attribute.
Figure 2-14:
to change.
For this example, right-click in the Product ID field.
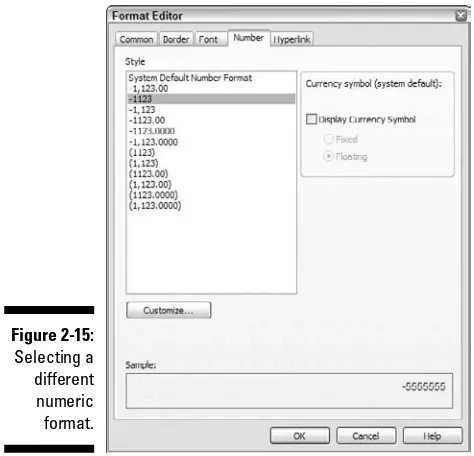
3. From the contextual menu that appears, choose Format Field.
Format Editor appears.
4. From the Number tab, choose the numeric format that you want and then click OK.
For this example, you want the format with no commas, as shown in Figure 2-15. This changes the format of the Product ID field to eliminate the unwanted commas.
Figure 2-15:
To fix the field width issue
1. Back in Design mode, click in the Product Name box in the Details area to select it, and then move the cursor over the right edge of the box.
The cursor changes to a two-headed arrow (<--->).
2. Drag the right edge of the box further to the right, to allow more room for long product names.
Verify your changes by returning to Preview mode. The commas are gone, and the product names are now fully visible. By moving the sliders at the right and bottom edges of the report window, you can verify that all columns and rows are as they should be.
Page footers carry useful information
The bottom of each page offers you a great opportunity to display useful information, such as page number. (Hint:If you’ve ever dropped a stack of reports off your desk, you know that page footers can be a valuable aid to putting them back in the proper order.)
When using the Product Price List, a report title and the date printed are valuable additions to the page footer. (Prices tend to change frequently in a fast-moving industry such as the mountain bike business, so the date of a price list is very important.)
In Design mode, follow these steps to create a page footer for your report that includes these three items (title, page number, and date printed).
Here’s how to put useful information into a page footer:
1. Back in Design mode, click the Insert Text Object icon on the Insert Tools toolbar.
For this example, all the items you want to place in the page footer are text items.
2. Place the text object rectangle in the Page Footer section and expand it to cover the full width of the page.
3. Click the Align Center icon.
You expand a node by clicking the plus sign to its left.
2. Click the Print Date icon or the Print Date name next to it, and drag it to the Page Footer area, right after the comma.
3. After the Print Date field is in position, type a comma and space after it, and then type Page followed by a hyphen.
4. In Field Explorer, click the Page Number icon or the name next to it, and drag it to the right of the hyphen.
This gives you an arrangement that looks much like Figure 2-16.
5. Click the Preview tab at the top of the work area to switch to Preview mode.
The field names are replaced by actual values, as shown in Figure 2-17.
Figure 2-16:
Wrapping things up with a report footer
For some types of reports, you want a final item to close out the report, appear-ing after the last of the data on the final page. These are report footers, which are different than page footers. A report footercomes immediately after the last line of detail information but before the final page footer. This would be a good place, for example, to put a grand total for the entire report. If your report does not have a grand total, you can use this section in other ways.
To illustrate this feature of Crystal Reports, put a company slogan at the bottom of the Product Price List. Place the slogan Xtreme Mountain Bikes Take You to the Limitinto the Report Footer section the same way that you put the report title into the Page Footer section. (See the preceding section for the details on how to do this.) The result, in Preview mode, looks like Figure 2-18.
Recording helpful information
about your report
If you’ve followed this chapter to this point, the Product Price List report is essentially complete. Now you might want to generate some descriptive information about the report that’s associated with the report but not nor-mally printed or displayed. Crystal Reports has a provision for this. To add some descriptive information, follow these steps:
Figure 2-17:
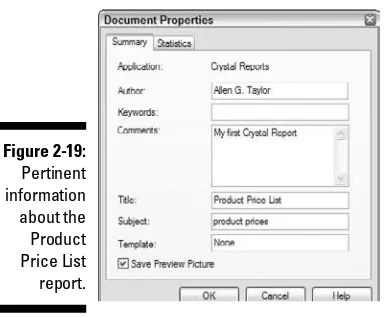
1. Choose File➪Summary Info.
The Document Properties dialog box appears.
2. Fill in the text boxes with whatever information you want to associate with your report.
I added the information shown in Figure 2-19.
3. Click OK.
The document properties you entered are stored along with the report; they can be retrieved whenever anyone views the report with Crystal Reports.
Figure 2-19:
Pertinent information about the Product Price List report.
Figure 2-18:
Use a company slogan as
Printing a Report
Printing a report from Crystal Reports is really easy. Open the report in Crystal Reports and then click the Print icon or choose File➪Print➪Printer. Print the report the same way you would print any document in Microsoft Windows.
Where to Go from Here
Sometimes the vision you have in your mind is not adequately reflected in the report you produce. Perhaps your vision isn’t something that can be built in the real world. You can’t do much about that. But you can do something about other reasons, such as not using Crystal Reports properly or not being aware of all its capabilities.
As I mention at the beginning of this chapter, Crystal Reports gives you tremen-dous freedom in how you can lay out your report as well as what you can include. Maybe text works better than columns of numbers, or your report might benefit from using graphical images.
䊳Deciding what your report should include
䊳Linking a report to a database
䊳Laying out a report
䊳Conveying the right message
N
o book can tell you in a step-by-step manner exactly how to build the report you want. However, in this chapter, I show you some general principles of good report design as well as some common types of reports. From those general principles and examples, you can decide how best to design reports that meet your specific needs.Defining an Effective Report Design
An effective report design depends on many factors:
⻬The data that the report draws from the database
⻬How the database is structured
⻬The level of detail that the users of the report require
⻬The purpose of the report
⻬The capabilities of the computer that displays or prints the report
⻬What the users of the report really need (understanding this is critical)
Defining Your Audience
Some potential audience members might be familiar with the information that the report contains. These people might prefer a streamlined presenta-tion of the data. Other audience members might be unfamiliar with the report content, so you might have to translate terms, use graphical devices (such as charts), and include explanatory text. If you have two such divergent audi-ences, consider producing two reports. Both contain the same information, just presented in different ways.
Other questions to ask are, “What information does the audience need, and in what form should it be delivered?” If your audience needs different sets of facts for different purposes, you might be better off creating several reports, each one focused on one specific purpose.
Although writing a report with one consistent audience in mind is the best approach, sometimes you have to design a report for multiple audiences, each with its own needs. The challenge is to give each audience the informa-tion they need in a form they can easily understand, without handicapping the members of other audiences by subjecting them to irrelevant material. The key is to organize the information so members of each audience can quickly and easily find and understand the information of interest to them. Make sure to place critical information in a prominent place.
Defining the Report’s Purpose
In addition to having a specific audience, your report should be restricted to one specific purpose — and accomplish that purpose by providing thorough, accurate, and timely information to the target audience. This information, more often than not, is the basis for important decisions that the readers of the report will make.
Restricting a report to serving a single purpose does everyone a favor. Reports that cover multiple topics generally don’t do justice to any one of them and tend to confuse readers. A good report covers a single topic and conveys a message that the reader can easily comprehend and act upon.
Knowing how important the report is to its audience can also affect the amount of time and effort you put into creating it. Is the report likely to be a basis for “bet-the-business” decisions? Or does it simply make visible some facts that are nice to know but not earth-shattering?
ence wants to base upon the information in the report, it’s time to decide exactly what information should be inthe report. Leaving out distracting, irrelevant material is just as important as including material of interest.
The best reports are succinct and to the point, offering readers the informa-tion they want right away, minus the clutter of informainforma-tion they don’t care about. Keeping in mind the audience and the purpose of the report, also consider what level of formality or informality is most appropriate.
If your report has to meet the needs of several audiences, shape its content along these lines:
⻬Determine which audience is the most critical.
⻬Determine which information is the most important to that audience.
⻬Display the most important information most prominently in the report.
⻬Put other, less-important information for the most critical audience in a nearby but subordinate position.
⻬For the other audiences, cluster the information in such a way that each group reading the report can find all the information it needs within a single area of the report.
Choosing the Report Appearance
After you determine your audience and what the report needs to contain, the next decision is how to present that information to that audience. Information can be presented in a report in many different ways — narrative text, tables of numbers, and (between those two extremes) various other methods, each effective in its own way for certain kinds of display.
Making a good first impression
The old adage goes that when you meet folks for the first time, they form an impression of you within the first 30 seconds. They decide whether they like you, trust you, or respect you. That snap judgment, based on 30 seconds of input, affects how they deal with you from then on.
Salespeople have known the truth about first impressions for a long time, which is why they “dress for success” when making a sales call. They want to make a good first impression so their prospect will be predisposed to like them, trust them, respect them, and buy from them. For all the same reasons, you want every report you create to make a good first impression so its read-ers buy into what you’re selling: the information in your report.
One important way to make a good first impression is to make the appear-ance of your report appropriate for the audience and for the occasion. Know who your audience members are and what they expect this particular report to tell them. When they look at the first page of your report, it should imme-diately meet their expectations. They should see a clear indication of what the report is, and an engaging presentation of the information they’re most interested in.
Thus, burying the most important information somewhere in the back pages of the report would be a mistake. For some reports, it may even be appropri-ate to stappropri-ate the conclusions that can be drawn from the data, right up front. It can encourage readers to dig deeper and digest the data pulled from the database that backs up your conclusions.
Deciding how best to present
the information
The Report Creation Wizard, accessible from the Crystal Reports 2008 Start Page, gives you a total of six different ways to format your report: columnar, tabular, or justified layout, in either portrait or landscape orientation. For reports that don’t have to impress anybody (or for quick-and-dirty reports that you intend to run only once), one of these six options is probably fine. I show you how to use the Report Creation Wizard in Chapter 4.
figures that back up the graphs. Other types (such as membership lists for organizations) won’t benefit from graphs or charts.
Pictures — such as photographs, illustrations, line drawings, or even Flash animations — can greatly increase the value of some types of reports by pre-senting the information in an immediate, visual way. The more pathways into the brains of the readers you use, the more likely that they’ll fully receive and appreciate your message.
If you think that a graph, chart, or other illustration would improve the understanding and acceptance of the content of a report, consider adding such an illustration. If you think such an addition would not improve things, then don’t include one. Extraneous illustrations can distract from the mes-sage your report is supposed to convey.
Style communicates meaning, too
The text, numbers, and graphs in a report embody the data, but how these report elements are put together — as well as the judicious use of fonts, color, layout, and white space — can also make an impression on the reader. You want that impression to be favorable. Give some thought to how to use all these style elements together to create the desired effect.