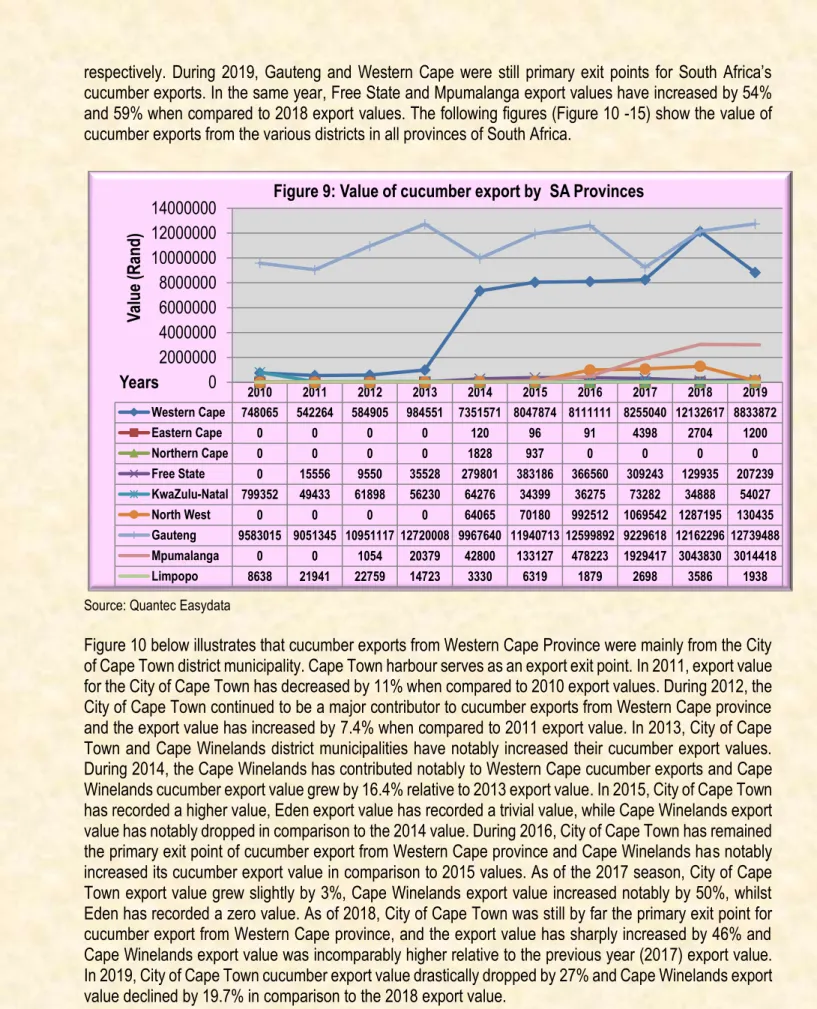
In 2019, City of Cape Town's cucumber export value dropped drastically by 27% and Cape Wineland export value dropped by 19.7% compared to the 2018 export value. During 2011, cucumber export value for KwaZulu Natal dropped drastically compared to the previous year. At the same time, Ethekwini export value decreased by 23% compared to the 2012 export value.
During 2016, Ethekwini remained the primary export point for KwaZulu Natal cucumbers, with export value slightly up by 5.4% compared to 2015 export value. In 2013, the export value of Ehlanzeni has increased significantly and this can be attributed to an increase in the export of cucumbers to neighboring Swaziland. In 2015, the export value of the Mpumalanga cucumber has increased significantly and this can be attributed to an increase in exports destined for neighboring Swaziland.
The high value of cucumber exports from the Mpumalanga province can be attributed to the notable increase in cucumber exports to neighboring Mozambique and Swaziland. In 2017, the export values of Nkangala and Ehlanzeni cucumbers were incomparably higher compared to the export value in 2016, which can be attributed to 28%. In 2018, the value of North West cucumber exports was incomparably higher compared to export values in 2017, which can be attributed to a 35% increase in the value of cucumber exports destined for Botswana.
Share analysis
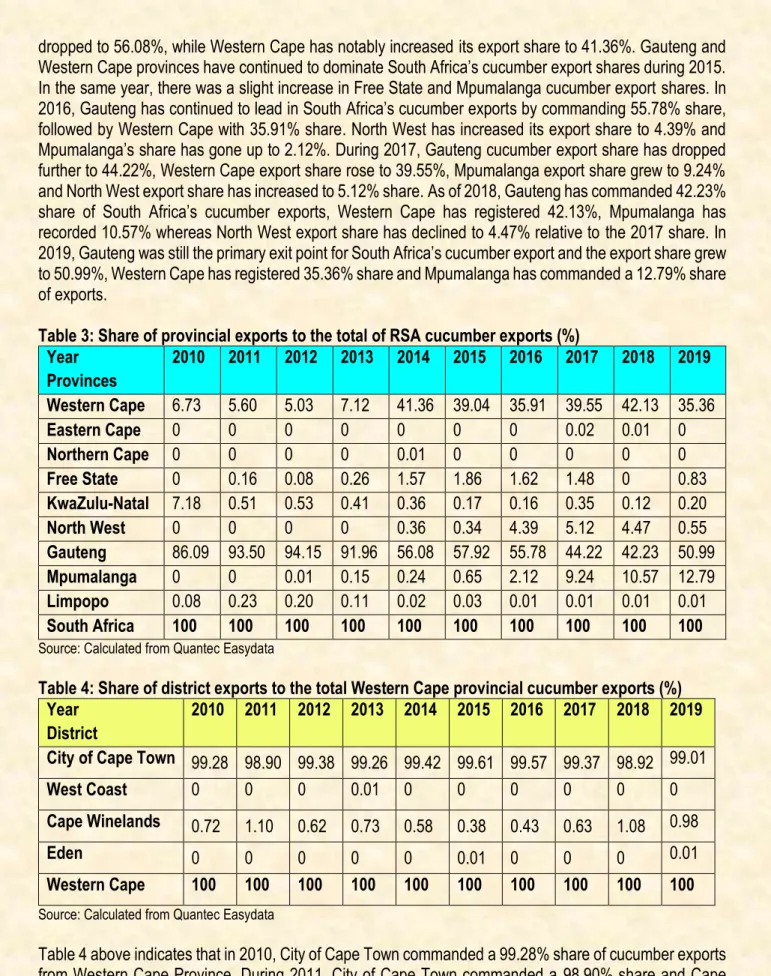
North West increased its export share to 4.39% and Mpumalanga's share rose to 2.12%. From 2016 to 2019, the City of Cape Town continued to be the primary point of departure for cucumber exports and the district accounted for approximately 98% of the Western Cape cucumber export share. During 2013, Ekurhuleni increased its export share to 3.06%, City of Johannesburg's export shares decreased compared to the previous year's export value.
In 2015, the City of Johannesburg continued to lead Gauteng cucumber exports with a 59.13% share, while the City of Tshwane's export share fell slightly to 21.14%. At the same time, Ekurhuleni's export share fell to 15.99% and the West Rand's export share increased to 3.74%. In the same year, Sedibeng contributed to Gauteng's share of cucumber exports for the first time, but the share was negligible.
Johannesburg City's share of cucumber exports dropped significantly to 47.64% in 2017, Ekurhuleni recorded a notable increase in cucumber export share of 24.22% and Tshwane's share of exports increased to 28.13%. As of 2018, Ethekwini continues to command the highest share of 91.66% of Gauteng's cucumber export share, with Zululand's share of exports significantly increasing from the previous year (2017) to 8.34%. In 2018, Nkangala was still the leader in the share of Mpumalanga cucumber exports, reaching 91.38%, with Ehlanzeni registering.
In 2012 Vhembe maintained a high export share and in 2013; The district of Vhembe had a 100% share in the cucumber export from the province of Limpopo. In 2016, the Capricorn district increased its export share of cucumbers to 49.44% and the export share of Capricorn cucumbers increased to 50.56%. Mangaung commands 12.31% and Xhariep has a 7.25% share of the total provincial export share of Free State in 2014.
Thabo Mofutsanyane export share has decreased to 69.29% during 2017, Lejweleputswa export share grew to 22.84% and Mangaung has recorded a 5.24% share of cucumber exports. As of 2019, Thabo Mofutsanyane's cucumber export share increased to 69.59%, while Lejweleputswa's export share decreased significantly to 20.23%.
Cucumber imports by South Africa
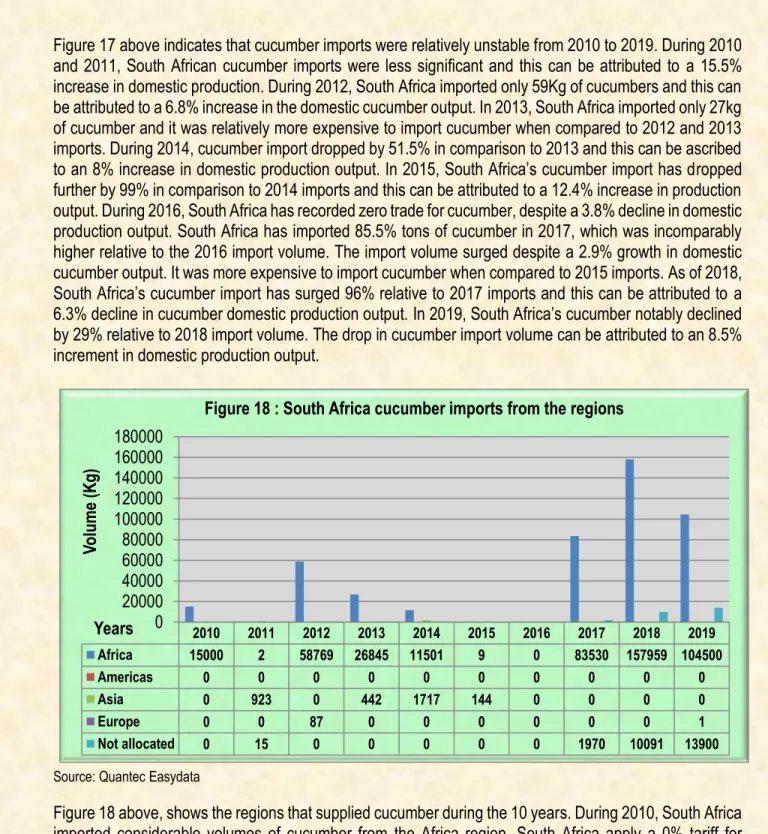
During 2012, South Africa imported only 59Kg of cucumbers and this can be attributed to a 6.8% increase in domestic cucumber production. In 2013, South Africa imported only 27 kg of cucumber and it was relatively more expensive to import cucumber compared to 2012 and 2013 imports. In 2015, South Africa's cucumber imports fell further by 99% compared to 2014 imports and this can be attributed to a 12.4% increase in production output.
In 2016, South Africa recorded zero trade in cucumbers despite a 3.8% decrease in domestic production. As of 2018, South Africa's cucumber imports have increased by 96% over 2017 imports, which can be attributed to a 6.3% decrease in domestic cucumber production. In 2013, South Africa imported cucumbers from Africa and Asia (Hong Kong, Turkey and China).
In 2014, Africa (Eswatini) and Asia (India) remained the main suppliers of cucumber imported from South Africa. During 2015, South Africa imported cucumber from the Asian region; however, the import volume was insignificant. During 2017, South Africa imported a significant volume of cucumbers from the African region (Namibia and Eswatini) and had
As of 2018, the Africa region (Namibia and Eswatini) was still the main supplier of South African cucumber imports. In 2019, the Africa (Namibia) region was still the main source of South African cucumber imports and unallocated imports have increased significantly by 38% compared to 2018 imports. At the same time, Western Cape has contributed to the Southern African cucumber imports, but the import value was insignificant.
In 2018, Gauteng province was fairly the primary entry point for cucumber imports from South Africa, followed by the Western Cape, with Mpumalanga also recording notable import value. As of 2019, the Western Cape was the main entry point for cucumber imports from South Africa and Gauteng recorded an insignificant import value.
Cucumber processing
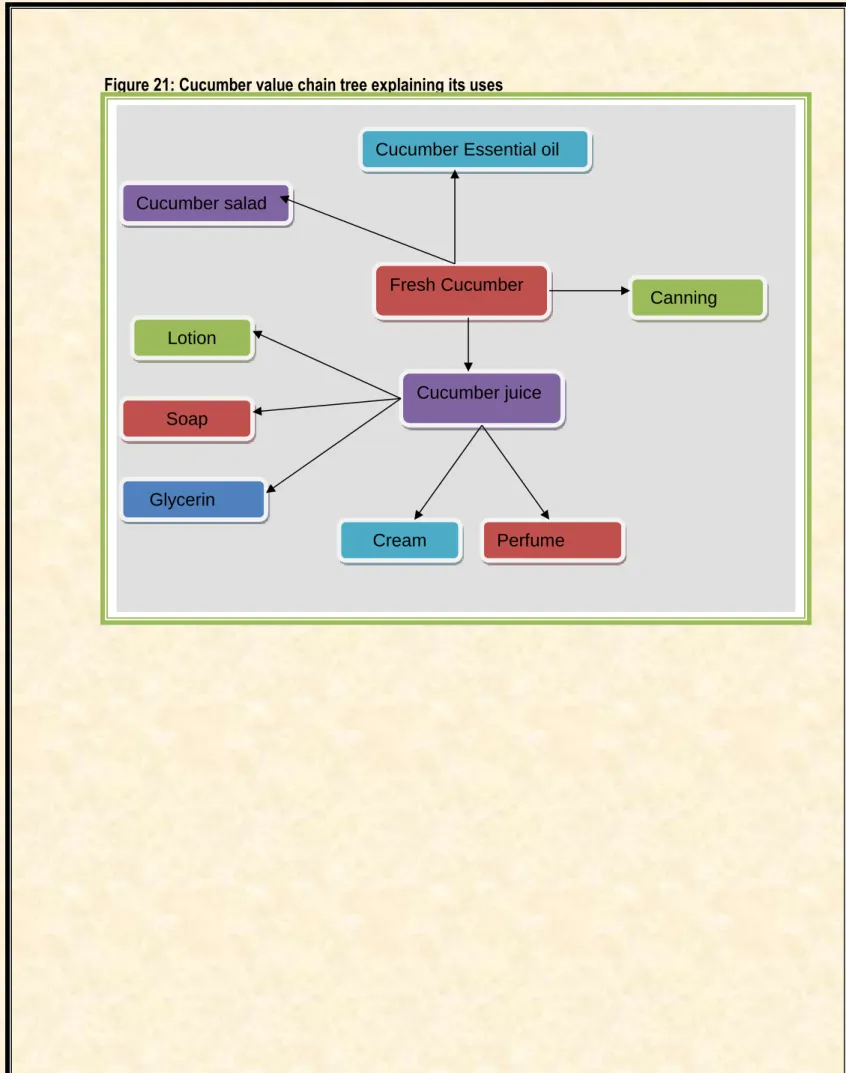
In 2017, the Western Cape was by far the main entry point for cucumber imports, which can be attributed to neighboring Namibia supplying 95.3%. The high imports recorded for the Western Cape can be attributed to the 86.1% share of imports from neighboring Namibia. The cucumber value chain can be broken down into the following levels: cucumber producer (farmers), packing house owner (who cleans, controls quality and quality); cold storage and transport facilities (storage and transport of cucumbers on behalf of farmers);
MARKET INTELLIGENCE 1 Tariffs
Non-tariff barriers .1 The European Union
- Product legislation: phytosanitary regulations
- Product legislation: packaging
- Non-legal market requirements: social and environmental accountability
- Consumer health and safety requirements
Non-tariff barriers can be divided into barriers that are mandatory and enshrined in the legislature of the European Commission, and those that result from consumers, retailers, importers and other distributions. There are a number of pieces of EU legislation that regulate the quality of products that can be imported, marketed and sold within the EU. EU marketing standards, which regulate the quality and labeling of vegetables, are laid down in the CAP framework under Regulation EC 2200/96.
These regulations include diameter, weight and class specifications, and any products not meeting these standards will not be allowed to be sold on EU markets (detailed lists of products and their standards can be found in the annexes to the directive). The EU has set its own specific rules in EC 2002/89, which try to prevent EU crops from coming into contact with harmful organisms from elsewhere in the world. The core of the directive is that it authorizes the Plant Protection Service to inspect a large number of plant products upon arrival in the EU.
If the shipment does not meet the requirements, it is not allowed to enter the EU. However, certain organisms can be fumigated at the expense of the exporter. The EU Commission sets rules for materials that come into contact with food that can endanger human health or cause an unacceptable change in the composition of food. For the most part, these revolve around quality and the perception of European consumers about the environmental, social, health and safety aspects of both the products and the production techniques.
While supplying vegetables that comply with these issues may not be mandatory in a legal sense, they are becoming increasingly important in Europe and cannot be ignored by existing or potential exporters. i). Social responsibility is becoming important in the industry, not only among consumers, but also for retailers and wholesalers. The largest sellers in the EU also play an important role in dealing with environmental issues, which means exporters need to take these into account when negotiating export agreements. ii) Environmental issues are becoming increasingly important to European consumers.
The EU Commission has recently adopted an EU label to identify food produced according to the EU's organic standards in Directive EEC 209/91. Increased consumer awareness of health and safety issues has prompted a number of safety initiatives in Europe, such as EUREPGAP on Good Agricultural Practices (GAP) from the main European retailers, the international management system for HACCP, which is independently certified and required by law for European producers and food imported into Europe (EC and ISO 9000 management standard system (for procedures and work methods), which is certified by the International Standards Organization (ISO).
The United States
If exporters do not ship products in packaging that is suitable for reuse, they may be liable for costs incurred by importing companies. In order to gain access to the market, importers must meet not only the legal requirements listed above, but also the demands and requirements of the market. Social Accountability 8000 (SA8000) certification is a management system based on International Labor Organization (ILO) conventions that addresses issues such as child labour, health and safety and freedom of association, and requires an on-site audit. performed annually.
Asian Market Access
GENERAL DISTRIBUTION CHANNELS
LOGISTICAL ISSUES 1 Mode of transport
For every 10oC increase above the recommended temperature, the rate of respiration and the ripening of products can increase twice or even three times. Loss of color will also occur faster if kept in the same room with apples, tomatoes or other ethylene producing crops. If, on the other hand, fresh pickles are to be stored or stored for a short period before being processed or placed in brine tanks, the cucumbers must be cooled as quickly as possible to 10°C.
COMPETITIVENESS OF SOUTH AFRICAN CUCUMBER EXPORTS
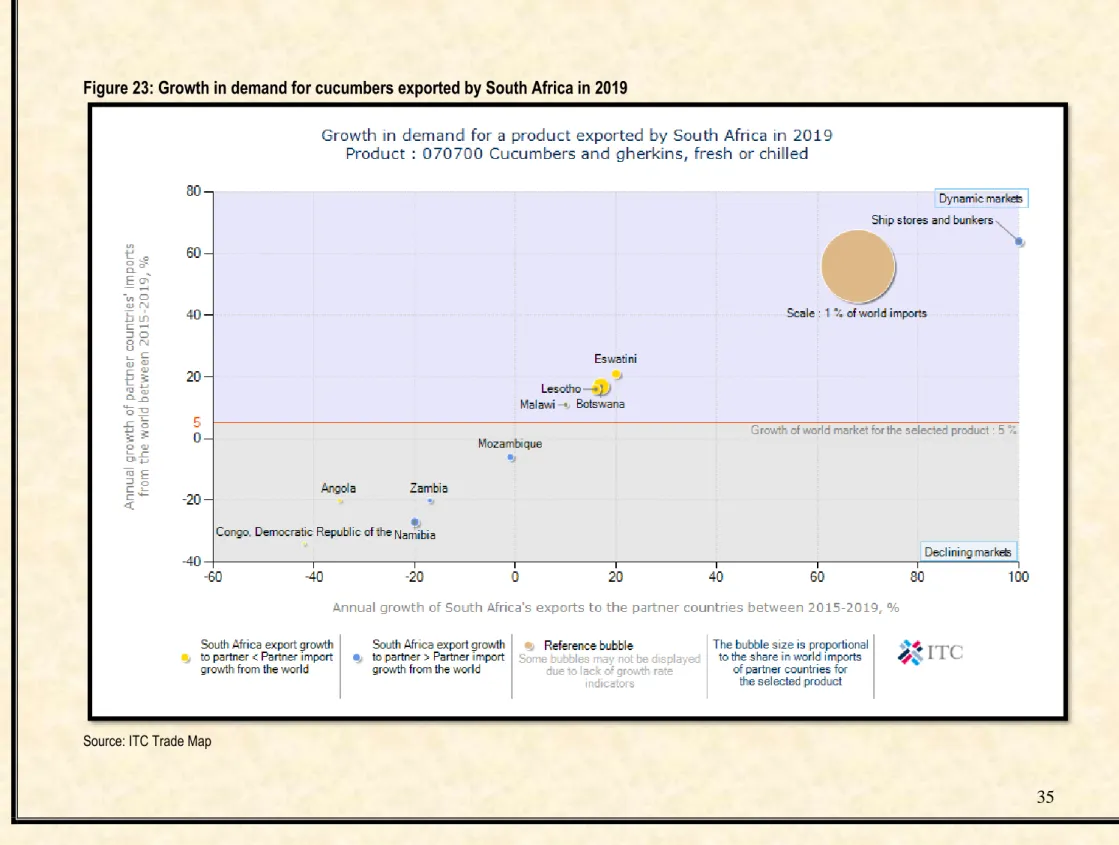
Even under these conditions, cucumbers cannot be expected to store satisfactorily for more than 2 to 3 weeks. Potential export markets for South African cucumbers exist in the United Kingdom and Germany. However, if South Africa is to diversify its cucumber exports, the most profitable market exists in Malawi and the United States of America, which have increased their world cucumber imports by 11% and 7% respectively between 2015 and 2019.
ACKNOWLEDGEMENTS