SURFACE SUBSIDENCE MONITORING AND ANALYZING IN BEIJING BASED ON
INTERFEROMETRIC POINT TARGET ANALYSIS
Yi Suna,b Lijun Lub
a Shandong University of Science and Technology, Qingdao, China [email protected]
b Key Laboratory of Geo-Informatics of State Bureau of Surveying and Mapping, Chinese Academy of Surveying and Mapping,
Beijing,China
KEY WORDS: interferometric point target analysis(IPTA); surface subsidence; permanent scatterers(PS); baseline refinement;
atmospheric delay; temporal decorrelation; geometrical decorrelation;
ABSTRACT:
Temporal and geometrical decorrelation often prevents SAR interferometry from being an operational tool for surface deformation
monitoring.Moreover, atmospheric disturbances can strongly compromise the accuracy of the results. In order to solve the above
problem. In this paper, Interferometric Point Target Analysis (IPTA) technology was used to obtain surface deformation information
with an area of 700km2 in Beijing. In the experiment, 20 TerraSAR-X images from October 2014 to June 2016 were selected to monitor the surface subsidence in Beijingand higher resolution and higher accuracy WorldDEM obtained by DLR was used to simulated terrain
phase, so as to register the high-resolution TerraSAR-X image. The final results show the surface subsidence tendency of Beijing urban
from October 2014 to June 2016: in the center of monitor area surface tends to be stable within approximately subsidence rate of 3mm/a.
In the east of monitor, the area of Chaoyang and Tongzhou, there are obvious subsidence phenomenon。This subsidence is affected by
groundwater exploitation, flake subsidence it had an tendency of expanding to the east and south, and the maximum annual subsidence
is more than 76mm/year. The results of this monitoring are basically consistent with the published data of surface subsidence in Beijing.
INTRODUCTION
Due to a great deal of groundwater exploitation, serious surface
subsidence occurred in some areas of Beijing. Surface subsidence
is a long and slow process with reaction hysteresis, which is
difficult to be detected and monitored in a short time range, but
once it happens, the damage is unbearable to contemplate. For
the city, surface subsidence causes the damage of urban piping
system and drainage system, such as pipe distortion and
deformation fracture, which seriously affects the safety of
production and normal life.
Interferometric Point Target Analysis (IPTA) can achieve high
precision inversion of surface deformation by processing the
phase information on the stable point target and maximum
overcoming the influence of decorrelation factors and
atmospheric delay. It has the advantages of short monitoring
period, wide coverage and low application cost.
1. IPTA TECHNOLOGY
IPTA technology is an improvement of PS-InSAR technology in
permanent scatterers (PS) points identified on the time series
SAR interferogram to establish a permanent scatterer network
with time series stable and highly reflective features(Yu X,
2012a). It calculates and separates the baseline error phase, the
DEM residual phase, the atmospheric phase, the surface offset
phase and so on by the iterative processing of the unwrapping
phase of the difference interferogram. Thus, the high-precision
surface deformation variables and the accurate DEM model of
the region are obtained. There are two main advantages of IPTA
technology, one is the refinement of vertical baseline information
and the iterative solution of deformation parameter and elevation
correction, another is that all data processing processes are
completed in vector mode, greatly reducing the amount of data
and improving the efficiency of data processing(Zhang H, 2016).
In IPTA processing, the interference phase can be decomposed
into:
ϕ = ϕ _ + ϕ _ + ϕ + ϕ b+ ϕ� + ϕ �(1)
where ∅=Point target interference phase
ϕ _ ,ϕ _ =The linear and nonlinear deformation
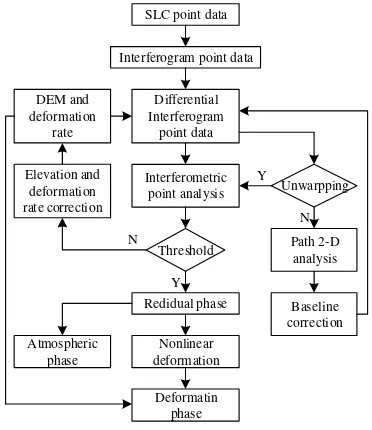
IPTA technology is a process of modifying the model parameters
from coarse to fine by constantly iterating. It uses initial
parameter estimation model to generate model phase, and
analyzes residual error to extract elevation error and shape
change rate correction. The model parameters are improved by
the correction value of the solution, and the nonlinear
deformation and the separation of the atmospheric phase are
carried out according to the different spatial and
temporal characteristics of each phase component. The improved
model parameters are further improved by this idea, so that the
phase of each part is closer to the true value. The specific process
shown in Figure 1(Zhang H, 2016).
SLC point data
The PS point target is considered as a good coherent target, and
it can maintain a good frontal stability for a long time and can
reflect the true deformation of the ground surface. The PS point
detection methods used in IPTA are amplitude dispersion index
thresholding method and correlation coefficient thresholding
method.
On the high signal-noise ratio pixel, the phase noise level can be
measured using the temporal amplitude information. The phase
standard deviation of the PS points based on the high
signal-to-noise ratio (SNR) approximates the amplitude deviation index,
therefore the PS point is selected by the reciprocal of amplitude
dispersion index thresholding(MSR)( Yu X, 2012b and Ding W,
2011).
MSR = �
�� (2)
where � =Time series amplitude mean value
�=Time series standard deviation
Another method, IPTA takes the mean value of the coherent
graph of the time series and selects the PS points by using the
γ �� =�1∑�=1� (3)
where γ �� =The coherent graph of the jth interferogram
M = Number of interferograms
2.2 Elevation Eorrection and Linear Deformation Rate
Solution
The second difference of the differential phase of the adjacent
point target can weaken the influence of the atmospheric delay
phase and the nonlinear deformation phase. The quadratic
differential phase model based on the adjacent point target can be
obtained by combining the equation (1) (Zhang H, 2016).
∆ϕ, =�� i �−4� ⊥∆ε, −4��∆v,� + ∆ϕ � , ,(4)
where ∆ε,=Elevation correction of adjacent point target
∆v, =Deformation rate difference of adjacent point target
The differential interferogram is analyzed by temporal two
dimensional regression analysis. The∆ε, and∆v, values
ofγ,are obtained as the estimated parameters. Then we construct
an irregular triangulation with a limited side length and select the
more stable point in the study area as the reference point. We use
the regional network adjustment method to calculate the
elevation error correction value and the shape change rate
correction value of each vertex in the triangulation network
relative to the reference point.
2.3 Baseline Refinement
Orbital error is the baseline error in InSAR. The baseline error
phase is linearly related to the spatial scale and exists in the form
of residual fringes and in the interferogram. Therefore, it is
important to refine the baseline to improve the accuracy of
deformation parameters. IPTA uses the least square method to
refine the baseline vectors based on the corrected elevation
values and the unwrapping phase information. In this paper, first
of all, we remove the phase noise of the residual phase by using
the spatial filtering. Then the Minmum Cost Flow (MCF) method
is used to unwarp the residual phase and obtain the more accurate
unwrapping phase. Finally, the error equations are established for
the unwrapping phase based on the corrected elevation values
and the baseline parameters are estimated by the least squares
method.
2.4 Atmospheric Phase and Nonlinear Deformation Phase
Separation
The residual phase mainly includes nonlinear deformation,
atmospheric phase and noise. Ingeneral, the atmospheric delay
phase can be treated as a temporally high-frequency signal and
the nonlinear deformation phase as a low-frequency signal that
accumulates during a timespan comparable to that of the
interferogram (Ferretti A, 2001 and Berardino P, 2002.)。 However the atmospheric delay phase have relatively low
spatial frequency. This is the basis for multi-temporal InSAR
processing, which can be used to separate the effects of
tropospheric delays and nonlinear ground surface
deformation。
3. DATA PROCESSING ANALYSIS
3.1 Experimental Data and Area
In this paper, 20 images of the TerraSAR-X data and the
high-precision DSM product WorldDEM produced by DLR in Beijing
were processed by using IPTA technology, and the results of
surface subsidence from October 2016 to June 2017 were
obtained and analyzed.
The imaging mode of TerraSAR-X data used in this experiment
is StripMap with a resolution of 3 meters and a revisiting period
of 11 days. In addition, the resolution of the high-precision
WorldDEM DSM products is 12 meters. The elevation accuracy
is better than 2m in flat area and is better than 4m in the mountain.
The horizontal precision is better than 10m. Using worldDEM
can improve the precision of analog phase, reduce the influence
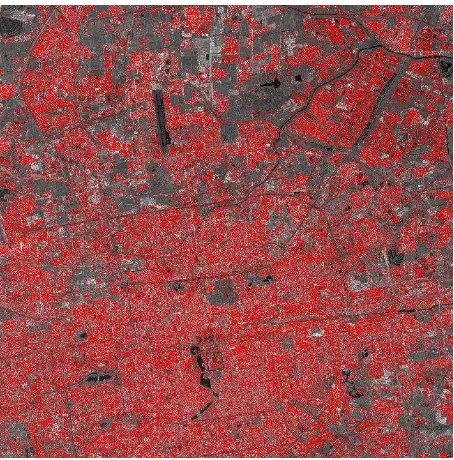
to the impact of SAR and the influence of DSM coverage, the
SAR images were cut and selected in the area of about 700km² in
Beijing. The coverage area of the SAR image is shown in Figure
2.
Figure 2.Coverage area of SAR image
In order to ensure high temporal coherence of interferogram, in
the acquired 20 scene of TerraSAR-X data, we select 3 scene
images of adjacent time as a set of a small baseline set which
consists of 70 pairs of interference pairs. The interference
connection diagram is shown in Fig 3. X represents the time base
of each interference pair, and Y represents the vertical baseline of
each interference pair.
Figure 3. Connection diagram
3.2 PS Point Selection
In this experiment, the PS point is selected by Applying the
method of Section 2.3, and the threshold of the selected point is MSR > 2 ∩ γ �� > 0.5 , and 1462710 initial candidates are selected, as shown in Figure 4. As can be seen from the
diagram, the PS points screened under the higherMSR and γ �� thresholds are mainly distributed on artificial buildings such as roads and houses. There is almost no point in rivers,
lakes and other waters. It shows that there are abundant and high
quality targets in urban area. Due to the short wavelength of the
X-band of SAR image, the interference pattern has low coherence
in natural area such as farmland and woodland, so there are few
PS points.
3.3 Result and Analysis
Figure 4. Distribution map of the initial candidate point
The results of surface subsidence monitoring in Beijing area
using IPTA technique are shown in figure 5. As can be seen from
the diagram, most of the ground surface (Beijing City Center) in
the monitoring area is relatively stable in monitoring time, and
there is a large area of surface (Eastern Beijing city) subsidence
on the left side of the monitoring area. From the north to the south
a large sheet deformation zone (Chaoyang Yuegezhuang -
Tongzhou Anding camp) has formed. The deformation area is
7.5km in the east-west direction. The total area is about 90km².
Figure 5. Surface deformation results
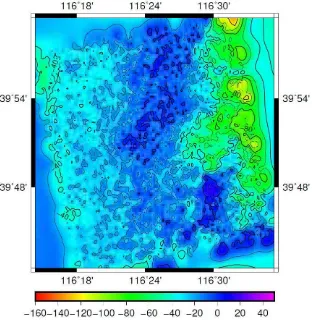
The accumulated deformation values of all PS points in the
monitoring area are interpolated, and the contour map of the
accumulated deformation variables in the monitoring area is
drawn, as shown in figure 6. As can be seen from the diagram,
there are three deformation centers in the monitoring area,
corresponding to the three points of A, B and C in figure 3. Point
D and E are the deformation points in the center of the two
deformation centers. Point A, B, C, D and E relative to the
reference point cumulative settlement are -129m,
-120mm,-126mm, -60mm and -54mm. The settling rates of A, B, and C
relative to the reference point are 76mm / year, 70mm / year,
-75mm / year, -33mm / year and -30mm / year. Therefore, the
maximum cumulative shape variable in this region exceeds
129mm and the maximum strain rate exceeds 76mm/year. Data
show that nearly half of Beijing's water supply comes from
underground water. The groundwater level was dropped by one
meter from 2011 to 2015. The deformation area is located in the
CBD area of Beijing. With a large population, huge water
consumption and unique geological conditions, the region is
seriously subsiding(Chen B, 2017).
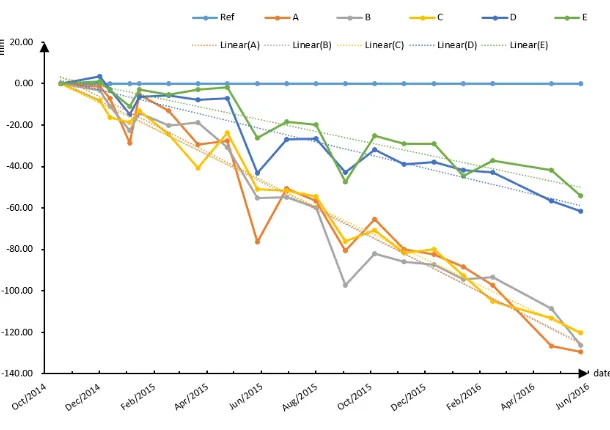
Figure 7. Cumulative deformation of the line graph
Figure 7 is A, B, C, D, E five points relative to the reference point
of the cumulative deformation of the line graph. As can be seen
from the diagram, the deformation tendencies of A, B and C are
consistent, and the deformation tendencies of D and E are
consistent. However, the deformations of D and E have a lag in
time relative to the deformation center. D and E were basically
stable before July 2015 and no obvious deformation occurred.
After July 2015, obvious deformation occurred. The above
phenomena indicate that the deformations of the region first
occur at A, B, C. As time goes by, the deformation range is
expanding, so that three independent deformation points are
connected to form a large area of sheet deformation area. And the
range of deformation still has the trend of enlargement.
4. CONCLUSION
In this paper, we used IPTA technology to deal with 20 scenes of
TerraSAX-X SAR images of Beijing and monitored three
deformation centers. The maximum cumulative shape variable
exceeds 129mm and the maximum strain rate exceeds 76mm/year.
And the range of deformation still has the trend of enlargement.
The impact of groundwater exploitation on urban surface
subsidence is still serious. At the same time, due to the limited
data, this paper does not verify the accuracy of the monitoring
results, and later I will collect other monitoring data for
verification. In addition, there are some error phases in data
processing which cannot be effectively separated and eliminated.
More accurate solution model is the focus of subsequent research.
REFERENCES
Berardino P, J., 2002. A new algorithm for surface deformation
monitoring based on small baseline differential SAR
interferograms. IEEE Transactions on Geoscience & Remote
Sensing, 2003, 40(11):2375-2383.
Chen B, J., 2017 Characterization and causes of land subsidence
in Beijing, China. International Journal of Remote Sensing, 38(3),
pp.808-826.
Ding W, D., 2011. Study of PSInSAR on the technique of points
selection and phase unwrapping. Central South University.
Ferretti A, J., 2001. Permanent scatterers in SAR interferometry.
IEEE Transactions on Geoscience & Remote Sensing, 39(1),
p.8-20.
Yu X, J., 2012a. Application of IPTA method in surface
subsidence monitoring of San Pedro Bay Port. Science and
Surveying and Mapping, 37(6), pp.21-25
Yu X, D., 2012b. Improved SBAS technology for land
deformation detection and groundwater application. Central
South University.
Zhang H, J., 2016. Application of IPTA method in surface
subsidence monitoring. Journal of Geomatics Science and