Journal of Life Sciences
Volume 7, Number 2, February 2013 (Serial Number 58)
David Publishing Company www.davidpublishing.com
Publication Information
Journal of Life Sciences is published monthly in hard copy (ISSN 1934-7391) and online (ISSN 1934-7405) by David Publishing Company located at 9460 TELSTAR AVE SUITE 5, EL MONTE, CA 91731, USA.
Aims and Scope
Journal of Life Sciences, a monthly professional academic journal, covers all sorts of researches on molecular biology, microbiology, botany, zoology, genetics, bioengineering, ecology, cytology, biochemistry, and biophysics, as well as other issues related to life sciences.
Editorial Board Members
Dr. Stefan Hershberger (USA), Dr. Suiyun Chen (China), Dr. Farzana Perveen (Pakistan), Dr. Francisco Torrens (Spain), Dr. Filipa João (Portugal), Dr. Masahiro Yoshida (Japan), Dr. Reyhan Erdogan (Turkey), Dr. Grzegorz Żurek (Poland), Dr. Ali Izadpanah (Canada), Dr. Barbara Wiewióra (Poland), Dr. Valery Lyubimov (Russia), Dr. Amanda de Moraes Narcizo (Brasil), Dr. Marinus Frederik Willem te Pas (The Netherlands), Dr. Anthony Luke Byrne (Australia), Dr. Xingjun Li (China), Dr. Stefania Staibano (Italy), Dr. Wenle Xia (USA), Hamed Khalilvandi-Behroozyar (Iran).
Manuscripts and correspondence are invited for publication. You can submit your papers via Web Submission, or E-mail to [email protected] or [email protected]. Submission guidelines and Web Submission system are available at http://www.davidpublishing.com.
Editorial Office
9460 TELSTAR AVE SUITE 5, EL MONTE, CA 91731, USA Tel: 1-323-9847526, Fax: 1-323-9847374
E-mail:[email protected], [email protected]
Copyright©2013 by David Publishing Company and individual contributors. All rights reserved. David Publishing Company holds the exclusive copyright of all the contents of this journal. In accordance with the international convention, no part of this journal may be reproduced or transmitted by any media or publishing organs (including various websites) without the written permission of the copyright holder. Otherwise, any conduct would be considered as the violation of the copyright. The contents of this journal are available for any citation. However, all the citations should be clearly indicated with the title of this journal, serial number and the name of the author.
Abstracted / Indexed in
Database of EBSCO, Massachusetts, USA Chemical Abstracts Service (CAS), USA Cambridge Scientific Abstracts (CSA), USA
Chinese Database of CEPS, American Federal Computer Library center (OCLC), USA Ulrich’s Periodicals Directory, USA
Chinese Scientific Journals Database, VIP Corporation, Chongqing, China Universe Digital Library S/B, Proquest
Subscription Information
Price (per year): Print $520, Online $360, Print and Online $680.
David Publishing Company
9460 TELSTAR AVE SUITE 5, EL MONTE, CA 91731, USA Tel: 1-323-9847526, 323-410-1082; Fax: 1-323-9847374 E-mail: [email protected]
David Publishing Company www.davidpublishing.com
J LS
Journal of Life Sciences
Volume 7, Number 2, February 2013 (Serial Number 58)
Contents
Biotechnology and Molecular
97 Impact Assessment of Diesel Oil on the Zhe Oyster (Crassostrea plicatula) Using RAPD Analysis
Anglv Shen, Chunyan Ma and Liu Shao
105 Automatic segmentation of Colon Cancer Cells Based on Active Contour Method: A New
Approach
Jamal Charara, Alaa Hilal, Ali Al Houseini, Walid Hassan and Mohamad Nassreddine
110 Development of Biotechnology for Microbial Synthesis of Gold and Silver Nanoparticles
Tamaz Levan Kalabegishvili, Ivane Giorgi Murusidze, Elena Ivan Kirkesali, Alexander Nikoloz Rcheulishvili, Eteri Nikoloz Ginturi, Eteri Simon Gelagutashvili, Nana Eremey Kuchava, Nanuli Vakhtang Bagdavadze, Dodo Trofim Pataraya, Manana Amiran Gurielidze, Hoi-Ying Holman, Marina Vladimirovna Frontasyeva, Inga Ivanovna Zinicovscaia, Sergey Sergeevich Pavlov and Vasiliy Timofeevich Gritsyna
123 Cloning and Expression of the Serine Carboxypeptidase Gene in Zea mays and Its Antifungal
Activity against Rhizoctonia solani
Li Liu, Xiujing He, Zhiming Zhang, Maojun Zhao, Jing Wang, Haijian Lin, Ya’ou Shen and Guangtang Pan
131 Biosecurity Threats about the Combination of Aerobiology, Morphology and Genetic
Manipulation of Fungal Spores
Manousos E. Kambouris, Aristea Velegraki, George P. Patrinos and Konstantinos Poulas
Botany and Zoology
135 Stability of Cereal Crops to Drought and Saline Stress in Vivo and in Vitro
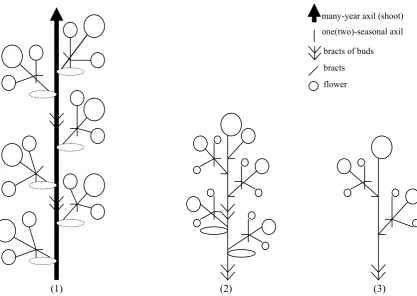
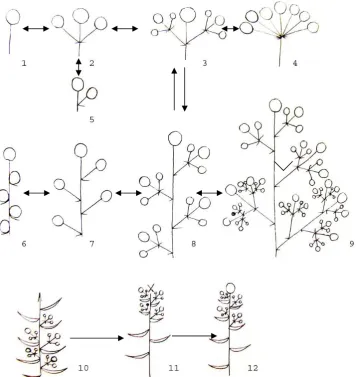
145 Diversity and Evolution of Inflorescences in Celastrales
Ivan A. Savinov
153 Morphogenesis of Oil Palm Fruit (Elaeis guineensis Jacq.) in Mesocarp and Endocarp
Development
Hermine Bille Ngalle, Joseph Martin Bell, Georges Franck Ngando Ebongue, Lambert Nyobe, Félix Chancelin Ngangnou and Godswill Ntsefong Ntsomboh
159 Effects of Aqueous Extracts of Seeds of Peganum harmala L. (zygophyllaceae) on 5th Stage
Larvae Locusta migratoria cinerascens (Fabricius, 1781) (Orthoptera: Oedipodinae)
Abdelmadjid Benzara, Abdellah Ben Abdelkrim and Ouassila Khalfi-Habes
165 Genetical Crossbreeding Effect on the Zootechnical Performances of the Domestic Rabbit
(Algeria) x Californian
Mefti Korteby Hakima, Kaidi Rachid, Sid Sihem, Boukhelifa Ahmed, Derradji Billel, Kenchache Youcef and Mareche Hachemi
Interdisciplinary Researches
171 Hyaluronidase Prooffor Endothelial Glycocalyx as Partaker of Microcirculation Disturbances
Alexander Maksimenko, Askar Turashev, Andrey Fedorovich, Anatoly Rogoza and Elena Tischenko
189 Characterization of Fresh Cheese with Addition of Probiotics and Prebiotics
Natália Chinellato Azambuja, Patrícia Blumer Zacarchenco, Luciana Francisco Fleuri, Juliana Cunha Andrade, Izildinha Moreno, Ariene Gimenes Fernandes Van Dender and Darlila Aparecida Gallina
196 Salinity Risk and Management in Tunisian Semi Arid Area
Mohamed Hachicha, Sabri Kanzari, Mohsen Mansour, Omar Jouzdan and Awadis Arselan
202 Biochar for Soil Management: Effect on Soil Available N and Soil Water Storage
Yeboah Edward, Antwi Boasiako Ohene, Ekyem Seth Obosu, Tetteh Francis Marthy and Bonsu Kwasi Offei
210 Factors Associated with Physical-Activity Performance by Older Individuals in a Medium-Sized
City in São Paulo State, Brazil
Feb. 2013, Vol. 7, No. 2, pp. 97-104
Journal of Life Sciences, ISSN 1934-7391, USA
Impact Assessment of Diesel Oil on the Zhe Oyster
(
Crassostrea plicatula
) Using RAPD Analysis
Anglv Shen1, Chunyan Ma1 and Liu Shao2
1. East China Sea Fisheries Research Institute, Chinese Academy of Fishery Sciences, Shanghai 200090, China
2. College of Fisheries and Life, Shanghai Ocean University, Shanghai 201306, China
Received: September 10, 2012 / Accepted: December 03, 2012 / Published: February 28, 2013
Abstract: The lethal and sublethal effects of oils on aquatic organisms have been widely investigated, but the potential molecular impacts of oils on aquatic organisms are remaining unclear now. In order to realize the effects of diesel oil on the Zhe oyster, the RAPD (random amplified polymorphic DNA) technique was used. RAPD is a useful assay procedure for the detection of genotoxin-induced DNA damage and mutations. In the present study, the Zhe oysters were exposed to diesel oil at different concentrations and for different exposure periods. The results showed that the DNA band change in RAPD profiles of oysters following diesel oil treatment included loss of normal DNA bands, the appearance of new DNA bands and variations in DNA intensity compared to oysters not exposed to diesel oil. The effects of changes to GTS (genome template stability) were time- and concentration-dependent, the GTS of 10 mg/L was 82.46%, 80.70% and 63.15% in the 8, 16 and 32 days, the GTS of 20 mg/L was 75.44%, 71.93% and 56.14% in the 8, 16 and 32 days, the GTS of 40 mg/L was 73.68%, 70.18% and 56.14% in the 8, 16 and 32 days, respectively. The DNA polymorphisms detected by RAPD analysis could be used as a useful biomarker assay for the detection of genotoxic effects in diesel oil pollution on the oysters, and may be useful for environmental contamination risk assessment.
Key words: Diesel oil, Zhe oyster, RAPD, GTS, DNA damage, biomarker.
1. Introduction
Oysters, known as “milk of the sea”, are considered delicious, nutritious and protein-rich, with a variety of unsaturated fatty acids, amino acids, vitamins and
minerals. The Zhe oyster (Crassostrea plicatula) is an
important member of China’s coastal shellfish population and has a high economic value. It is considered a native species and is widely distributed in China, with the production of this oyster reaching
3.62 × 10⁶ metric tons in 2002, accounting for 37.6%
of the total annual marine molluscan yield [1]. Bivalves (such as oysters) are widely used as sentinel organisms for monitoring the concentration of selected pollutants in coastal environments, such as heavy metals, organo-chlorine compounds and petroleum
Corresponding author: Liu Shao, Ph.D., lecturer, research field: marine environmental science. E-mail: [email protected].
hydrocarbons have long been recognized as the most deleterious contaminants to biota in the world’s marine and estuarine waters, oysters have become good bio-indicators of environmental pollution in coastal and estuarine ecosystems because they, as filter feeders, bioaccumulate contaminants [2].
level changes of oil on aquatic organisms, such as micronucleus frequency, DNA repair, cytochrome P4501A, DNA adducts, DNA single strand breaks, microsatellite and AFLP loci were also studied [22-27].
Recently, the RAPD (random amplified polymorphic DNA) assay has been used to detect possible damage in the genomic DNA of organisms in ecotoxicology as a good biomarker [28-34]. The RAPD assay presents some advantages: RAPD assays lie in the PCR-based technique being easy identification of regions of amplification, deletion or rearrangement without prior information about the genome [34]; RAPD assays require very little source material and under certain circumstance and the analysis can also be performed non-destructively which can be useful for the screening of rare or valuable samples; RAPD technique is the high level of the overall sensitivity and relatively cheap and does not require the use of specialized and expensive equipment; RAPD method has the potential to detect a wide range of DNA damage [35]. However, there are no studies of oil contamination which use RAPD technology. In the present study, the principal objectives were to assess the impact of diesel oil contamination on the Zhe oyster in terms of DNA damage.
2. Materials and Methods
2.1 Animals
The oysters used in this study come from
Xiangshan county (29°21′16.50″ S, 121°58′46.72″ W),
Zhejiang province, in the People’s Republic of China. The shell length was 4.03 cm ± 0.11 cm, and the shell width was 2.65 cm ± 0.19 cm. The shell weight was 10.24 g ± 0.54 g, and the oysters have been domesticated two weeks before testing.
2.2 Kinds of Fuel Oils and Preparation of Oil
In the present study, the fuel oil used was No. -20
diesel oil. The oil was supplied by the Institute of
Waterborne Transportation Science, administered by the Ministry of Transportation of the People’s Republic of China.
The authors prepared mixtures of oil from fuel oil samples in a 2,000 mL beaker using 2,000 mg of diesel oil per Liter of clean seawater. The beaker was stirred continuously at a uniform speed for 30 min and then emulsified with an ultrasonic cleaner (DL-720A, made in Shanghai, China) for 8 h. In this way, the authors simulated the effects of oil spilled in the sea. TPH (Total petroleum hydrocarbon) analysis was performed using UV spectrophotometry [36]. The various concentrations were then diluted.
2.3 Experimental Design
The oysters were exposed to four concentrations of mixtures of diesel oil (0, 10.0, 20.0 and 40.0 mg/L) for 32 days. The oysters were fed with chlorella 200 mL a
day, algae concentration was 3.5 × 10⁶ cell/mL. There
were 100 oysters in the 100 L tank per experimental group, 50 L mixtures of oil in each tank, and the temperature of the test was 24 °C ± 2 °C. Test water changed daily, and 10 oysters were taken from each group at 2, 8, 16 and 32 days. The samples were preserved with 95% ethanol and changed after three days. Each treatment was replicated three times.
2.4 DNA Extraction and RAPD Analysis
Genomic DNA was isolated from adductor muscle tissue (approximately 100 mg) using the standard phenol-chloroform method [37]. Subsequently, DNA
was resuspended in a 50 μL TE buffer (2 mL 1 M Tris,
40 mL 0.5 M EDTA, 158 mL ddH2O, pH 8.0) and
stored at -20 °C until use.
The RAPD assays were performed on the GeneAmp PCR System 9700 (Applied biosystems,
Invitrogen, USA) in 25 μL of total volume
containing approximately 2 μL of genomic DNA (10
ng/L), 1 μL primers (10 μmol/L), 1 μL dNTP (2.5
mmol/L each), 0.2 μL Taq DNA polymerase (5
Impact Assessment of Diesel Oil on the Zhe Oyster (Crassostrea plicatula) Using RAPD Analysis 99
pH 8.3, 15 mmol/L MgCl2, 500 mmol/L KCl, 0.1
mmol/L EDTA, 5 mmol/L DTT, 50% glycerol, 0.1%
Triton X-100), 18.3 μL distilled water. The 30
primers used were 10 bp in length (S1-S30, Sangon Biotech, China). The RAPD protocol consisted of an initial denaturing step of 7 min at 94 °C, followed by 45 cycles at 94 °C for 1 min (denaturation), 37 °C for 1 min (annealing) and 72 °C for 2 min (extension), with an additional extension period of 10 min at 72 °C. For each amplification, a negative control was run for each primer. Reaction mixtures were stored at
4 °C prior to use. 3 μL of each PCR product was
electrophoresed in 1.5% agarose gels containing ethidium bromide for verifying the amplified fragment length with a DNA marker DL2000 (Takara, China). Images were captured using a high-resolution scan and digitalized images were counted directly for RAPD analysis.
2.5 Estimation of GTS (Genomic Template Stability)
Genomic template stability (%) was calculated as
100 (100a/n), where a represented RAPD
polymorphic profiles detected in each sample treated
and n represented the number of total bands in the
control. Polymorphism observed in RAPD profiles included disappearance of a normal band and appearance of a new band in comparison to control RAPD profiles [38]. To compare the sensitivity of this
parameter, changes in this value were calculated as a percentage of their control (100%). In addition, as the sampling time interval of 2 days is too short, there is no calculation of the GTS and compared with others.
3. Results
3.1 TPH Concentrations
Three different oil concentrations were set in this test, 10 mg/L, 20 mg/L and 40 mg/L (the actual concentration of oil), and with the corresponding TPH
were 1.05 × 10⁻² mg/L, 2.10 × 10⁻² mg/L and 4.20 ×
10-2 mg/L, respectively.
3.2 Effect of Diesel Oil Stress on RAPD Profile
Aimed at verifying the genetic effect of diesel oil contamination, the RAPD analysis was performed on DNA extracted from groups of 10 oysters from each replicate treated with diesel oil at concentrations of 0-40 mg/L. In total, 30 random 10-mer primers (Table 1) were used to amplify genomic DNA samples from the diesel oil-treated and control groups, and only 18 primers generated specific and stable results with a total number of 57 bands.
The RAPD fingerprints showed virtual differences between exposed oysters and control oysters. The changes included both loss and addition of bands compared with the control groups (Fig. 1). For example,
Table 1 Sequences of 30 primers used in this experiment.
No. of primers Sequences (5’→3’) No. of primers Sequences (5’→3’)
S1 GTTTCGCTCC S16 TTTGCCCGGA
S2 TGATCCCTGG S17 AGGGAACGAG
S3 CATCCCCCTG S18 CCACAGCAGT
S4 GGACTGGAGT S19 ACCCCCGAAG
S5 TGCGCCCTTC S20 GGACCCTTAC
S6 TGCTCTGCCC S21 CAGGCCCTTC
S7 GGTGACGCAG S22 TGCCGAGCTG
S8 GTCCACACGG S23 AGTCAGCCAC
S9 TGGGGGACTC S24 AATCGGGCTG
S10 CTGCTGGGAC S25 AGGGGTCTTG
S11 GTAGACCCGT S26 GGTCCCTGAC
S12 CCTTGACGCA S27 GAAACGGGTG
S13 TTCCCCCGCT S28 GTGACGTAGG S14 TCCGCTCTGG S29 GGGTAACGCC
Fig. 1 RAPD profiles of genomic DNA from adductor muscle of the Zhe oyster exposed to varying concentrations of diesel oil. The RAPD patterns were obtained using 10-mer primers (a) S8, (b) S11, (c) S21, (d) S26, (e) S27, (f) S28, (g) S29, and (h) S30. In (a), (b), (c), (d), (e), (f), (g) and (h), numbers 1-12: control, 20 mg/L diesel oil exposed for 2 days, 40 mg/L diesel oil exposed for 2 days, 10 mg/L diesel oil exposed for 8 days, 20 mg/L diesel oil exposed for 8 days, 40 mg/L diesel oil exposed for 8 days, 10 mg/L diesel oil exposed for 16 days, 20 mg/L diesel oil exposed for 16 days, 40 mg/L diesel oil exposed for 16 days, 10 mg/L diesel oil exposed for 32 days, 20 mg/L diesel oil exposed for 32 days, 40 mg/L diesel oil exposed for 32 days, respectively. M: molecular marker (2,000, 1,000, 750, 500, 250 and 100 bp from top to bottom).
the primer S8 showed the number of disappearing RAPD bands was greater at several concentrations of 10-40 mg/L for different days of exposure (Fig. 1a 8-1, 8-2). The primer S11 showed the number of
disappearing RAPD bands to be greater at several concentrations of 10-40 mg/L for different exposed days (Fig. 1b 11-2, 11-3) as well. On the other hand, some figures showed changes in the addition of bands
(a) (b)
(c) (d)
(e) (f)
Impact Assessment of Diesel Oil on the Zhe Oyster (Crassostrea plicatula) Using RAPD Analysis 101
compared with the control groups, for instance, the primer S11 showed the number of adding RAPD bands was greater at several concentrations of 40 mg/L exposed for 2 days (Fig. 1a 11-1). Other figures showed the same phenomena, as shown in Fig. 1e, Fig. 1g 29-4 and Fig. 1h 30-2.
3.3 The Correlation between GTS and the
Concentration of Diesel Oil
In Table 2, the modifications in RAPD profiles are shown as a percentage of their control [37]. Changes in the RAPD patterns were expressed as decreases in GTS, a qualitative measure reflecting the obvious change to the number of RAPD profiles generated by the diesel oil-contaminated oysters. GTS values calculated for 18 primers are presented. The GTS value was decreased with the increased time of exposure. For instance, the GTS of 10 mg/L was 82.46%, 80.70% and 63.15% in the 8, 16 and 32 days, respectively. There was significant linear relationship between GTS and the concentration of diesel oil. The
regression equations were y = 98.6x 0.228 (R² =
0.9734, y was GTS, and the x was concentration), y =
98.664x 0.266 (R² = 0.9769) and y = 94.299x
0.434 (R² = 0.9023) at 8, 16 and 32 days, respectively.
In addition, although the GTS of 20 mg/L and 40 mg/L were 56.14%, the changes of RAPD profiles
were different, with the appearance of 12 new bands in the 20 mg/L group, and the disappearance of 22 normal bands in the 40 mg/L group (Table 3). This effect will be used to evaluate damage to oysters in cases of oil spillage.
4. Discussion
4.1 Application of RAPD Technique in Ecotoxicology
In the field of ecotoxicology, RAPD studies describe the RAPD changes such as differences in band intensity as well as gain/loss of RAPD bands [35]. The RAPD assay has been used to determine the mutagenic effects of heavy metal pollution on the
model plant (Arabidopsis thaliana), DNA from plants
exposed to heavy metals solution displayed polymorphic bands which were not detectable in DNA of unexposed plants [29]. RAPD assay can be used to qualitatively detect the kinetics of B(a)P-induced
DNA effects in the water flea (Daphnia magna)
exposed to 25 µg/L and 50 µg/L the main changes occurring in RAPD profiles produced by the
population of Daphnia magna was a decrease and
increase in band intensity compared with the control population [30, 31]. DNA changes in barley
(Hordeum vulgare) seedlings induced by cadmium
pollution using RAPD analysis and the results showed
Table 2 Changes of genomic template stability for all primers by diesel oil-contaminated oysters for different times (%).
No. -20 diesel oil concentration (mg/L) 8 d 16 d 32 d
0 100 100 100
10 82.46 80.70 63.15
20 75.44 71.93 56.14
40 73.68 70.18 56.14
Table 3 Changes of total bands in control, polymorphic bands and varied bands in diesel oil-contaminated oysters.
Exposure time (d)
No. -20 diesel oil concentration (mg/L)
0 10 20 40
a + b a b a b a b
8 57 5 5 6 8 8 7
16 57 5 6 10 6 9 8
32 57 11 10 12 13 3 22
that the changes occurring in RAPD profiles of root tips following Cd treatment included variation in band intensity, loss of normal bands and appearance of new bands compared with the normal seedlings and the genomic template stability (a qualitative measure reflecting changes in RAPD profiles) was significantly affected at the above Cd concentration
[32, 33]. The similar effects was found in rice (Oryza
sativa) contaminated by Cd [34]. Therefore, the
comparison between “unexposed” and “exposed” genomes show that RAPD analysis can be used to evaluate how the environmental pollutants modify the structure of DNA in living organisms.
4.2 RAPD Technique in Diesel Oil Pollution
The RAPD assay presents many advantages and the RAPD assay is very reliable after optimization [31]. Therefore, the RAPD method has the potential to detect DNA damage (e.g. DNA adducts DNA breakage) as well as mutations (point mutations and large rearrangements) [35]. In the present study, the DNA damage in oysters stressed by the diesel oil was very clear, for example, we selected changes in the primers, as indicated by arrows, in comparison to a control group, which showed changes including loss and addition of bands compared with the control groups (Fig. 1). DNA damage leads to the instability of the genomic template. In this way, previous studies demonstrated that the GTS parameter picked up significant effects of B(a)P and Cd exposure [32-34, 38]. The RAPD assay was considered as a semi-quantitative assay [39] and another people use it as a qualitative rather than a quantitative method [31]. One problem is that the number of primers and characteristics of bands of RAPD for statistical significance in GTS. At present, there are 2-14 primers used in RAPD tests, obtaining a total number of bands ranging from 51-180 [30-34, 38]. In the present study, we selected 18 primers in RAPD tests and got 57 bands (Table 3). Therefore, the number of primers is not the most important factor, the total
number of RAPD bands and polymorphic bands are the key factors in the present study. There is a clear tendency of the concentration of pollutants to be proportional to the number of RAPD polymorphic bands. For instance, different polymorphic bands were detected at each concentration of Cd for different primers, and the value of polymorphisms was p (%) = 34.5%, 40.9% and 44.5% for 30, 60 and 120 mg/L Cd, respectively [32]. In the present study, the authors found that not only exposure concentrations but also exposure times of pollutants were proportional to the number and polymorphisms of bands (Table 3). The number of RAPD polymorphic bands is exactly the number of loss and addition of bands compared with the control groups, and is the basis of the GTS calculation.
5. Conclusion
RAPD (Random amplified polymorphic DNA) is a useful assay procedure for the detection of genotoxin-induced DNA damage and mutations. This study showed that the DNA band changes in RAPD profiles of oysters following diesel oil treatment included loss of normal DNA bands, the appearance of new DNA bands and variations in DNA intensity compared to oysters not exposed to diesel oil. This study also showed that the change of GTS showed a dose-dependent and time-dependent tendency to the diesel oil. Therefore, a RAPD assay was quantitative and could be used as an investigation tool for environmental toxicology, as well as a useful biomarker.
Acknowledgments
Impact Assessment of Diesel Oil on the Zhe Oyster (Crassostrea plicatula) Using RAPD Analysis 103
References
[1] Q. Li, W.G. Liu, K. Shirasu, W.M. Chen, S.X. Jiang, Reproductive cycle and biochemical composition of the Zhe oyster Crassostrea plicatula Gmelin in an eastern coastal bay of China, Aquaculture 261 (2006) 752-759. [2] M.S. Jeng, W.L. Jeng, T.C. Hung, C.Y. Yuh, R.J. Tseng,
P.J. Meng, et al., Mussel watch: A review of Cu and other metals in various marine organisms in Taiwan, 1991-98, Environmental Pollution 110 (2000) 207-2l5.
[3] A.S. Wernersson, Aquatic ecotoxicity due to oil pollution in the Ecuadorian Amazon, Aquatic Ecosystem Health and Management Society 7 (2004) 127-136.
[4] S.F. Hedtke, F.A. Puglisi, Short-term toxicity of five oils to four freshwater species, Archives of Environment Contamination and Toxicology 11 (1982) 425-430. [5] M.G. Carls, S.D. Rice, J.E. Hose, Sensitivity of fish
embryos to weathered crude oil: Part I. Low-level exposure during incubation causes malformations, genetic damage, and mortality in larval Pacific herring (Clupea pallasi), Environmental Toxicology and Chemistry 18 (1999) 481-493.
[6] C.A. Pollino, D.A. Holdway, Toxicity testing of crude oil and related compounds using early life stages of the crimson-spotted rainbowfish (Melanotaenia fluviatilis), Ecotoxicology and Environment Safety 52 (2002) 180-189.
[7] S. Bhattacharyya, P.L. Klerks, J.A. Nyman, Toxicity to freshwater organisms from oils and oil spill chemical treatments in laboratory microcosms, Environmental Pollution 122 (2003) 205-215.
[8] R.A. Khan, J.F. Payne, Influence of a crude oil dispersant, Corexit 9527, and dispersed oil on Capelin (Mallotus villosus), Atlantic Cod (Gadus morhua), Longhorn Sculpin (Myoxocephalus octodecemspinosus), and Cunner (Tautogolabrus adspersus), Bulletin of Environment Contamination and Toxicology 75 (2005) 50-56.
[9] M.Z. Vosylienė, N. Kazlauskienė, K. Jokšas, Toxic effects of crude oil combined with oil cleaner simper green on yolk-sac larvae and adult Rainbow Trout Oncorbyncbus mykiss, Envionmental Science Pollution Research International 3 (2005) 136-139.
[10] S. Shafir, J. Van-Rijn, B. Rinkevich, Short and long term toxicity of crude oil and oil dispersants to two representative coral species, Environmental Science and Technology 15 (2007) 5571-5574.
[11] N. Kazlauskiene, M.Z. Vosyliene, E. Ratkeuyte, The comparative study of the overall effect of crude oil an fish in early stages of development, in: P. Hlavinek (Eds.), Dangerous Pollutants (Xenobiotics) in Urban Water Cycle, Springer, Heidelburg, 2008, pp. 307-316.
[12] M. González-Doncel, L. González, C. Fernández-Torija, J.M. Navas, J.V. Tarazona, Toxic effects of an oil spill on fish early life stages may not be exclusively associated to PAHs: Studies with Prestige oil and medaka (Oryzias latipes), Aquatic Toxicology 87 (2008) 280-288.
[13] J.D. Simonato, C.L.B. Guedes, C.B.R. Martinez, Biochemical, physiological, and histological changes in the neotropical fish Prochiladus lineatus exposed to diesel oil, Ecotoxicology and Environment Safety 69 (2008) 112-120.
[14] M. Pacheco, M.A. Santos, Biotransformation, endocrine, and genetic responses of Anguilla anguilla L. to petroleum distillate products and environmentally contaminated waters, Ecotoxicology and Environment Safety 49 (2001) 64-75.
[15] F.I. Achuba, S.A. Osakwe, Petroleum-induced free radical toxicity in African catfish (Clarias gariepinus), Fish Physiology and Biochemistry 29 (2003) 97-103. [16] J.F. Zhang, X.R. Wang, H.Y. Guo, J.C. Wu, Y.Q. Xue,
Effects of water-soluble fraction of diesel oil on the antioxidant defenses of the goldfish, Carassius auratus, Ecotoxicology and Environment Safety 58 (2004) 110-116.
[17] C. Martínez-Gómez, J.A. Campillo, J. Benedicto, B. Fernández, J. Valdés, I. García, et al., Monitoring Ⅲ biomarkers in fish (Lepidorhombus boscii and Callionymus lyra) from the northern Iberian shelf after the Prestige oil spill, Marine Pollution Bulletin 53 (2006) 305-314.
[18] C. Morales-Caselles, N. Jiménez-Tenorio, M.L. González de Canales, C. Sarasquete, T. Ángel DelValls, Ecotoxicity of sediments contaminated by the oil spill associated with the tanker “Prestige” using juveniles of the fish Sparus aurata, Archives of Environment Contamination and Toxicology 51 (2006) 652-660. [19] I. Marigómez, M. Soto, I. Cancio, A. Orbea, L.
Garmendia, M.P. Cajaraville, Cell and tissue biomarkers in mussel, and histopathology in hake and anchovy from bay of Biscay after the Prestige oil spill (Monitoring Campaign 2003), Marine Pollution Bulletin 53 (2006) 287-304.
[20] J.B. Damásio, C. Barata, A. Munné, A. Ginebreda, H. Guasch, S. Sabater, et al., Comparing the response of biochemical indicators (biomarkers) and biological indices to diagnose the ecological impact of an oil spillage in a Mediterranean river (NE Catalunya, Spain), Chemosphere 66 (2007) 1206-1216.
[21] C. Alonso-Alvarez, C. Pérez, A. Velando, Effects of acute exposure to heavy oil from the Prestige spill on a seabird, Aquatic Toxicology 84 (2007) 103-110.
and DNA adducts as environmental risk parameters for chronic oil exposure: a laboratory experiment with Atlantic cod, Aquatic Toxicology 51 (2000) 241-258. [23] C.M. Couillard, A microscale test to measure petroleum
oil toxicity to mummichog embryos, Environmental Toxicology 17 (2002) 195-202.
[24] R.F. Lee, J.W. Anderson, Significance of cytochrome P450 system reponses and levels of bile fluorescent aromatic compounds in marine wildlife following oil spills, Marine Pollution Bulletin 50 (2005) 705-723. [25] C. Bolognesi, E. Perrone, P. Roggieri, A. Sciutto,
Bioindicators in monitoring long term genotoxic impact of oil spill: Haven case study, Marine Environment Research 62 (2006) 287-291.
[26] B. Pérez-Cadahía, B. Laffon, V. Valdiglesias, E. Pásaro, J. Méndez, Cytogenetic effects induced by Prestige oil on human populations: The role of polymorphisms in genes involved in metabolism and DNA repair, Mutation Research 653 (2008) 117-123.
[27] P. Jaime, H. Quesada, E. Rolán-Alvarez, A. Caballero, Genetic impact of the Prestige oil spill in wild populations of a poor dispersal marine snail from intertidal rocky shores, Marine Pollution Bulletin 56 (2008) 270-281.
[28] C.W. Theodorakis, L.R. Shugart, Genetic ecotoxicology Ⅱ: population genetic structure in mosquitofish exposed in situ to radionuclides, Ecotoxicology 6 (1997) 335-354. [29] C. Conte, I. Mutti, P. Puglisi, A. Ferrarini, G. Regina, E.
Maestri, et al., DNA fingerprinting analysis by a PCR based method for monitoring the genotoxic effects of heavy metals pollution, Chemosphere 37 (1998) 2739-2749.
[30] F.A. Atienzar, A.J. Evenden, A.N. Jha, M.H. Depledge, Use of the random amplified polymorphic DNA (RAPD) assay for the detection of DNA damage and mutations: Possible implications of confounding factors, Biomarkers 7 (2002) 94-101.
[31] F.A. Atienzar, A.N. Jha, The random amplified polymorphic DNA (RAPD) assay to determine DNA
alterations, repair and transgenerational effects in B(a)P exposed Daphnia magna, Mutation Research 552 (2004) 125-140.
[32] W. Liu, P.J. Li, X.M. Qi, Q.X. Zhou, L. Zheng, T.H. Sun, et al., DNA changes in barley (Hordeum vulgare) seedlings induced by cadmium pollution using RAPD analysis, Chemosphere 61 (2005) 158-167.
[33] W. Liu, L. Zheng, P.J. Li, X.M. Qi, Q.X. Zhou, T.H. Sun, Effects of cadmium stress on DNA polymorphism of genome in barley seedlings, Journal of Agro-Environment Science 25 (1) (2006) 19-24. (in Chinese)
[34] W. Liu, Y.S. Yang, Q.X. Zhou, L.J. Xie, P.J. Li, T.H. Sun, Impact assessment of cadmium contamination on rice (Oryza sativa L.) seedlings at molecular and population levels using multiple biomarkers, Chemosphere 67 (2007) 1155-1163.
[35] F.A. Atienzar, A.N. Jha, The random amplified pokymorphic DNA (RAPD) assay and related techniques applied to genotoxicity and carcinogenesis studies: A critical review, Mutation Research 613 (2006) 76-102. [36] L.S. Shang, Q. Sun, H.Z. Xu, Study on the determination
of petroleum hydrocarbon in mussels by UV-spectrophotometry, Marine Environmental Science 16 (1) (1998) 62-65. (in Chinese)
[37] J. Sambrook, E.F. Fritsch, T. Maniatis, Molecular Cloning: A Laboratory Manual, 3rd ed., Cold Spring Harbor Laboratory Press, NY, 2001.
[38] F.A. Atienzar, M. Conradi, A.J. Evenden, A.N. Jha, M.H. Depledge, Qualitative assessment of genotoxicity using random amplified polymorphic DNA: Comparison of genomic template stability with key fitness parameters in Daphmia magna exposed to benzo[a]pyrene, Environmental Toxicology and Chemistry 18 (1999) 2275-2282.
Feb. 2013, Vol. 7, No. 2, pp. 105-109
Journal of Life Sciences, ISSN 1934-7391, USA
Automatic segmentation of Colon Cancer Cells Based
on Active Contour Method: A New Approach
Jamal Charara, Alaa Hilal, Ali Al Houseini, Walid Hassan and Mohamad Nassreddine.
Department of Physics and Electronics, Faculty of Sciences I, Lebanese University, Beirut, Lebanon
Received: September 28, 2012 / Accepted: December 7, 2012 / Published:February 28, 2013.
Abstract: Automatic interpretation of the images of colon cell biopsies requires automatic segmentation of these cells in the image obtained. The active contour method for image segmentation is a well known method for automatic detection of the cell contour. However, the application of this method on colon cell images was not effective. In this paper, the authors have proposed a new technique to reduce the analysis time needed to detect cells in a given image. This technique is based on the active contour method but now using a progressive division of the dimensions of the image to achieve convergence. The model proposed succeeded in detecting cells whose boundaries are not necessarily defined by a gradient. The initial curve can be anywhere in the image, and interior contours can be automatically detected. The developed algorithm was successfully applied on textured multispectral images of three types of cells, including benign hyperplasia (BH), intraepithelial neoplasia (IN), and carcinoma (Ca) cells.
Key words: Active contours, multispectral image, texture, segmentation.
1. Introduction
Medical images obtained microscopically are
important tools in medical diagnosis. Since colon cancer, like any other cancer, is characterized by
abnormal cellular proliferation, seeking abnormalities inside microscopic images from biopsies, such as elliptical non-regular cancer cells or non-natural
contrast, is of paramount interest. However, diagnosis based on observation of medical images would be
largely accelerated if the manual search of abnormalities can be replaced by an automatic procedure. The majority of methods used to classify
cancerous cells use morphological image processing, particularly the shapes of the cells inside images. The
effectiveness of an automatic search method is generally assessed by its capacity to analyze and interpret a large number of images in a short time. The
main drawback of these approaches is the long analysis time [1].
The active contour (snake) method is a very
effective technique for rapid segmentation of cancer
cells in the image. It is based on color intensity and can be applied on sequences of objects in the image.
Nevertheless, segmentation of colon cancer cells
possessing irregular shapes within a multispectral
image was not efficient with the active contour
[2-4].
The objective of the present paper was to develop
a new approach aiming to reduce the time necessary
to detect cells in a given image. This approach was
derived from the active contour method but now using a progressive division of the dimensions of the
image to achieve convergence. Three types of cells
were utilized to assess the efficiency of our
segmentation model, including benign hyperplasia
(BH), intraepithelial neoplasia (IN) that is a
precursor state for cancer, and carcinoma (Ca) that
corresponds to abnormal tissue proliferation (cancer).
2. Materials and Methods
2.1 Active Contour Model
Automatic Segmentation of Colon Cancer Cells Based on Active Contour Method: A New Approach
109
(a) (b) (c)
Fig. 8 Time consumption and segmentation results for the three types of colon cells: (a) BH: 164.74 s; (b) IN: 136.98 s and (c) Ca: 139.87 s.
minutes per image. Second, the segmentation of colon cancer cells has become fully automated. Therefore, the proposed model allows accurate and efficient segmentation of images containing distinct objects in a very short time. The approach is very simple and exhibits attractive results. This method is useful in the
automatic segmentation between different histopathological images and thus allowing a faster segmentation of microscopic bio-images.
Acknowledgments
This work was supported by grants from the Doctoral School of Sciences & Technology at the Lebanese University.
References
[1] C.A.B. Castano, J.S. Fraga, S. Fernandez, A. Gruber, L.
Costa, Biological shape characterization for automatic image recognition and diagnosis of protozoan parasites of the genus Eimeria, Pattern Recognition 40 (2007) 1899-1910.
[2] T.E. Schneider, Automated classification of analysis and reference cells for cancer diagnostics in microscopic images of epithelial cells from the oral mucosa, Acta Polytechnica 47 (2007) 86-90.
[3] G.D. Giannoglou, Y.S. Chatzizisis, V. Koutkias, I. Kompatsiaris, M. Papadogiorgaki, V. Mezaris, et al., A novel active contour model for fully automated segmentation of intravascular ultrasound images: In vivo validation in human coronary arteries, Computers in Biology and Medicine 37 (2007) 1292-1302.
[4] R. Verdu, J. Morales, R. Gonzalez, L. Weruaga, Convergence analysis of active contours, Image and Vision Computing 26 (2008) 1118-1128.
[5] R.M. Haralick, K. Shanmugam, I. Dinstein, Textural features for image classification, IEEE Transactionson Systems, Man and Cybernetics 3 (1973) 610-621. [6] T. Chan, L. Vese, Active contours without edges, IEEE
Transactions on Image Processing 10 (2001) 266-277. [7] D. Mayumi, U. Sabino, L.F. Costa, E.G. Rizatti, M.A.
Zago, A texture approach to leukocyte recognition, Real-Time Imaging 10 (2008) 205-216.
[8] M.A. Roula, A. Bouridane, P. Miller, Aquadratic classifier based on multi-spectraltexture features for prostate cancer diagnosis, in: Proceedings of the 7th International Symposium on Signal Processing and its Applications, 2003, pp. 37-40.
Journal of Life Sciences, ISSN 1934-7391, USA
Development of Biotechnology for Microbial Synthesis
of Gold and Silver Nanoparticles
Tamaz Levan Kalabegishvili1, 2, Ivane Giorgi Murusidze2, Elena Ivan Kirkesali1, Alexander Nikoloz
Rcheulishvili1, Eteri Nikoloz Ginturi1, Eteri Simon Gelagutashvili1, Nana Eremey Kuchava1, Nanuli Vakhtang
Bagdavadze1, Dodo Trofim Pataraya3, Manana Amiran Gurielidze3, Hoi-Ying Holman4, Marina Vladimirovna
Frontasyeva5, Inga Ivanovna Zinicovscaia5, Sergey Sergeevich Pavlov5 and Vasiliy Timofeevich Gritsyna6
1. Department of Biological System Physics, E. Andronikashvili Institute of Physics, Javakhishvili State University, Tbilisi 0177,
Georgia
2. Ilia State University, Institute of Applied Physics, Tbilisi 0162, Georgia
3. S. Durmishidze Institute of Biochemistry and Biotechnology of N.L.E. Georgian Agrarian University, Tbilisi 0159, Georgia
4. Department of Ecology, Center for Environmental Biotechnology, Lawrence Berkeley National Laboratory, Berkeley 94720,
United States
5. Department of Nuclear Physics, Joint Institute for Nuclear Research, Dubna 141980, Russia
6. Departement of Solid State Physics, V.N. Karazin Kharkiv National University, Kharkiv 01077, Ukraine
Received: September 28, 2012 / Accepted: December 07, 2012 / Published: February 28, 2013.
Abstract: Several bacterial strains of Actinomycetes belonging to Streptomyces and Arthrobacter genera for the first timewere used to study the biotechnology of synthesis of gold and silver nanoparticles. The experimental conditions of gold and silver nanoparticles production by the cells of studied strains in aqueous chloroauric acid (HAuCl4) and in silver nitrate (AgNO3) solutions, respectively,
were determined. Concentration and time-dependences of nanoparticle formation were investigated. The complex of optical and analytical methods was used for testing the gold and silver nanoparticles in the bacterial biomass. The TEM (Transmission Electron Microscopy) and XRD (X-ray Diffraction) data in all cases demonstrated the presence of crystals with fcc (face centered cubic) structure. The results obtained show that the Actinomycetes are capable of producing gold and silver nanoparticles of spherical shape extracellularly when exposed to suitable compounds. The particle size distribution shows that the sizes of nanoparticles are in the range of 5 nm to 80 nm. The biomass obtained may be used for industrial as well as medical and pharmaceutical purposes.
Key words: Microbial synthesis, nanoparticles, gold, silver, biotechnology.
1. Introduction
In recent years, the microbial technologies of metal nanoparticles production have received great attention in materials science and industry [1-3]. A large number of microorganisms are characterized by their affinity with metal ions and their tolerance to high metal concentrations. Microorganisms often exhibit
Corresponding author: Marina Vladimirovna Frontasyeva, Ph.D., research field: application of NAA for life sciences and material science. E-mail: [email protected].
defense mechanisms that contribute to their survival in aggressive environments containing harmful metallic compounds. The same mechanism must be responsible for their ability to produce metallic nanoparticles when exposed to such environments [4].
Development of Biotechnology for Microbial Synthesis of Gold and Silver Nanoparticles 111
with metal ions in the aqueous solutions which result in extracellular inorganic precipitation [6, 7]. Anionic bacterial surfaces interact with metal cations, which produce a negative charge density throughout the wall and then intracellular binding of metals [8].
Various microorganisms (bacteria, yeast, fungi) are known for their effectiveness and flexibility in producing gold [9-14] and silver [8, 9, 15, 16] nanoparticles. Gold and silver nanoparticles have potential applications in electronics, information technology, catalysis, medicine, pharmacology, chemical sensing, biosensing and photonics. In medicine they have shown therapeutic potential in oncology, cardiology, immunology, neurology and endocrinology [4, 17, 18].
Gold nanoparticles possess stability, oxidation resistance and biocompatibility. Due to their optical and chemical properties and high infrared phototherapy potential, they may be used for early diagnosis and treatment of cancer. The use of precisely engineered gold nanoparticles as anticancer agents allows direct treatment of diseased cells with reduced damage to healthy cells [19, 20].
Silver nanoparticles are characterized by excellent biocompatibility and low toxicity for man, but at the same time silver at low concentrations is well known to exhibit toxicity to a wide range of bacteria, virus and other (about 650) eukaryotic microorganisms [21, 22]. Silver is also an effective antimicrobial agent. High synergistic activity of silver nanoparticles and antibiotics has been observed.
Thus both gold and silver nanoparticles have a large field of application for many purposes. However, current conventional nanotechnology causes environmental pollution due to the toxicity of the reagents used [1]. Therefore, there is a great need to develop new alternative, easy and eco-friendly methods of producing gold and silver nanoparticles using bacteria and to search for new effective microbial strains.
The actinomycetes are a widespread group of
Gram-positive bacteria. Among microorganisms, actinomycetes (actinobacteria) appear to be a very specific taxonomic group responsible for the biosynthesis of a number of biologically active compounds (enzymes, amino acids, vitamins, antibiotics, etc.). Actinobacteria are distinguished from other bacteria by their morphology and by their G + C rich genome. Though some actinobacteria display pleomorphic or even coccoid elements, characteristically they form filamentous mycelium and may produce spores that are easily detached and may become airborne when disturbed [23].
The ability of biosorption and bioremediation shown by actinomycetes could be useful in heavy metal removal by the valence change of metal ions. They are classified as prockaryotes and may be easily manipulated genetically to control sizes and polydispersity of the resulting nanoparticles [7, 8].
Actinomycetes-mediated chemistry has many advantages for the synthesis of gold and silver nanoparticles [11, 12, 24, 25]. Terrestrial
actinobacteria, especially Streptomyces genera are rich
sources of biologically active products and are being extensively used for industrial production of pharmaceuticals. Numerous actinomycetes have been isolated from different environments—soils, compost, marine sediments, rocks, water etc. Antimicrobial and antifungal activity of actinomycetes is well established
two-third of microbial-produced antibiotics belongs
to actinomycetes. They are effective in the treatment of many antibiotic-resistant pathogens. Antibiotics produced by actinobacteria are widely used in human and veterinary medicine, and in agriculture. This group of microorganisms also contributes to soil fertility regeneration and polluted soil cleanup by degrading the carbon skeleton of toxic organic compounds.
studies of several new strains of actinomycetes for developing methods of producing gold and silver nanoparticles are presented. Some results of earlier investigations are presented in Refs. [26, 27]. Strains
of microorganisms belonging to Streptomyces and
Arthrobacter genera have been studied as possible “nanofactories” for the development of clean and nontoxic methods of the synthesis of silver and gold nanoparticles. A few different analytical and spectral methods have been used for examining gold and silver nanoparticles. The obtained results are discussed to evaluate the ability of the studied strains to produce gold and silver nanoparticles.
2. Material and Methods
2.1 Materials
Among many geographical regions of the planet, the South Caucasus has particularly attracted the attention of bioprospectors. There are 14 different soil-climatic zones on the southern slopes of the Caucasus with an average annual temperature between 5-25 °C. Georgia is a country covering
69,000 km2, occupying more than 80% of the South
Caucasus. This area is characterized by extreme microbial and plant biodiversity. The study of biodiversity of the microorganisms, their distribution and classification into definite groups and species is performed on the bases of an in-depth study of their biological properties. Special interest is focused on adaptation mechanisms of the microorganisms to extreme environment. Among extremophilic microorganisms atinomycetes-actinobacteria in particular, widely distributed in nature, are species of a great interest [28]. The distribution of extremophilic actinomycetes in various types of soils, rocks and rhizosphere of Georgia has been studied. Among extremophilic actinomycetes isolated from various types of soils of Georgia, there were 49% of halophiles, 27% of alkaliphiles and 24% of thermophiles [29, 30].
The new strain Streptomyces spp. 211A (alcaliphilic
actinomycetes) was isolated from the Cinnamonic calcareous soil of Sagarejo region in Georgia using the method of dilution [30]. Incubation was performed in a thermostat at 26-28 °C for 14 days. Pure colonies were characterized for their morphological and physiological characteristics by various biochemical tests. The growth ability of the culture was studied in different synthetic and organic nutrient media. Pridham’s method was used to study the carbon source uptake ability [31]. Fedorov’s [32] nutrient medium was used to establish the uptake of different sources of nitrogen. The hydrocarbon absorption ability of actinomycetes was determined according to their growth intensity. Antagonistic properties were
studied by the agar block method [33]. The protease
activity was determined by Anson’s method, modified by Petrova [34]. Actinomycete identification was performed according to Krasilnikov and Bergey’s
Manuals [35]. The strain Streptomyces spp. 211A
develops long branched straight hyphae. Aerial
mycelium is white-violet coloured, coloniesdark
violet, nutrient mediumbrownish. The culture is
extremophilic, specifically, alkaliphilic. In experiments the cells were grown aerobically at pH 7- 8, 28-30 °C in 500 mL Erlenmeyer flasks in the liquid
medium Gauze-1 [29]: K2HPO4 (0.05%), MgSO4
(0.05%), NaCl (0.05%), KNO3 (0.1%), FeSO4·7H2O
(0.001%), starch (2%), east extract (0.03%). The culture was grown with continuous shaking on a
shaker (200 g) at 30°C for 10 days.
All chemicals used in the experiment were ACS-reagent grade, produced by Sigma (St. Louis, MO, USA).
The bacterial strain Streptomyces glaucus 71MD
Development of Biotechnology for Microbial Synthesis of Gold and Silver Nanoparticles 113
actinomycete Streptomyces glaucus 71MD is:
K2HPO4 (0.05%), MgSO4 (0.05%), NaCl (0.05%),
KNO3 (0.1%), FeSO4·7H2O (0.001%), glucose (2%),
yeast extract (0.03%), pH 7.5. In this nutrient medium the bacteria were grown in 250 mL Erlenmeyer flasks under aerobic conditions with permanent shaking of
the suspension and at the temperature of 28-30 oC, pH
= 7-8. The biomass was harvested by centrifugation. Two Gram-positive aerobical bacterial strains
belonging to Arthrobacter generaArthrobacter
globiformis 151B and Arthrobacteroxydans 61B were isolated from the basalt rocks collected from the Kazreti region in the Republic of Georgia. In both cases incubation was carried out at 20-30 °C, pH 7-12 for 15-17 days. The pure colonies were tested to examine their morphological and physiological characteristics. The growth ability of the bacteria was studied in different synthetic and organic media. Antagonistic properties towards other Gram-positive bacteria, fungi and yeasts were not observed. The bacteria were grown aerobically in the following nutrient medium: 10 g of glucose, 10 g of peptone, 1 g of yeast extract, 2 g of caseic acid hydrolysate, 5 g of NaCl, and 1 L of distilled water. Bacterial cells were grown in 250 mL Erlenmeyer flasks as a suspension at 21 °C being shaken continuously for 5 days.
After cultivation in all cases mycelia (cells) were separated from the culture broth by centrifugation (12,000 g) for 20 min, and then the biomass was washed three times with sterile distilled water. The harvested mycelial biomass (2-3 g of wet mycelia) was resuspended in 250 mL Erlenmeyer flasks with
100 mL of 10-3 M aqueous chloroauric acid (HAuCl4)
solution for synthesis of gold nanoparticles and
aqueous silver nitrate (AgNO3) solution for synthesis
of silver nanoparticles. The resulted mixtures were put again into the shaker at 28-30 °C (200 g) for different periods of time (1-12 days).
For UV-Vis (Ultraviolet-Visual) spectral analysis and TEM (Transmission Electron Microscopy) of the suspension samples were taken after different time
intervals. For these studies, both the suspension and supernatant obtained after centrifugation were used. For SEM (Scanning Electron Microscopy), X-ray diffraction, equilibrium dialysis, AAS (Atomic Absorption Spectrometry) and NAA (Neutron Activation Analysis) analysis, the bacterial cells were harvested by centrifugation at 12,000 g for 20 min and this wet biomass was placed in an adsorption-condensation lyophilizer and dried [36].
2.2 Methods
2.2.1 UV-Vis Spectrometry
The UV-Vis (Ultraviolet-Visual) spectra of the samples were recorded by a spectrophotometer “Cintra 10” (GBC Scientific Equipment Pty Ltd.,
Australia) with a wavelength range of 190-1,100 nm.
2.2.2 XRD (X-ray Diffraction)
XRD measurements were made with a Dron-2.0 diffractometer. The BCV-23 X-ray tube with the Cu
anode (CuKα: λ = 1.54178 Å) was used as a source of
radiation; the Ni grid with a width of 20 µm was used for filtration of the radiation; the rate of the detector
was 2o/min; the interval of intensity was 1,000
pulses/min and the time constant was 5 s.
2.2.3 TEM (Transmission Electron Microscopy) TEM (Transmission Electron Microscopy) was performed using the JEOL SX-100 equipment (Japan) operating at 100 kV. The TEM studies were done at 50,000× magnification. The samples were prepared by placing a drop of solution with the gold nanoparticles on carbon-coated TEM grids. The films on the TEM grids were allowed to dry at room temperature before analysis.
2.2.4 SEM (Scanning Electron Microscopy)
with the energy-dispersive X-ray spectrometer (EDAX, USA). The acquisition time ranged from 60 s to 100 s, and the accelerating voltage was 20 kV [37].
2.2.5 EDAX (Energy-Dispersive X-ray Analysis) To identify different elements associated with the sample specimen the “built-in” spectrometer called an EDAX spectrometer was used. EDAX is an analytical technique which utilizes X-rays that are emitted from a specimen when bombarded by an electron beam to identify the elemental composition of the specimen. The EDAX X-ray detector measures the number of emitted X-rays versus their energy. Microprobe analysis of gold nanoparticles clusters was conducted with EDAX spectrometer, USA. The acquisition time ranged from 60 s to 100 s, and the accelerating voltage was 20 kV.
2.2.6 AAS (Atomic Absorption Spectrometry) Flame AAS with a “Beckman-495” spectrometer was used for gold and silver determination in the experimental samples. Measurement was carried out at the wavelength of the gold resonance line = 242.8 nm.
2.2.7 NAA (Neutron Activation Analysis)
The gold and silver concentrations as well as the elemental content of samples were determined using NAA at the reactor IBR-2 of the Frank Laboratory of Neutron Physics of the Joint Institute for Nuclear Research (Dubna, Russia). The experimental equipment and irradiation conditions of samples are described elsewhere [38]. The concentrations of elements based on short half-life radionuclides were determined by irradiation for 60 s under a thermal
neutron fluency rate of approximately 1.6 × 10¹³
n·cm-2·s-1. The long half-live isotopes were determined
using a cadmium-screened irradiation channel under a resonance neutron fluency rate of approximately 3.31
× 1012 n·cm-2·s-1. The samples were irradiated for 5
days, repacked and then measured twice after decays of 4 days and 20 days.
The counting time varied from 30 min to 1.5 h. The gold content was determined with the 411.8 keV
γ-line of 198Au. The silver content was determined
using the 657.7 keV γ-line of 110mAg. The NAA data
processing and determination of element concentrations were performed using Genie 2000 software [39].
3. Results and Discussion
At first the UV-Vis spectrometry was used for testing of bacterial samples with gold and silver nanoparticles. The gold SPR (surface plasmon resonance) peak at ~ 530 nm in UV-Vis absorption spectra corresponds to aggregation in the solutions of the gold nanoparticles which are formed by means of the gold ion reduction from Au (III) to Au (0) by biomolecules, proteins and enzymes on the surface of bacteria cells. The spectra in silver cases exhibit the appearance of an absorption peak at 425 nm, which is characteristic of silver nanoparticles and corresponds to silver reduction from Ag (I) to Ag (0) [32].
As is known, absorption bands of nanocluster plasmons strongly depend on the particle sizes, the dielectric constant of the medium and surface-adsorbed species. Using Maxwell’s electromagnetic theory to explain the interaction of light with spherical particles, the size of which is of the order of the light wavelength or smaller, Mie [41] assumes that the shape of plasmon resonance absorption bands depends on the particle nature. According to Mie’s theory, a single SPR band is expected in the adsorption spectra of spherical isotropic nanoparticles, whereas anisotropic particles could give rise to two or more SPR bands depending on the shape of particles [42]. The intensity of the peaks for nanoparticles of definite sizes increased as a function of time of reaction.
In the preliminary investigations optimal concentrations of gold and silver compounds for synthesis of nanoparticles were determined. Dose-dependence of absorbance versus chloroauric
acid and silver nitrate concentrations 10-2-10-4 M in
Development of Biotechnology for Microbial Synthesis of Gold and Silver Nanoparticles 115
cases was near 10-3 M. At a concentration of 10-2 M
the sizes of nanoparticles were higher than 100 nm and the peaks were not observed. In Ref. [43], it is hypothesized that the number of active objects on the surface of bacteria cells that were involved in the synthesis was not sufficient for the reduction of metal ions at higher concentrations. Consequently, the synthesis process depended on the metal concentration as well as on the number of the cells in solution. This differential response indicates the possibility of custom designed nanoparticles by varying cell number and metal concentration in solution.
In addition, in nutrient medium, some organic compounds in the cell cultivation may be used for activation of cell growth and synthesis processes. Using NAA it was demonstrated that in the synthesis
of silver nanoparticles by actinomycete Streptomyces
glaucus 71MD the addition of glucose in the nutrient medium increases the production of nanoparticles by 3 times as compared with the starch. The SEM image in Fig. 1 demonstrated intensive production of silver
nanoparticles in biomass of Streptomyces glaucus
71MD.
UV-Vis spectra of gold nanoparticles for all the bacteria studied have better identified SPR peaks at 530 nm than the peaks of silver nanoparticles at 425 nm. In Fig. 2, (a) the dose-dependence for silver
nanoparticles synthesis by actinomycete Streptomyces
spp. 211A and (b) the TEM image are presented. As can be seen from the image, production of silver
nanoparticles at a silver nitrate concentration of 10-3 M
takes place, but the surface plasmon peak of silver at
425 nm is not well separated which may be caused by the dispersed sizes of the nanoparticles, dielectric properties of the medium and the poor state of surface-adsorbed species because of the antibacterial properties of silver.
The silver nanoparticles were also synthesized
using Arthrobacter globiformis 151B (Fig. 3). For the
measurement of UV-Vis spectra the suspensions in some cases were diluted with distilled water 3-4 times.
(a) (b)
Fig. 1 The SEM images of silver nanoparticles formed in Streptomyces glaucus 71MD cells after 5 days treatment by silver nitrate (a) with glucose and (b) with starch.
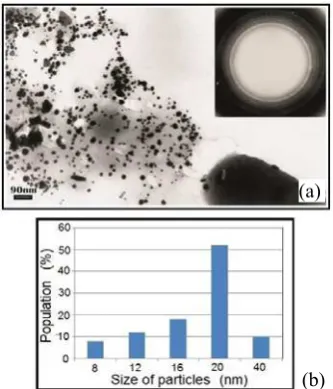
Fig. 2 (a) The dose-dependence for silver nanoparticles synthesis by actinomycete Streptomyces spp. 211A and (b) the TEM image of silver nanoparticles in biomass Streptomyces spp. 211A.
The spectra were observed (a) in the suspension that was diluted 4 times as well as (b) in supernatant obtained after centrifugation of the suspension interacted with silver nitrate for 5 days. The UV-Vis spectra in Fig. 3 show that silver nanoparticles formed in the supernatant have a good monodispersity, but their number is 2.5 times less. So, in some cases, the supernatant may be successfully used for the production of nanoparticles.
In the Streptomycetes genera strains Streptomyces
spp. 211A and Streptomyces glaucus 71MD intensive
production of gold nanoparticles was observed (Fig. 4). For example in Fig. 4 the UV-Vis absorption spectra
of gold nanoparticles in (a) Streptomyces glaucus
71MD suspension treated with HAuCl4 for 40 h and (b)
in the same suspension diluted 4 times are given. In all TEM images the diffraction patterns correspond to the fcc (face centered cubic) structure of gold and silver
nanoparticles. For example, Fig. 5a shows TEM
image and diffractogram of Au nanoparticles
synthesized in biomass of Arthrobacter oxydans 61B
treated by HAuCl4 for 12 days. The particle size
histograms for the samples studied show that the sizes of gold and silver nanoparticles are in the range of 5 nm to 80 nm, with an average of 20-25 nm. Example
of the histogram for Arthrobacter oxydans 61B is
presented in Fig. 5b.
The XRD data for gold nanoparticles synthesized by Arthrobacter oxydans 61B treated with chloroauric acid for 12 days confirm the presence of fcc structure
Fig. 3 The UV-Vis absorption spectra for silver nanoparticles synthesized by Arthrobacter globiformis 151B (a) in the suspension diluted 4 times and (b) in supernatant.
Fig. 4 The UV-Vis absorption spectra for gold nanoparticles (a) in Streptomyces glaucus 71MD suspension treated with HAuCl4 for 40 h and (b) in the same suspension diluted 4 times.
Fig. 5 The TEM image and the size histogram of gold nanoparticles synthesized in Arthrobacter oxydans 61B treated by HAuCl4 for 12 days.
(Fig. 6). The diffraction pattern shows the amorphous structure of gold nanoparticles. However, a number of Bragg reflections corresponding to the fcc structure of gold are also seen here: four characteristic peaks (111), (200), (220) and (311). In cases of silver nanoparticles synthesis the same characteristic peaks corresponding to the fcc structure of elemental silver were observed. The results obtained clearly show that gold and silver nanoparticles, formed by bacterial reduction of ions, are crystalline in nature and they are generally produced extra cellularly.
The Scherrer equation was used for an approximate assessment of the sizes of nanoparticles using the broadening of interference peak of gold (111) on the diffractogram (Fig. 6):
(a) (b)
(a) (b)
(a)
Development of Biotechnology for Microbial Synthesis of Gold and Silver Nanoparticles 117
d = Kλ/β cos θ
where K is the shape factor, for cubic crystals it is
0.9-1; λis x-ray wavelength, for CuKαλ = 1.54178 Å;
βis the line broadening at half the maximum intensity
in radians; θ is the Bragg angle; and d is the size of
nanoparticles in nm. It is important to realize that the Scherrer formula is applicable to grains less than
0.1 μm [44, 45]. For an approximate assessment of
the size of nanoparticles, the (111) interferential
maximum was used. In this case θ = 38o. The
calculations were carried out taking into account only
instrumental broadening of β (≈ 0.3o) without
evaluation of crystal defects on the maximums shape. The results obtained show that the size of gold nanoparticles is about 22 nm, confirming the range of size determined using the TEM image.
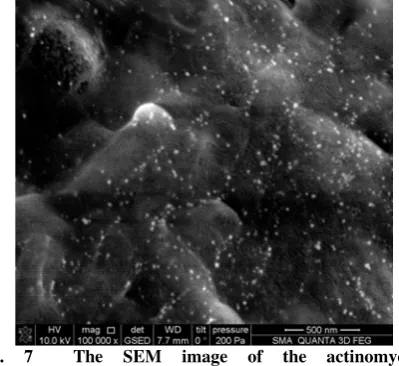
Fig. 7 presents the SEM image of gold nanoparticles
formed by actinomycetes Streptosporangium spp. 94A
cells after interacting with chloroauric acid for 3.5 days. The SEM image of silver nanoparticles in the
biomass of Streptomyces glaucus 71MD was
presented in Fig. 1. Since the studied samples are non-conducting, they were visualized in the natural environment (ESEM) mode. The SEM images illustrate that the extra cellular production of gold and silver nanoparticles in all experiments takes place, most of the particles formed are spherical and do not create big agglomerates.
Fig. 6 The XRD difractogram for gold nanoparticles synthesized by Arthrobacter oxydans 61B treated with chloroauric acid for 12 days.
Fig. 7 The SEM image of the actinomycetes Streptosporangium spp. 94A cells after interacting with chloroauric acid for 3.5 days.
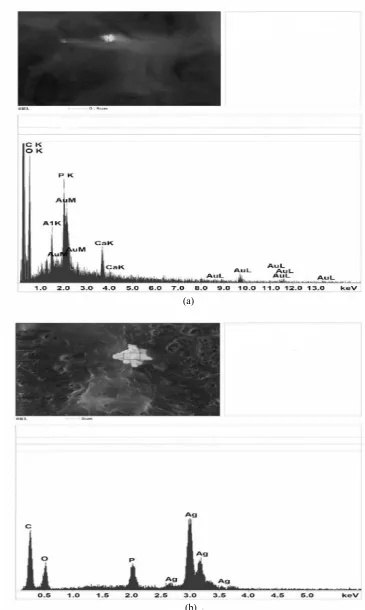
The EDAX spectra proved the presence of (a) gold
nanoparticles in Arthrobacter globiformis 151B cells
treated with HAuCl4 solution for 10 days and (b)
silver nanoparticles in Streptomyces spp. 211A cells
treated with AgNO3 solution for 5 days (Fig. 8). Nine
peaks of Au were observed for the biomass of
Arthrobacter globiformis 151B (Fig. 8a). Signals from C, O, K, P, Al and Ca atoms were also recorded. These signals are likely to be due to X-ray emission from the proteins and enzymes present in the cell wall of the biomass. Four peaks of Ag were observed
for the biomass of Streptomyces spp. 211A (Fig. 8b).
The signals from C, O, and P atoms were also recorded.
Fig. 8 The EDAX spectra of (a) gold nanoparticles in Arthrobacter globiformis 151B and (b) silver nanoparticles in Streptomyces spp. 211A.
(a)
Development of Biotechnology for Microbial Synthesis of Gold and Silver Nanoparticles 119
The capacity of the adsorbent and the equilibrium relationships between adsorbent and adsorbate are described by Freundlich adsorption isotherms:
Cb = KCt1/n
where Cbis the concentration of the metal adsorbed, Ct
is equilibrium concentration of the metal ion in the
solution, K and n are empirical constants, which may
be characterized as the biosorption constant and sorptive capacity, respectively.
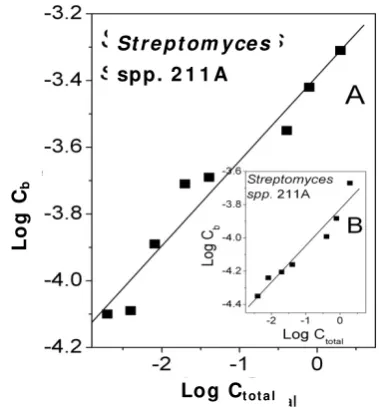
In Fig. 9 biosorption isotherms for chloroauric acid
solution and Streptomyces spp. 211A cells
(A—homogenized cells, and B—particulate homogenized cells (insert)) are presented. Each dot is the average of three independent values, and the standard deviation is < 13%.
By means of Freundlich isotherms the biosorption
constants (K) and the sorptive capacity (n) were
determined:
(1) K = 4.11 × 10⁻⁴, n = 3.84. (goldStreptomyces
spp. 211Ahomogenized cells);
(2) K = 1.47× 10⁻⁴,n = 4.55. (goldStreptomyces
spp. 211Aparticulate homogenized cells).
As can be seen, the biosorption constant of homogenized cells is greater than that of particulate homogenized cells for which, on the contrary, sorptive capacity is greater.
The results obtained show that cell homogenization increases the surface of bacterial cells that increases the probability of nanoparticle formation.
The roles of processes, which take place on cell surfaces also during the microbial synthesis, are revealed by the results of NAA and AAS. Examples of analytical determination (using AAS and NAA) of gold and silver total concentrations in the bacterial
biomass for Streptomyces spp. 211A are given in
Fig. 10.
The data obtained by NAA (Fig. 10a) illustrate that during the first day the metal concentration increases rapidly and then does not change significantly for a few days. In the first “rapid” phase, the metal ions are mainly adsorbed onto the surface of microorganisms
Fig. 9 The linearized Freundlich adsorption isotherms for gold Streptomyces spp. 211A cells (A: homogenized cells; and B: particulate homogenized cells).
Fig. 10 The total gold concentrations in biomass Streptomyces spp. 211A determined by (a) NAA and by (b) AAS.
(a) (b)
St r e pt om yce s
spp. 2 1 1 A
Log Ct ot a l
L
o
g
C