Journal of Life Sciences
Volume 6, Number 6, June 2012 (Serial Number 50)
David Publishing Company www.davidpublishing.com
Publication Information
Journal of Life Sciences is published monthly in hard copy (ISSN 1934-7391) and online (ISSN 1934-7405) by David Publishing Company located at 9460 TELSTAR AVE SUITE 5, EL MONTE, CA 91731, USA.
Aims and Scope
Journal of Life Sciences, a monthly professional academic journal, covers all sorts of researches on molecular biology, microbiology, botany, zoology, genetics, bioengineering, ecology, cytology, biochemistry, and biophysics, as well as other issues related to life sciences.
Editorial Board Members
Dr. Stefan Hershberger (USA), Dr. Suiyun Chen (China), Dr. Farzana Perveen (Pakistan), Dr. Francisco Torrens (Spain), Dr. Filipa João (Portugal), Dr. Masahiro Yoshida (Japan), Dr. Reyhan Erdogan (Turkey), Dr. Grzegorz Żurek (Poland), Dr. Ali Izadpanah (Canada), Dr. Barbara Wiewióra (Poland), Dr. Valery Lyubimov (Russia), Dr. Amanda de Moraes Narcizo (Brasil), Dr. Marinus Frederik Willem te Pas (The Netherlands), Dr. Anthony Luke Byrne (Australia), Dr. Xingjun Li (China), Dr. Stefania Staibano (Italy), Dr. Wenle Xia (USA), Hamed Khalilvandi-Behroozyar (Iran).
Manuscripts and correspondence are invited for publication. You can submit your papers via Web Submission, or E-mail to [email protected] or [email protected]. Submission guidelines and Web Submission system are available at http://www.davidpublishing.com.
Editorial Office
9460 TELSTAR AVE SUITE 5, EL MONTE, CA 91731, USA Tel: 1-323-9847526, Fax: 1-323-9847374
E-mail:[email protected], [email protected]
Copyright©2012 by David Publishing Company and individual contributors. All rights reserved. David Publishing Company holds the exclusive copyright of all the contents of this journal. In accordance with the international convention, no part of this journal may be reproduced or transmitted by any media or publishing organs (including various websites) without the written permission of the copyright holder. Otherwise, any conduct would be considered as the violation of the copyright. The contents of this journal are available for any citation. However, all the citations should be clearly indicated with the title of this journal, serial number and the name of the author.
Abstracted / Indexed in
Database of EBSCO, Massachusetts, USA Chemical Abstracts Service (CAS), USA Cambridge Scientific Abstracts (CSA), USA
Chinese Database of CEPS, American Federal Computer Library center (OCLC), USA Ulrich’s Periodicals Directory, USA
Chinese Scientific Journals Database, VIP Corporation, Chongqing, China
Subscription Information
Price (per year): Print $520, Online $360, Print and Online $680.
David Publishing Company
9460 TELSTAR AVE SUITE 5, EL MONTE, CA 91731, USA Tel: 1-323-9847526, Fax: 1-323-9847374
E-mail: [email protected]
David Publishing Company www.davidpublishing.com
DAV ID P UBL ISH IN G
J LS
Journal of Life Sciences
Volume 6, Number 6, June 2012 (Serial Number 50)
Contents
Biochemical and Microbiology
587 Antigenicity of Synthetic Peptides Derived from Plasmodium Apoptosis-Linked Pathogenicity Factors
Ulrick Bisvigou, Estelle Sonya Zang-Edou, Florian Noulin, Rafika Zatra, Ludovic Mevono, Jean-Bernard Lékana-Douki, Dominique Mazier, Frédérick Gay and Fousseyni S. Touré Ndouo
595 Genotype × Environment Interaction of Carotene Content of Yellow-Fleshed Cassava Genotypes
in Nigeria
Norbert G. Maroya, Peter Kulakow, Alfred G.O. Dixon, Busie Maziya-Dixon and Moshood A. Bakare
602 Assessment of HRP2-Based RDT in Diagnosing Malaria Cases
Yémou Dieng, Doudou Sow, Thérèse Dieng, Abdourahmane Sow, Babacar Faye, Jean Louis Ndiaye, Daouda Ndiaye, Roger Clément Tine, Khadime Sylla, Oumar Faye, Oumar Ndir and Oumar Gaye
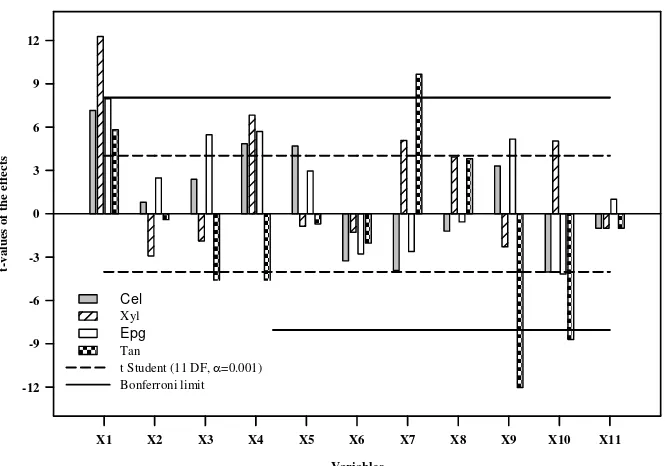
608 Selection of Relevant Variables to the Enzyme Production on Red Grape Pomace by Solid-State
Fermentation
Martha Dina Vallejo, María L. Martín, Pablo Monetta and Silvia C. Gouiric
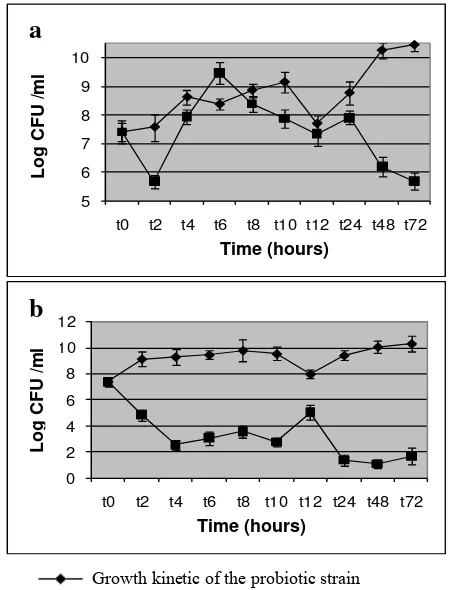
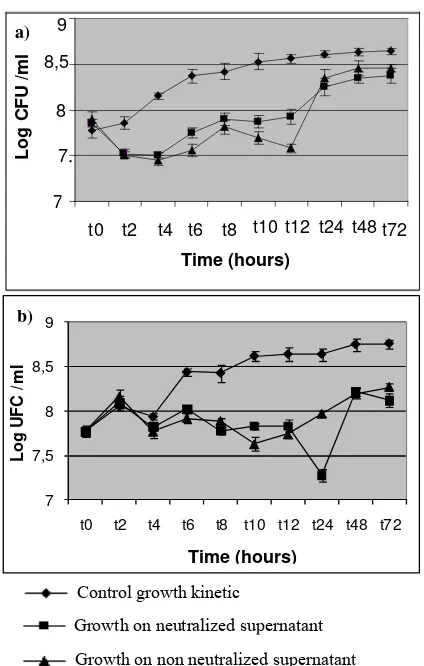
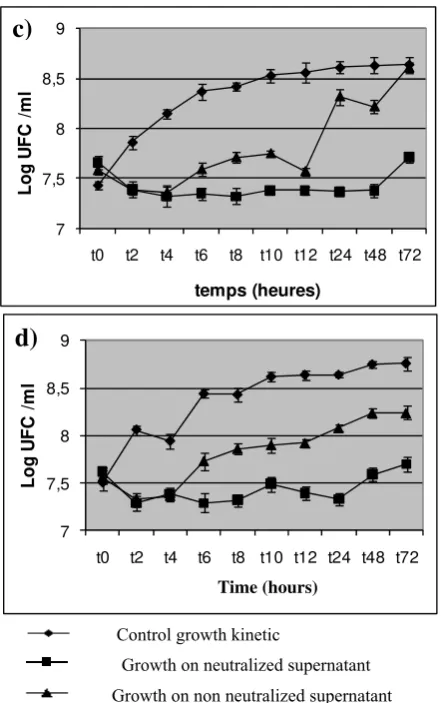
615 The in Vitro Effect of a Symbiotic Combination Between Cellobiose and Two Probiotic Strains Toward Two Pathogenic Bacteria
Amar Yacine, Tirtouil Meddah Aïcha, Meddah Boumédiene, El Keurti Khadidja, Mokhtari Bochra and Kridech Souhila
624 Some Antimicrobial Activity Plants Growing in Rize Region Used in Alternative Medicine
Gülsüm Yaldiz
Botany and Zoology
632 Distribution Boswellia sacra in Dhofar Mountains, Sultanate of Oman: Economic Value and
Environmental Role
637 Antihymolytic and Antioxidant Effects of Medicinal Plant Capparis spinosa L.
Sabah Boumerfeg, Djamila Ameni, Moufida Adjadj, Meriem Djarmouni, Seddik Khennouf, Lekhmici Arrar and Abderrahmane Baghiani
644 Late Season Sugarcane as Affected by Deficit Irrigation at the Yield Formation Stage in Northern Ivory Coast
Crépin B. Péné, Marco H. Ouattara and Sylvain G. Koulibaly
652 Antihyperglycemic Effect of Zygophyllum Geslini Aqueous Extract in Streptozotocin-Induced
Diabetic Wistar Rats
Houria Medjdoub, Boufeldja Tabti, Malika Baatouche, Leila Baou, Souhila Zehhaf and Karima Azzeddine
657 The Relationship Between Behavior with Some Productive Traits of Rabbits
Dorota Kowalska, Paweł Bielański and Mariusz Pietras
663 Spatiotemporal Dynamics of Forest and Mountain Formations in Aurès Area, Algeria
Yassine Beghami, Mahdi Kalla, Michel Thinon and Hassen Benmessaoud
Interdisciplinary Researches
670 Determination of Creatinine in PETs and Laboratory Calculations of the Peritoneal Dialysis
Adequacy
Gorana Predovan and Dragan Klarić
679 Marine and Inland Water Resources in Eneolithic Communities. New Data from Sardinia (Italy)
Maria Grazia Melis, Marco Zedda and Laura Manca
694 Efficient School Health Services and Sport Participation Among Nigerian Universities
Undergraduates
Patience Edoho Samson-Akpan and Lucas Olusegun Ogunjimi
701 Forecasting World Market Structure of Iran’s Pistachio Exports
Hossein Mehrabi Boshrabadi and Ebrahim Javdan
708 Lead Dynamics in the Body of Waterfowl That Swallowed Lead Pellets
Journal of Life Sciences 6 (2012) 587-594
Antigenicity of Synthetic Peptides Derived from
Plasmodium
Apoptosis-Linked Pathogenicity Factors
Ulrick Bisvigou1, 2, *, Estelle Sonya Zang-Edou1, *, Florian Noulin1, Rafika Zatra1, Ludovic Mevono3, Jean-Bernard
Lékana-Douki1, 4, Dominique Mazier5, 6, Frédérick Gay5, 6 and Fousseyni S. Touré Ndouo1 *
1. Unit of Medical Parasitology, International Centre for Medical Research of Franceville (CIRMF), Franceville B.P. 769, Gabon
2. Département de Santé Publique de Médecine Légale et du Travail, Université des Sciences de la Santé, Libreville B.P. 4009, Gabon
3. Medical Research Unit, Albert Schweitzer Hospital, Lambaréné, Gabon
4. Département de Parasitologie-Mycologie Médecine Tropicale, Université des Sciences de la Santé, Libreville B.P. 4009, Gabon
5. Inserm/UPMC UMR S 945, Université Pierre et Marie Curie, Paris, France
6. AP-HP Groupe Hospitalier Pitié-Salpêtrière, Service Parasitologie-Mycologie, Paris, France
Received: October 25, 2011 / Accepted: January 12, 2012 / Published: June 30, 2012.
Abstract: Background: Plasmodium falciparum malaria remains a major life-threatening disease. Recently, the Plasmodium apoptosis-linked pathogenicity factors (PALPF) have been identified. These antigens PALPF are expressed only by P.
falciparum-infected erythrocytes triggering endothelial cell apoptosis (apoptogenic). Methods: We designed ten synthetic peptides
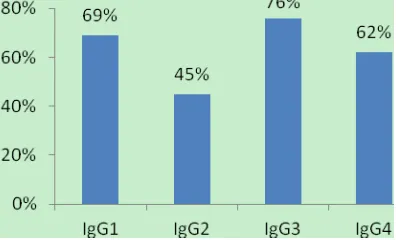
(P1 to P10) from PALPF: PF07_0032, PF10_0226, PFI0130c, PFD0875c and MAL13P1.206, and analyzed their antigenicity with an ELISA method using plasma samples from subjects living in Dienga, Gabon. Results: Four peptides showed good reactivity with human antibodies. The prevalence rate of specific IgG was 61%, 51%, 44% and 34% for P5, P6, P4 and P2, respectively. The median optical density of total IgG anti-P2 was higher than that directed against P4 and P6 (P = 0.009; P = 0.012 respectively). The prevalence rate of IgG subclasses determined with plasma samples recognizing peptide 5 for IgG1, 2, 3 and 4 isotypes was 69%, 45%, 76% and 62%, respectively. All the subjects had at least one immunoglobulin subclass, while 13 (44%) had both IgG1 and IgG3 antibodies. There was no significant difference in the prevalence rate of anti-P5 IgG1, IgG3 and IgG4. Conclusion: These results warrant further immunogenicity studies of peptides 2, 4, 5 and 6 with a view of a tentative to antimalarial vaccine development.
Key words: Malaria, vaccine candidate, antigenicity, immunoglobulin, IgG, PALPF.
1. Introduction
Plasmodium falciparum malaria remains a major
public health issue in intertropical countries, especially in Sub-Saharan Africa. There are an estimated 300 million cases annually, and about 781,000 people (mainly children) died of the disease in 2009 [1]. For still unknown reasons, some non
immune persons infected by P. falciparum develop
severe malaria and die, while others have
* Equal contributors.
Corresponding author: Fousseyni S. Touré Ndouo, Ph.D., professor, research fields: immunology, cell biology. E-mail: [email protected].
Antigenicity of Synthetic Peptides Derived from Plasmodium Apoptosis-Linked Pathogenicity Factors
588
According to some authors, the antimalarial vaccination could be feasible [15]. WHO has listed about 80 candidate vaccines in preclinical development and another 30 are being tested in clinical trials. Only 2 vaccines have reached phase IIb of clinical development, namely MSP1 [16] and RTS, S/AS02A [17]. The principal candidate is RTS,
S/AS02A, a pre-erythrocytic vaccine based on P.
falciparum circumsporozoite (CS) protein. A
randomized phase IIb trial showed that RTS, S/AS02A protected children against severe malaria with 57.7% efficacy [17], while the latest phase IIb trial in Kenya and Tanzania gave an efficacy of 53%. These results were presented at the 5th Conference of Multilateral Initiative Malaria (MIM), which was held in November 1, 2009 in Nairobi, Kenya. RTS, S/AS02A has now entered phase III trials, the results of which should be known in about three years. According to Christian Loucq, Director of PATH MVI, an effective vaccine will be marketable in about five years. A “second-generation” vaccine (RTS, S/AS02A +) combining RTS, S and other parasite antigens is already in development, with the aim of reaching 80% protection in 2020-2025.
In 2004, we showed that approximately 20% of P.
falciparum field isolates in Franceville, Gabon,
induced human lung endothelial cell (HLEC) apoptosis, by cytoadherence [18, 19]. In addition, apoptogenic isolates were more frequent in children with neurological signs (prostration or coma) [18]. Whole-transcriptome analysis showed that 59 genes were more intensely transcribed in apoptogenic isolates than in non apoptogenic ones [20]. The
complete P. falciparum genome has been sequenced
(PlasmoDB) [21]. The transcriptome includes 10 surface antigens and several enzymes involved in essential functions such as parasite replication. Functional analysis using double-strand RNA interference to knock down the expression of 8 of these genes enabled us to significantly reduce the apoptogenic response in 5 genes (PF07_0032,
PF10255, PFI0130c, PFD0875c, and MAL13P1.206). Cytoadherence was inhibited by PFD0875c and MAL13P1.206 knock down. These five genes are
known as Plasmodium apoptosis-linked pathogenicity
factors (PALPF).
Here we used PALPF-derived peptides synthesized
by GenScript© (NJ, USA) to measure naturally
occurring specific antibodies present in plasma samples collected from people living in a highly endemic area.
2. Materials and Methods
2.1 Study Site and Design
The plasma samples used in this study were collected from individuals living in Dienga, a village located in Ogooué-Lolo province in south-eastern Gabon, during an epidemiological investigation carried out in 2004. All the subjects were asymptomatic at the time of sampling.
2.2 Peptide Expression
The PALPF-derived peptides are annotated as follows in PlasmoDB (http://plasmodb.org/plasmo/): PF07_0032, PF10_0226, PFI0130c, PFD0875c, and
MAL13P1.206. Expasy© software was used to design
peptides with T and B cell epitopes from the nucleotide sequences. After confirming the amino acid sequences and the presence of the two epitopes, GenScript (New Jersey, the USA) synthesized the peptides.
2.3 Serology
Antigenicity of Synthetic Peptides Derived from Plasmodium Apoptosis-Linked Pathogenicity Factors
589
Table 1 The amino acid sequence of the 10 peptides and corresponding gene in PlasmoDB nomenclature.
Gene nomenclature in
PlasmoDB® Synthetic peptide and amino-acid PF07_0032
IgG subclass analysis used 50-fold diluted plasma, 1000-fold diluted mouse anti-human IgG1, IgG2, IgG3 and IgG4 antibodies (Sigma, St. Louis, MO, USA), and 2,000-fold diluted goat anti-mouse IgG (Sigma, St. Louis, MO, USA). Bound enzyme was detected as described above. Positive and negative control plasma samples were included in each plate. The positive cut-off was the mean optical density (OD) plus 2 SD of plasma samples from 10 non-immune subjects.
2.4 Statistical Analysis
Data were analyzed with Statview® and EPI INFO®
software. The characteristics included in the statistical analysis were the sample size, age, sex, parasitemia, and optical density (OD).
We analyzed demographic characteristics, the prevalence rate of IgG antibodies and isotypes, and the prevalence rate of multiple subclass positivity.
Proportions were analyzed with the 2-test, Student
Mann-Withney and Wilcoxon tests. Significance was
assumed at P < 0.05.
3. Results and Discussion
3.1 Study Population
The study population consisted of 50 adults aged from 17 to 67 years (median 36) and 30 children aged from 1 to 5 years (median 2). All the subjects were
asymptomatic at the time of sampling. Five adults
were smear-positive for P. falciparum (8 to 160
parasites/µL), as were six children (5 to 800 parasites/µL). Plasma from 10 European adults was used to determine ELISA cut-off values.
3.2 Choice of Peptides
Two 15-amino-acid peptides were selected, 2 for
each PALPF (GenScript©, New Jersey, the USA).
3.3 Total IgG Assay
3.3.1 PF07_0032
Peptide 1: CNTNPITRYLDRRRK
The prevalence rate of anti-P1 total IgG was 6% (3/50). The median optical density (OD) in the whole adult population was 0.122 (Fig. 1).
Peptide 2: CEEAAEKEAESEEQE
The prevalence of anti-P2 total IgG antibodies was 34% (17/50) in adults and 20% (6/30) in children. The median OD was 0.176 in the whole adult population and 0.117 for children. The median OD of positive adults was 1.532 (Fig. 1).
3.3.2 PF10_0226
Peptide 3: CRQKMKEKATQISEE
The prevalence rate of anti-P3 total IgG was 4% (2/50). The median OD in the whole adult population was 0.148 (Fig. 1).
Peptide 4: CGESEKKLEGDVTEL
The prevalence rate of anti-P4 total IgG was 44% (22/50). The median OD in the whole adult population was 0.199 and 0.455 for positive subjects (Fig. 1).
3.3.3 PFI0130c
Peptide 5: CNKNEKDKYDKLGKD
The prevalence rate of anti-P5 total IgG was 61% (30/49). The median OD in the whole adult population was 0.391 and 0.718 for positive subjects (Fig. 1).
Peptide 6: SEKTYKRYNLNGDGC
The prevalence rate of anti-P6 total IgG was 51% (25/49). The median OD in the whole adult population was 0.288 and 0.512 in positive individuals (Fig. 1).
3.3.4 FD075c and MAL13P1.206
Antigenicity of Synthetic Peptides Derived from Plasmodium
IgG isotypes were analyzed only for 29 of 50 plasmas, which gave positive reaction with peptide 5.
IgG1: Anti-P5 IgG1 was detected in 20 of the 29 subjects tested (69%). The median OD was 0.342 for the whole population and 0.845 for positive subjects (Fig. 3).
IgG2: Anti-P5 IgG2 was detected in 45% subjects (13/29). The median OD was 0.217 for the whole population and 0.522 for positive subjects (Fig. 3).
IgG3: Anti-P5 IgG3 was detected in 76% of subjects (22/29). The median OD was 0.493 for the whole population and 0.526 for positive subjects (Fig. 3).
IgG4: Anti-P5 IgG4 was detected in 62% of subjects (18/29). The median OD was 0.429 for the whole population and 0.643 for positive subjects (Fig. 3).
Fig. 1 Total IgG antibodies against peptide 1 to 6, in adults from Dienga. Europeans (E) as non-immune control, Adults (A) from Dienga and Children (C), the cut-off by a red dotted line.
Antigenicity of Synthetic Peptides Derived from Plasmodium Apoptosis-Linked Pathogenicity Factors
591
DO
0,0 0,5 1,0 1,5 2,0 2,5
E IgG1 A
DO
0,0 0,2 0,4 0,6 0,8 1,0 1,2 1,4 1,6 1,8
E A
IgG2
DO
0,0 0,5 1,0 1,5 2,0 2,5 3,0
E A
IgG3
DO
0,0 0,5 1,0 1,5 2,0 2,5
E A
IgG4
Fig. 3 Anti-P5 subclass Immunoglobulin in Dienga adult patients.
3.5 Antibody Responses to Multiple Peptides
3.5.1 Total IgG
Overall, 10.2% (5/49) of the tested plasma samples recognized 4 peptides (P2, 4, 5 and 6), and 20.4% (10/49) recognized 3 peptides (P4, P5 and P6). Peptides P5 and P6 were recognized by 38.8% (19/49) of samples, P2 and P5 by 24.5% (12/49), P2 and P6 by 22.4% (11/49); P4 and P5 by 28.6% (14/49) and P4 and P6 by 26.5% (13/49). Four samples (8%) recognized none of the peptides.
3.5.2 IgG Isotype Distribution
All 29 adults tested had at least one Ig subclass directed against P5, while 13 adults (44%) had both P5-specific IgG1 and IgG3. There was no significant difference in the prevalence of IgG1, IgG3 and IgG4, while IgG2 was significantly less prevalent than IgG3
(P = 0.015) (Fig. 4).
4. Discussion
We analyzed the prevalence rate of natural IgG
antibody reactivity to 10 peptides derived from P.
Fig. 4 Prevalence rate of IgG isotypes against peptide 5.
falciparum antigens. Four peptides (P2, P4, P5 and P6)
Antigenicity of Synthetic Peptides Derived from Plasmodium Apoptosis-Linked Pathogenicity Factors
592
have been obtained with other peptides, such as SPf66 [22], LSA-1 [23, 24], GLURP [25], EBA 175 [26] and MSP1 19 [27].
A large proportion of the subjects had total IgG antibodies reacting simultaneously with at least 2 peptides. These antibodies could be implicated in protection. In zones with perennial transmission, antibodies directed against monomorphic or variable epitopes participate in protection [28-30]. The genes encoding antigens PF07_0032 (P2) and PF10_0226 (P4) are conserved but their function is unknown. These two antigens are expressed at the schizont stage. It is not known whether the gene encoding PFI0130c (corresponding to peptides P5 and P6) is conserved. However, the protein, expressed at both trophozoite and schizont stages, is known to be exported (http://plasmodb.org/plasmo/).
Among reactive subjects, the median optical density of total IgG directed against P2 was higher than that
directed against P4 and P6 (P = 0.009; P = 0.012
respectively), while the median OD in P5 responders
was significantly higher than that in P4 (P = 0.04).
Five of the remaining 6 peptides (P1, P3, P8, P9 and P10) were recognized by 2% to 6% subjects, while P7 was not recognized by any of the samples. It is possible that the antigens from which these peptides are derived are expressed by developmental parasite stages, making them less accessible to the immune system. This could also explain the results obtained with antigens expressed by mature parasites, and particularly the schizont stage, such as PF07_0032 (P1) and PF10_0226 (P3), contrary to antigens expressed at all developmental stages. It is noteworthy that the whole-transcriptome analysis used to identify these new
P. falciparum antigens was carried out with messenger
RNA from field isolates at the schizont stage.
PFD087c (P7 and P8) and MAL13P1.206 (P9 and P10) are described as adhesins, as they are strongly associated with cytoadherence [20]. These antigens may be more accessible to the immune system because they are expressed at all developmental stages,
with maximal expression at the ring and schizont stages (http://plasmodb.org/plasmo/). Overall, these results show that the presence of B and T cell epitopes is not sufficient to ensure good antigenicity.
Approximately 20% of the children had specific total IgG directed against peptide 2. Only total IgG against peptide 2 was measured in children. Some children had antibodies directed against PALPF antigens, and particularly PF07_0032. The protective nature of these antibodies remains to be studied.
Most of the adults had IgG1, IgG2, IgG3 and IgG4 antibodies recognizing antigen PFI0130c, and particularly peptide P5. All the subjects had at least one reactive subclass, while 13 subjects (44%) had both IgG1 and IgG3. There was no significant difference in the prevalence of IgG1, IgG3 and IgG4,
but IgG2 was significantly less prevalent than IgG3 (P
= 0.015). This clearly shows competition between the different isotypes. A similar isotype distribution was found in a cohort study using recombinant EBA-175 [31], EBA-175 peptide 4 [26], MSP1 [32] and MSP2 [33, 34]. Anti-P5 IgG1 and IgG3 were most prevalent in our study. These anti-P5 antibodies could cooperate with cells to destroy the parasite and could thus be involved in protection. The prevalence of IgG4 was also high (62%). This isotype can recognize the same epitopes as IgG1 and IgG3 and could thus compete with them, limiting their role in protection.
It would be interesting to investigate whether age/exposure-related acquisition of anti-PALPF antibodies may contribute to the development of clinically protective immunity. Rodent studies of the most prevalent peptides are warranted. A synthetic “tree” peptide presenting multiple antigenic epitopes might also be of interest. Alternatively, a synthetic nucleotide sequence of these arborescent peptides could be used to produce a recombinant antigen.
5. Conclusion
In conclusion, three P. falciparum apoptogenic
Antigenicity of Synthetic Peptides Derived from Plasmodium Apoptosis-Linked Pathogenicity Factors
593
were recognized by plasma samples from a large proportion of subjects living in an endemic zone, warranting further analysis as potential vaccine candidates.
Acknowledgments
The authors thank the study participants and the staff of the Medical Parasitology Unit of Centre International de Recherches Médicales de Franceville (CIRMF).
CIRMF is funded by Total Gabon, the Gabonese government and the French Ministry of Foreign and European affairs (MAEE).
References
[1] WHO, Worl Malaria Repport, World Health Organisation, Geneva, 2008.
[2] K. Marsh, V.M. Marsh, J. Brown, H.C. Whittle, B.M. Greenwood, Plasmodium falciparum: The behavior of clinical isolates in an in vitro model of infected red blood cell sequestration, Experimental Parasitology 65 (1988) 202-208.
[3] P.H. David, S.M. Handunnetti, J.H. Leech, P. Gamage, K.N. Mendis, Rosetting: A new cytoadherence property of malaria-infected erythrocytes, The American Journal of Tropical Medecine and Hygiene 38 (1988) 289-297. [4] E. Pongponratn, M. Riganti, B. Punpoowong, M. Aikawa,
Microvascular sequestration of parasitized erythrocytes in human falciparum malaria: A pathological study, The American Journal of Tropical Medecine and Hygiene 44 (1991) 168-175.
[5] K. Silamut, N.H. Phu, C. Whitty, G.D. Turner, K. Louwrier, N.T. Mai, et al., A quantitative analysis of the microvascular sequestration of malaria parasites in the human brain, The American Journal of Pathology 155 (1999) 395-410.
[6] C. Menendez, A.F. Fleming, P.L. Alonso, Malaria-related anaemia, Parasitology Today 16 (2000) 469-476.
[7] T.E. Taylor, W.J. Fu, R.A. Carr, R.O. Whitten, J.S. Mueller, N.G. Fosiko, et al., Differentiating the pathologies of cerebral malaria by postmortem parasite counts, Nature Medicine 10 (2004) 143-145.
[8] A.M. Dondorp, P.A. Kager, J. Vreeken, N.J. White, Abnormal blood flow and red blood cell deformability in severe malaria, Parasitology Today 16 (2000) 228-232. [9] D. Mazier, J. Nitcheu, M. Idrissa-Boubou, Cerebral
malaria and immunogenetics, Parasite Immunology 22 (2000) 613-623.
[10] H. Brown, S. Rogerson, T. Taylor, M. Tembo, J. Mwenechanya, M. Molyneux, et al., Blood-brain barrier function in cerebral malaria in Malawian children, The American Journal of Tropical Medecine and Hygiene 64 (2001) 207-213.
[11] S.C. Wassmer, V. Combes, G.E. Grau, Pathophysiology of cerebral malaria: Role of host cells in the modulation of cytoadhesion, Annals of the New York Acadademy of Sciences 992 (2003) 30-38.
[12] P. Pino, I. Vouldoukis, J.P. Kolb, N. Mahmoudi, I. Desportes-Livage, F. Bricaire, et al., Plasmodium
falciparum-infected erythrocyte adhesion induces caspase
activation and apoptosis in human endothelial cells, The Journal of Infectious Diseases 187 (2003) 1283-1290. [13] V. Combes, N. Coltel, D. Faille, S.C. Wassmer, G.E.
Grau, Cerebral malaria: Role of microparticles and platelets in alterations of the blood-brain barrier, The International Journal for Parasitology 36 (2006) 541-546. [14] R. Idro, N.E. Jenkins, C.R. Newton, Pathogenesis,
clinical features, and neurological outcome of cerebral malaria, The Lancet Neurology 4 (2005) 827-840. [15] C. Rogier, E. Orlandi-Pradines, T. Fusai, B. Pradines, S.
Briolant, L. Almeras, Malaria vaccines: Prospects and reality, Médecine et Maladies Infectieuses 36 (2006) 414-422.
[16] B.R. Ogutu, O.J. Apollo, D. McKinney, W. Okoth, J. Siangla, F. Dubovsky, et al., Blood stage malaria vaccine eliciting high antigen-specific antibody concentrations confers no protection to young children in Western Kenya, PLoS One 4 (2009) e4708.
[17] P.L. Alonso, J. Sacarlal, J.J. Aponte, A. Leach, E. Macete, J. Milman, et al., Efficacy of the RTS,S/AS02A vaccine against Plasmodium falciparum infection and disease in young African children: Randomised controlled trial, Lancet 364 (2004) 1411-1420.
[18] F.S. Toure, O. Ouwe-Missi-Oukem-Boyer, U. Bisvigou, O. Moussa, C. Rogier, P. Pino, et al., Apoptosis: A potential triggering mechanism of neurological manifestation in Plasmodium falciparum malaria, Parasite Immunology 30 (2008) 47-51.
[19] K. Muanza, F. Gay, C. Behr, A. Scherf, Primary culture of human lung microvessel endothelial cells: A useful in
vitro model for studying Plasmodium falciparum-infected
erythrocyte cytoadherence, Research in Immunology 147 (1996) 149-163.
[20] A. Siau, F.S. Toure, O. Ouwe-Missi-Oukem-Boyer, L. Ciceron, N. Mahmoudi, C. Vaquero, et al., Whole-transcriptome analysis of Plasmodium falciparum field isolates: Identification of new pathogenicity factors, The Journal of Infectious Diseases 196 (2007) 1603-1612. [21] A. Bahl, B. Brunk, J. Crabtree, M.J. Fraunholz, B. Gajria,
Antigenicity of Synthetic Peptides Derived from Plasmodium Apoptosis-Linked Pathogenicity Factors
594
resource, A database integrating experimental and computational data, Nucleic Acids Research 31 (2003) 212-215.
[22] G. Patarroyo, L. Franco, R. Amador, L.A. Murillo, C.L. Rocha, M. Rojas, et al., Study of the safety and immunogenicity of the synthetic malaria SPf66 vaccine in children aged 1-14 years, Vaccine 10 (1992) 175-178. [23] F. Migot-Nabias, P. Deloron, P. Ringwald, B. Dubois, J.
Mayombo, T.N. Minh, et al., Immune response to
Plasmodium falciparum liver stage antigen-1:
Geographical variations within Central Africa and their relationship with protection from clinical malaria, Transaction of the Royal Society of Tropical Medecine and Hygiene 94 (2000) 557-562.
[24] F. Migot-Nabias, A.J. Luty, T.N. Minh, I. Fajardy, R. Tamouza, F. Marzais, et al., HLA alleles in relation to specific immunity to liver stage antigen-1 from
Plasmodium falciparum in Gabon, Genes and Immunity 2
(2001) 4-10.
[25] M. Theisen, D. Dodoo, A. Toure-Balde, S. Soe, G. Corradin, K.K. Koram, et al., Selection of glutamate-rich protein long synthetic peptides for vaccine development: antigenicity and relationship with clinical protection and immunogenicity, Infection and Immunity 69 (2001) 5223-5229.
[26] F.S. Toure, C. Bisseye, E. Mavoungou, Imbalanced distribution of Plasmodium falciparum EBA-175 genotypes related to clinical status in children from Bakoumba, Gabon, Clinical Medecine and Research 4 (2006) 7-11.
[27] A. Aubouy, F. Migot-Nabias, P. Deloron, Correlations between treatment outcome and both anti-MSP119 antibody response and erythrocyte-related genetic factors
in Plasmodium falciparum malaria, Infection, Genetics
and Evolution 7 (2007) 147-154.
[28] K. Marsh, L. Otoo, R.J. Hayes, D.C. Carson, B.M. Greenwood, Antibodies to blood stage antigens of
Plasmodium falciparum in rural Gambians and their
relation to protection against infection, Transaction of the Royal Society of Tropical Medecine and Hygiene 83 (1989) 293-303.
[29] E.M. Riley, S.J. Allen, J.G. Wheeler, M.J. Blackman, S. Bennett, B. Takacs, et al., Naturally acquired cellular and humoral immune responses to the major merozoite surface antigen (PfMSP1) of Plasmodium falciparum are associated with reduced malaria morbidity, Parasite Immunology 14 (1992) 321-337.
[30] H.A. Giha, T. Staalsoe, D. Dodoo, C. Roper, G.M. Satti, D.E. Arnot, et al., Antibodies to variable Plasmodium
falciparum-infected erythrocyte surface antigens are
associated with protection from novel malaria infections, Immunology Letters 71 (2000) 117-126.
[31] D.M. Okenu, E.M. Riley, Q.D. Bickle, P.U. Agomo, A. Barbosa, J.R. Daugherty, et al., Analysis of human antibodies to erythrocyte binding antigen 175 of
Plasmodium falciparum, Infection and Immunity 68
(2000) 5559-5566.
[32] L.A. Da Silveira, M.L. Dorta, E.A. Kimura, A.M. Katzin, F. Kawamoto, K. Tanabe, et al., Allelic diversity and antibody recognition of Plasmodium falciparum merozoite surface protein 1 during hypoendemic malaria transmission in the Brazilian amazon region, Infection and Immunity 67 (1999) 5906-5916.
[33] R.R. Taylor, S.J. Allen, B.M. Greenwood, E.M. Riley, IgG3 antibodies to Plasmodium falciparum merozoite surface protein 2 (MSP2): Increasing prevalence with age and association with clinical immunity to malaria, the American Jornal of Tropical Medecine and Hygiene 58 (1998) 406-413.
[34] R.R. Taylor, D.B. Smith, V.J. Robinson, J.S. McBride, E.M. Riley, Human antibody response to Plasmodium
falciparum merozoite surface protein 2 is serogroup
Journal of Life Sciences 6 (2012) 595-601
Genotype × Environment Interaction of Carotene
Content of Yellow-Fleshed Cassava Genotypes in
Nigeria
Norbert G. Maroya1, Peter Kulakow1, Alfred G.O. Dixon2, Busie Maziya-Dixon1 and Moshood A. Bakare1 1. International Institute of Tropical Agriculture, PMB5320, Ibadan, Oyo State, Nigeria
2. Sierra Leone Agricultural Research Institute,PMB1313, Freetown, Sierra Leone
Received: November 20, 2011 / Accepted: January 16, 2012 / Published: June 30, 2012.
Abstract: Cassava is an important starchy root crop and a major staple for more than 70 million people in Nigeria. New yellow-fleshed genotypes are being developed to combat vitamin A deficiency. Trials of 18 yellow-fleshed genotypes and two officially released white-fleshed clones, used as checks for 2008/2009 and 2009/2010 seasons in five major cassava growing agroecological zones of Nigeria. The trial locations were Ikenne (humid forest), Ibadan (forest-savanna transition), Ubiaja (subhumid forest), Mokwa (southern Guinea savanna) and Zaria (northern Guinea savanna). At each location, the trial was established in a randomized complete block design with four replications. The objective of the study was to assess genotype performance and genotype × environment interaction for total carotene concentration (TCC), total carotene content per root (TC-R), and total carotene content per plant (TC-P). Significant differences (P < 0.001) among genotypes, environments and genotype × environment interaction for all the traits evaluated were observed. For TCC, TC-R and TC-P, the best genotypes across the 10 environments were TMS I051601, TMS I050311, and TMS I050998. Variation among genotypes accounted for most of the Total Sum of Squares for TCC (67.9%), TC-R (39.0%) and TC-P (35.9%). These characteristics of total carotene were also highly correlated. This study revealed that cassava with total carotene concentration can be assessed using either the TCC, or the TC-R, or the TC-P.
Key words: Yellow-fleshed cassava, carotene, genotype × environment interaction.
1. Introduction
Cultivars of cassava (Manihot esculenta Crantz) often demonstrate specific adaptation because of their high sensitivity to the genotype × environment interaction. Genotype (G) refers to the set of genes possessed by individuals that are important for the expression of the traits under investigation. The Environment (E) is usually defined as all non-genetic factors that influence the expression of traits and includes all biophysical factors such as water, nutrition, temperature, and the diseases or pests that influence the growth and development of individuals,
Corresponding author: Norbert G. Maroya, Ph.D., research fields: breeding cassava for high carotene content, high dry matter content and resistance to cassava mosaic diseases. E-mail: [email protected].
thereby influencing the expression of traits [1]. Genotype × environment (G × E) interaction occurs in both short-term and long-term crop performance trials [2]. It is the change in cultivars’ relative performance when grown in different environments, resulting from the differential response of the genotypes to various edaphic, climatic and biotic factors [3]. G × E interaction is a major concern in plant breeding because it reduces progress from selection and makes cultivar recommendation difficult because the choice of superior cultivars changes with locations [4].
Genotype × Environment Interaction of Carotene Content of Yellow-Fleshed Cassava Genotypes in Nigeria 596
country in SSA, producing 44.58 million ton 3.78 million ha. In Nigeria, more than 70% of the production is processed into gari at the village level.
Gari is the principal source of calories for 70-80 million Nigerians. In some locations in the South East of the country, most farmers grow varieties with white roots but processors during gari preparation, add palm oil. The resultant yellow gari commands a higher price, as it is preferred by a larger proportion of the populace. Therefore, it is important to breed and promote yellow-fleshed cassava varieties which are very useful in combating the widespread vitamin A deficiency.
A nationwide food consumption and nutrition survey revealed that 29.5% of children under 5 years of age were vitamin A deficient (serum retinol < 0.70 µmol/L) [6]. The proportion differed among agroecological zones with an incidence of 31.3% in the dry savanna, 24.0% in the moist savanna, and 29.9% in the humid forest (P < 0.001). β-carotene, the most potent and widespread form of pro-vitamin A [7], is the predominant carotenoid in cassava, occurring as a mixture of trans- and cis-forms [8]. Structurally, vitamin A (retinol) is essentially one-half of the
β-carotene molecules. Typical white-fleshed genotypes contain only small amounts of β-carotene [9], however, yellow-fleshed cassava contains up to about 100 times more [10].
2. Materials and Methods
A set of 18 yellow-fleshed cassava genotypes at a breeding stage known as Uniform Yield Trial with
two white-fleshed check genotypes were evaluated at five locations representing the major cassava growing agroecological zones in Nigeria. The 20 genotypes were cultivated for two 12-month cropping seasons in 2008/2009 and 2009/2010 at Ibadan (forest-savanna transition); Ikenne (humid forest); Ubiaja (sub-humid forest); Mokwa (southern Guinea savanna); and Zaria (northern Guinea savanna) (Table 1). The five locations combined with the two cropping seasons constituted the 10 environments in which the genotypes were evaluated (Table 2).
A randomized complete block design with four replications was used at each location with plants established under rain-fed conditions at 1 m × 1 m spacing on ridges about 0.3 m high. Each experimental unit was a 6 m × 6 m plot of 36 plants. No fertilizer was applied. Weed control was accomplished manually as necessary. Harvesting was done in all the locations at approximately 12 months after planting. A border of 1 m was left and only the inner plants (maximum of 16 plants per plot) were harvested.
Table 2 List and composition of the 10 environments.
Abbreviation for GGE biplot Locations Cropping seasons
E1 Ibadan 2008-2009
E2 Ibadan 2009-2010
E3 Ikenne 2008-2009
E4 Ikenne 2009-2010
E5 Mokwa 2008-2009
E6 Mokwa 2009-2010
E7 Ubiaja 2008-2009
E8 Ubiaja 2009-2010
E9 Zaria 2008-2009
E10 Zaria 2009-2010
Table 1 Characteristics of five locations representing the agroecological zones where the trials were conducted.
Location Latitude Longitude Max. T (°C)
soil type Agroecological zone
Ibadan 7.388 3.896 27.3-33.8 20.7-23.1 227 238 1,312 Ferric Luvisols Forest Savanna transition Ikenne 6.867 3.717 28.2-33.4 22.3-24.8 44 242 1,515 Distric Nitosols Humid forest
Genotype × Environment Interaction of Carotene Content of Yellow-Fleshed Cassava Genotypes in Nigeria
597
For laboratory determination of total carotene concentration (TCC), five medium sized roots were collected from the harvested roots in two replications. Three of the five roots were washed, dried, peeled, and again washed and dried with tissue paper. Each peeled root was cut longitudinally in half and the two halves were again cut longitudinally into quarters. Two opposite quarters of the three roots were pooled for total carotene quantification. The six quarters were cut in small pieces of about 1 cm3 and mixed together. After many subdivisions, a sample of approximately 10-15 g of small pieces of root was taken as uniform and representative. The sample was ground in refrigerated acetone solvent using a mortar and pestle.
All analyses of the total carotene were completed within 24 hours after each harvest, using the spectrophotometer method described in the HarvestPlus Handbook for Carotenoid Analysis [11]. During sample preparation, special care was taken to avoid directly exposing the storage roots to sunlight and the lights in the laboratory were protected with UV filters. Samples were covered with aluminium foil when not under processing.
For cassava, it was known that the peel weight represents an average of 15% (ranging from 10 to 20%) of the weight of the storage root and the edible fleshy portion makes up an average of 85% [12]. Based on the fact that the TCC was determined per gram using the peeled root, the average carotene content per storage root (TC-R) was calculated as follows:
TC-R (µg) = TCC (µg·g-1) * 85% (average weight of individual fresh root (g)) (1)
Similarly, the total carotene content in storage roots per plant (TC-P) was obtained by multiplying the TCC by 85%, the average weight of the flesh in the storage roots per plant, as indicated in the formula below:
TC-P (µg) = TCC (µg·g-1) * 85% (average root weight per plant (g)) (2)
Data collected were statistically analyzed using the GGE biplot. This is a tool for G × E data analysis to achieve understanding about test environments and genotypes. It is a set of interpretation methods and refers to a biplot that is based on the principal component analysis of environment-centered or standardized G × E data that displays both genotype main effects (G) and the genotype × environment interaction. These are the two sources of variation that are relevant to variety evaluation [13].
3. Results and Discussion
3.1 Total Carotene Concentration in Fresh Storage
Roots
The statistical analyses of data recorded for TCC has shown significant differences among genotypes, environment, and for genotype × environment interaction (Table 3). The contribution to the total Sum of Squares was 67.9% for genotypes; 6.7% for environment, and 14.8% for the genotype × environment interaction. These three sources of variation together have a contribution of 87.4% to the Sum of Squares.
The highest TCC (5.97 µg·g-1 fresh weight) was obtained for genotype TMS I0150311 and the lowest average was recorded by the white check TMS I30572
Table 3 Combined analysis of variance table and the contribution of genotype, environment and genotype × environment interaction to the Sum of Squares of total carotene concentration.
Source DF SS MS F P %SS
Total 398 1,086.6
G 19 738.1 38.8 66.9 < 0.001 67.9
E 9 73.1 8.1 14.0 < 0.001 6.7
G*E 171 160.7 0.9 1.6 < 0.001 14.8
BLK(E) 10 4.9 0.5 0.8
Genotype × Environment Interaction of Carotene Content of Yellow-Fleshed Cassava Genotypes in Nigeria 598
(0.87 µg·g1 fresh weight). The carotene concentration reported in this work ranged from a minimum 0.87 to a maximum 5.92 µg·g-1 (Table 4). These values were lower than the range from 1.45 to 7.69 µg·g-1 with an average of 4.26 µg·g-1 obtained in a similar study conducted with seven genotypes in two years at three locations in Ghana [14]. The average TCC of this study (3.6 µg·g-1) was also lower than the 5.04 µg·g-1 reported for 25 yellow-fleshed genotypes in Nigeria [15].
In the GGE biplot analysis, the first and second principal components together explained 89.7% of the total variation. Genotypes G12, G5, and G6 had the
highest value of TCC. Genotypes G15 and G10 (the
white-fleshed checks) had the lowest TCC. A polygon view of the GGE biplot (Fig. 1) showed which genotypes performed best in which environments. The vertex genotypes for TCC were G12, G5, G15, and G10.
Two mega-environments were defined. The first was
the winning niche occupied by genotype G12 andalso
contained E1, E2, E3, E9, and E10. The second fell in
the sector of genotype G5 and comprised
environments E4, E5, E6, E7, and E9.
3.2 Average Total Carotene Content per Fresh Storage Root
The TC-R per genotype ranged from 218.7 to 1,925.4 µg with the mean of 969.7 µg (Table 4). The highest value of TC-R was recorded for TMS I051601 (G12) and TMS I050311 (G5). The lowest
value was registered for TMS I30572 (G15) and TME
B1 (G10). These genotypes were those identified
using TCC. The variation of TC-R among genotypes was similar to that observed for TCC. The table of Analysis of Variance of the combined data of the ten environments (Table 5) also showed significant differences among genotypes, environments, and
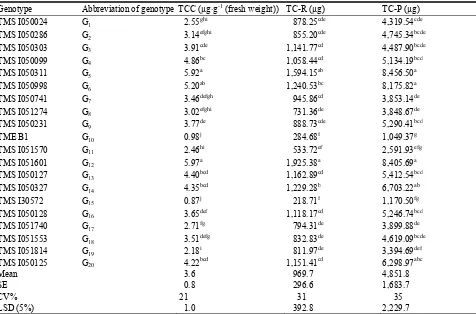
Table 4 Average TCC (µg·g-1); TC-R (µg) and TC-P (µg) for 18 yellow-fleshed and two white-fleshed cassava genotypes in 10 environments.
Genotype Abbreviation of genotype TCC (µg·g-1 (fresh weight)) TC-R (µg) TC-P (µg)
TMS I050024 G1 2.55ghi 878.25cde 4,319.54cde
TMS I050286 G2 3.14efghi 855.20cde 4,745.34bcde
TMS I050303 G3 3.91cde 1,141.77cd 4,487.90bcde
TMS I050099 G4 4.86bc 1,058.44cd 5,134.19bcd
TMS I050311 G5 5.92a 1,594.15ab 8,456.50a
TMS I050998 G6 5.20ab 1,240.53bc 8,175.82a
TMS I050741 G7 3.46defgh 945.86cd 3,853.14de
TMS I051274 G8 3.02efghi 731.36de 3,848.67de
TMS I050231 G9 3.77de 888.73cde 5,290.41bcd
TME B1 G10 0.98j 284.68f 1,049.37g
TMS I051570 G11 2.46hi 533.72ef 2,591.93efg
TMS I051601 G12 5.97a 1,925.38a 8,405.69a
TMS I050127 G13 4.40bcd 1,162.89cd 5,412.54bcd
TMS I050327 G14 4.35bcd 1,229.28b 6,703.22ab
TMS I30572 G15 0.87j 218.71f 1,170.50fg
TMS I050128 G16 3.65def 1,118.17cd 5,246.74bcd
TMS I051740 G17 2.71fg 794.31de 3,899.88de
TMS I051553 G18 3.51defg 832.83de 4,619.09bcde
TMS I051814 G19 2.18i 811.97de 3,394.69def
TMS I050125 G20 4.22bcd 1,151.41cd 6,298.97abc
Mean 3.6 969.7 4,851.8
SE 0.8 296.6 1,683.7
CV% 21 31 35
LSD (5%) 1.0 392.8 2,229.7
Genotype × Environment Interaction of Carotene Content of Yellow-Fleshed Cassava Genotypes in Nigeria
599
genotype × environment interaction.
The contribution of genotype to the total Sum of Squares of TC-R was 39.1% (lower than the 67.9% of TCC). The respective contributions of the environment and the genotype × environment interaction were 24.9% and 23.1% higher than those of TCC. When the contributions of the three sources of variation are combined, they accounted for 87.1% of the total Sum of Squares.
The GGE biplot of TC-R (Fig. 2) showed plots of two principal components that explained 83.7% of the total variation. The vertex genotypes, G18 (same sector
for G17) and G13, anchored sectorsthat covered all 10
environments grouped into two mega-environments with G18 linking E4, E6, E9, and E10 and with G13
grouped with environments E1, E2, E3, E5, E7, and E8.
3.3 Average Total Carotene Content in Fresh Storage
Roots per Plant
The genotype means for TC-P ranged from 1,049.37 to 8,456.50 µg (Table 6). The lowest TC-P was recorded for the white-fleshed check varieties TME B1 (G10) and TMS I30572 (G15). The highest
values were registered for G5 (TMSI050311); G12
(TMS I051601), and G6 (TMS I050998). G5 and G12
were identified in the first category with the highest content for all the three total carotene traits. The
results for TC-P in ranking were very similar to those of TCC and TC-R. The contribution of the genotype, environment, and genotype × environment interaction to the variation in the total Sum of Squares of TC-P accounted respectively for 35.9%; 27.6%; and 23.6%. These three contributions in the Total Sum of Squares of TC-P were equal to 87.1%, the same as for TC-R and very close to those of TCC (89.4%).
The two principal components explained 85.1% of the total variation in a polygon view of the GGE biplot (Fig. 3) that showed which genotypes won in which environments for TC-P. The vertex genotypes for the TC-P were G13, G17, and G4. The
two mega- environments were defined in the sectors of G13 (or G12) and G17, each having five
environments. The first mega-environment was the winning niche of genotypes G12 and G13 made up of
E1, E2, E3, E7, and E9. The second fell in the sector
of genotype G17 and was made up of environments
E4, E5, E6, E8, and E10.
3.4 Relationships Among Total Carotene Content Characteristics
The correlation coefficients (Table 7) revealed that TCC was significantly correlated with TC-R (0.94) and TC-P (0.95). The TC-R was also significantly correlated with TC-P (0.93). These results mean that
Table 5 Combined analysis of variance table and genotype, environment and genotype × environment contributions to the Sum of Squares of TC-R.
Source DF SS MS F P %SS
TOTAL 398 1.5E + 08
G 19 5.9E + 07 3.1E + 06 35.4 < 0.001 39.1
E 9 3.7E + 07 4.2E + 06 47.5 < 0.001 24.9
G*E 171 3.5E + 07 2.0E + 05 2.3 < 0.001 23.1
BLK(E) 10 2.9E + 06 2.9E + 05 3.4
Error 189 1.7E + 07 8.8E + 04
Table 6 Combined contributions of analysis of variance table, genotype, environment, and genotype × environment interaction to the Sum of Squares of TC-P.
Source DF SS MS F P %SS
TOTAL 398 4.5E + 09
G 19 1.6E + 09 8.6E + 07 30.3 < 0.001 35.9
E 9 1.2E + 09 1.4E + 08 49.1 < 0.001 27.6
G*E 171 1.1E + 09 6.2E + 06 2.2 < 0.001 23.6
BLK(E) 10 4.9E + 07 4.9E + 06 1.7
Genotype × Environment Interaction of Carotene Content of Yellow-Fleshed Cassava Genotypes in Nigeria 600
Fig. 1 Mega-environment defined by different winning cassava genotypes tested in 10 environments for TCC (µg·g-1 fresh weight).
Fig. 2 Mega-environment defined by different winning cassava genotypes tested in 10 environments for TC-R.
Genotype × Environment Interaction of Carotene Content of Yellow-Fleshed Cassava Genotypes in Nigeria
601
Table 7 Pearson correlation coefficients among total carotene traits based on the average values over the genotypes and the environments.
TCC TC-R TC-P
TCC 1 0.937 0.949
TC-R 1 0.933
TC-P 1
for screening cassava genotypes for total carotene concentration some proportion of either the average weight per root or the average root weight per plant can be integrated.
4. Conclusion
Although the yellow-fleshed cassava genotypes used in this research had a low TCC there was a significant variation among genotypes, environments, and genotype × environment interaction. This was true for TCC, TC-R and TC-P. For all three traits the best genotypes were TMS I051601 and TMS I050311, followed by TMS I050998. The results for these genotypes showed that the evaluation of TCC provided the same grouping of genotypes as TC-R and TC-P. With the high and significant level of correlations among these traits, it appears that TC-R and TC-P sufficiently described the carotene concentration of these genotypes. It is therefore advisable to use TC-R or TC-P to characterize the genotypes for total carotene enriched cassava breeding trials that will help to determine in advance the number of plants to harvest per genotype.
Acknowledgments
Authors are grateful to HarvestPlus for financial support to these research findings.
References
[1] K.E. Basford, M. Cooper, Genotype × environmental interactions and some considerations of their implications for wheat breeding in Australia, Australian Journal Agricultural Research 49 (1998) 154-174.
[2] S.A. Eberhart, W.A. Russel, Stability parameters for comparing varieties, Crop Science 6 (1966) 36-40. [3] A.G.O. Dixon, R. Asiedu, S.K. Hahn, Genotypic stability
and adaptability: Analytical methods and implications for cassava breeding for low-input agriculture, in: F. Ofori, S.K. Hahn (Eds.), Tropical Root Crops in a Developing Economy, Proceedings of the 9th Symposium of the International Society for Tropical Root Crops, Accra, Ghana, 1991, pp. 130-137, 531.
[4] M.S. Kang, R. Magari, New developments in selecting for phenotypic stability in crop breeding, in: M.S. Kang, H.G. Zobel Jr. (Eds.), Genotype-by-Environment Interaction, CRC Press, Boca Raton, Florida, USA, 1996, pp. 51-84.
[5] FAO, Cassava Production Outlook, FAO, Rome, Italy, June, 2011.
[6] B. Maziya-Dixon, I.O. Akinyele, R.A. Sanusi, T.E. Oguntona, S.K. Nokoe, E.W. Harris, Vitamin A deficiency is prevalent in children less than 5 years of age in Nigeria, Journal of Nutrition 136 (8) (2006) 2255-2261.
[7] D.B. Rodriguez-Amaya, Nature and distribution of carotenoids in foods, in: G. Charalambous, (Ed.), Shelf-Life Studies of Foods and Beverages, Chemical, Biological, Physical and Nutritional Aspects, Elsevier Science Publishers, Amsterdam, The Netherlands, 1993, pp. 547-589.
[8] D.B. Rodriguez-Amaya, M. Kimura, A Guide to Carotenoid Analysis in Foods, OMRI Research, International Life Sciences Institute (ILSI) Washington 20005-5802, USA, ISBN 1-57881-072-8, 2001, p. 64. [9] J.H. Bradbury, W.D. Holloway, Chemistry of Tropical
Root Crops, Significance for Nutrition and Agriculture in the Pacific, ACIAR, Canberra, Australia, 1988, pp. 53-77 [10] I. McDowell, K.A. Oduro, Investigation of β-carotene
content of yellow varieties of cassava Manihot esculenta Crantz, Journal of Plant Foods 5 (1983) 169-171.
[11] D.B. Rodriguez-Amaya, M. Kimura, HarvestPlus Handbook for Carotenoid Analysis, HarvestPlus Technical Monograph 2, IFPRI and CIAT, Washington DC and Cali, 2004, pp. 10-11.
[12] International Institute of Tropical Agriculture, Tuber and Root Crops Production Manual, Manual Series No. 9, Ibadan, Nigeria, May, 1982.
[13] H.G. Gauch, R.W. Zobel, AMMI analysis of yield trials, in: M.S. Kang, H.G. Gauch, Jr. (Eds.), Genotype by Environment Interaction, CRS Press, New York, Washington DC, 1996.
[14] N.G. Maroya, Genotype by environment interaction effect on beta carotene and some yield components of yellow root cassava (Manihot esculenta Crantz) genotypes in Ghana, Ph.D. Thesis, University of Ghana, Legon, 2008, p. 165.
Journal of Life Sciences 6 (2012) 602-607
Assessment of HRP2-Based RDT in Diagnosing Malaria
Cases
Yémou Dieng1, 2, Doudou Sow1, 2, Thérèse Dieng1, 2, Abdourahmane Sow2, Babacar Faye1, Jean Louis Ndiaye1, Daouda Ndiaye1, Roger Clément Tine1, 2, Khadime Sylla1, 2, Oumar Faye1, Oumar Ndir1 and Oumar Gaye1
1. Department of Parasitology-Mycology, Dakar, Université Cheikh Anta Diop, Dakar Fann 5005, Senegal
2. Department of Parasitology-Mycology, Dakar, Centre Hospitalier Universitaire National de Fann, Dakar 5035, Senegal
Received: November 07, 2011 / Accepted: February 01, 2012 / Published: June 30, 2012.
Abstract: Background: HRP2-based Rapid Diagnostic Tests (RDTs) for malaria ensure a rational use of artemisinin-based combination therapy (ACT). The HRP2 antigen can go through the cerebrospinal fluid (CSF). Purpose: To assess the HRP2-based RDT in malaria and detect the HRP2 in CSF. Methods: From November 2006 to May 2007, all patients under 15 years showing clinical symptoms of malaria were included. RDT was performed on the CSF and peripheral blood. Results: Out of the 951 patients included, 131 (13.7%) were confirmed through RDT and 130 (13.6%) through thick blood smear. Sensitivity and specificity stood at 96.96% and 99.71% respectively, for uncomplicated cases and at 100% and 99.13% for severe cases. Tests to detect HRP2 in the CSF of 52 cases were negative. Conclusion: Tests to detect HRP2 in the CSF could make it possible to diagnose severe malaria cases when peripheral parasitemia would be below the detection threshold.
Key words: Malaria, rapid diagnostic test, paediatrics, HRP2 antigen, cerebrospinal fluid.
1. Introduction
Malaria remains a major public health problem in Sub-Saharan Africa [1]. The main control strategies are primarily focused on the use of long acting insecticide-treated nets, indoor residual spraying, management of cases with artemisinin-based combination therapy (ACTs) and, in some countries, intermittent preventive treatment (IPT) during pregnancy [1].
However, the correct management of cases must necessarily go through a clinical diagnosis, confirmed by biology (thick blood smear) for a rational use of ACTs. Given the difficulty in collecting this thick blood smear especially in peripheral structures, WHO has recommended the use of rapid diagnostic test (RDT), easy to perform and can be based either on
Corresponding author: Doudou Sow, M.Sc., MD
houseman, research fields: biology and parasite control. E-mail: [email protected].
searching for histidine rich protein 2 (HRP2) specific
to Plasmodium falciparum or parasite lactate
Assessment of HRP2-Based RDT in Diagnosing Malaria Cases 603
(Paracheck Pf®) when compared with malaria in the thick blood smear (TBS).
2. Methodology
2.1 Study Framework
Our study was conducted at the Hôpital d’Enfants Albert Royer (HEAR) of Fann which is a teaching hospital located in the Dakar region. It includes a high level technical support centre with a multipurpose laboratory for medical analysis.
2.2 Study Type and Population
This was a prospective study conducted from November 2006 to May 2007. During this period, all patients under 15 years of age received as outpatients or hospitalized for clinical signs of uncomplicated or severe malaria were included in our study.
3. Methods
Capillary blood is collected from the fingertip of any patient showing clinical signs of malaria. Those with signs of uncomplicated malaria underwent a thick/thin smear blood and rapid diagnostic test in accordance with the manufacturer’s recommendations.
In patients with neurological signs, in addition to the thick/thin blood smears made from capillary blood, a rapid diagnostic test was performed in both blood and CSF. The latter was obtained through an etiological assessment of the child’s infection global picture.
RDT used in this study is the Paracheck Pf® which is based on the detection of HRP2. These tests were provided by the Programme National de Lutte Contre le Paludisme in Senegal (PNLP) which had deployed them in some health facilities including HEAR, as part of the scaling up exercise at national level. The thick and thin blood smears were performed using Giemsa diluted to 10% for a staining time of 20 min. The reading was performed by two experienced technicians. In all cases, parasitemia was expressed as the number of
parasites per µL of blood by counting the number of parasites per 200 leukocytes with a mean WBC count of 8000 GB/µL of blood.
3.1 Data Mining and Statistical Analysis
The data were entered and analyzed using software EPI Info 6.
3.2 Ethical Considerations
The legal representatives of all patients included in this study were informed of the use of their pathological products collected as part of their infection assessment. And they all gave an oral approval.
4. Results
4.1 Sociodemographic Characteristics
At the end of the study which lasted 6 months, 951 patients under 15 years of age were suspected of malaria. Among them, there were 130 (13.6%) and 131 (13.7%) cases of malaria confirmed through thick blood smear and RDT, respectively.
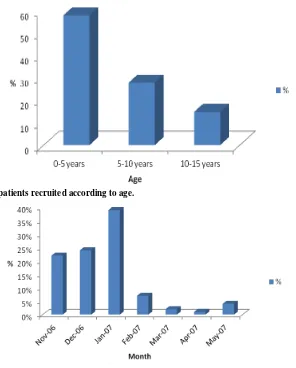
The age group 0-5 years was the most represented with 57.7%, while children aged 10-15 years were only 14.6% (Fig. 1). We noted an uneven distribution of the study population for males with a sex-ratio of 1.2.
During the study period, we observed that 85.4% of our patients were recruited from November 2006 to January 2007 while the low recruitments took place around the month of April (Fig. 2). In addition, 66% of malaria cases diagnosed are from the suburbs of Dakar.
4.2 Clinico-Biological Characteristics of Malaria Patients
Assessment of HRP2-Based RDT in Diagnosing Malaria Cases 604
Fig. 1 Distribution of patients recruited according to age.
Fig. 2 Monthly distribution of malaria cases depending on Paracheck Pf®.
falciparum malaria confirmed through thick blood
smear was as follows:
66 cases of uncomplicated malaria (8.5%);
64 cases of severe malaria (35.5%) including 52 with neurological signs (Table 1).
Parasitemia of 88 of them (67.7%) ranged from 0-3000 P/µL while that above 12000 P/µL represented 1.5% of patients (Table 2).
Among the 52 patients with neurological signs, 40
Table 1 Distribution of patients based on clinical form.
Clinical form TBS Test
Uncomplicated malaria 66 66
Severe malaria 64 65
Total 130 131
(76.9%) had a parasitemia ≥ 3000 P/µL while in the remaining 12 having other signs of severity 2 had a parasitemia ≥ 3000 P/µL. All the 66 cases of uncomplicated malaria had a parasitemia ≤ 3000 P/µL.
4.3 Results of Paracheck and Thick Blood Smear in
the Blood
Table 2 shows both TBS and RDT results in the blood in clinical forms.
Assessment of HRP2-Based RDT in Diagnosing Malaria Cases 605
Table 2 Distribution of parasite density depending on thick blood smear or Paracheck pf®.
Parasite density in Parasites/µL Thick blood smear positive Paracheck pf ®
positive Number of cases percentage Number of cases Percentage
0 — — 3 2.3
1-3000 88 67.70 86 65.6
3001-6000 20 15.40 20 15.3
6001-9000 7 5.40 7 5.3
9001-12000 13 10.00 13 9.9
12001-15000 1 0.75 1 0.7
Higher than 15000 1 0.75 1 0.7
Total 130 100 131 100
Table 3 Distribution of results of test depending on thick blood smear in uncomplicated forms of Malaria.
Paracheck Pf® Thick blood smear positive Thick blood smear negative Total
Test positive 64 2 66
Test negative 2 703 705
Total 66 705 771
Table 4 Distribution of results of test depending on thick blood smear in severe forms of malaria.
Paracheck Pf® Thick blood smear positive Thick blood smear negative Total
Test positive 64 1 65
Test negative 0 115 115
Total 64 116 180
as the reference method.
They were distributed as follows: 2 cases of uncomplicated malaria, 1 case of severe malaria for false positives while the 2 cases of false negatives were found in the uncomplicated cases of malaria.
The sensitivity and specificity of the test were respectively 96.96% and 99.71% in patients with symptoms of uncomplicated malaria.
For patients with an array of severe malaria, the sensitivity and specificity stood at 100% and 99.13% respectively.
4.4 Test Results in Cerebrospinal Fluid
The test to detect the HRP2 antigen was performed in the cerebrospinal fluid of 107 patients with neurological signs warranting a lumbar puncture for an etiological assessment. Thick blood smears and tests conducted in the peripheral blood of these patients were positive in 52 cases whereas the tests performed in the CSF were negative.
5. Discussion
The results of our study in children show that the age group 0-5 years is the most affected with 54.7% of cases and confirms the specific vulnerability to affection of this age group. During the study period, we diagnosed almost as many uncomplicated as severe cases of malaria. The proportion of cases confirmed through TBS was higher for severe cases compared to uncomplicated cases (35.5% vs. 8.5%). For severe malaria, neurological forms predominated
with 40 cases (62.5%), consistent with previous studies conducted in this department [11]. Parasitemia is lower in uncomplicated cases, showing a low immunity in this population. Indeed, Dakar is an hypo-endemic area where transmission is low [12].
Assessment of HRP2-Based RDT in Diagnosing Malaria Cases 606
higher than those recommended by WHO for a parasitemia ≥ 100 P/µL [3, 13, 14].
Our results are also close to the levels of some studies published especially in Africa, which show sensitivities and specificities ranging from 96 to 100% [15, 16]. These various findings confirm that different tests for rapid diagnosis of malaria based on HRP2 are a valuable diagnostic tool for malaria, easy to use especially in peripheral health facilities [17, 18]. However, the majority of published data on the effectiveness of RDTs concern uncomplicated forms of malaria.
However, we noted some cases of discrepancy with Thick Blood Smear in both uncomplicated and severe forms of malaria. This false positivity in all forms of malaria could be due to a persistence of HRP2 in blood after treatment of a previous malaria episode. Indeed, it is possible that these children have presented a previous episode of malaria because of the study corresponding to that of the transmission in Senegal. It is known that during the transmission period, children can make up to 3 attacks of malaria [19].
As for false negatives, low parasitemia could be the source of the negativity of the test. Indeed, the 2 negative cases had a parasite density that was 80 and 120 P/µL. This phenomenon was reported in other studies with a parasitemia lower than 200 P/µL [20, 21]. Another explanation could be the existence of immune complexes associated with the presence of antibodies anti HRP2 as has been demonstrated by Biswas, Tomar and Roa [22]. Finally, HRP2 gene deletion is reported in some regions and could explain the false negativity [23-25]. The sensitivity and specificity of HRP2-based RDTs in patients with severe forms of malaria have been assessed by a few authors only [20, 21]. HRP2 antigen is secreted by both asexual forms and young gametocytes of P.
falciparum. Tests to detect it in the CSF of patients with severe malaria and neurological signs were negative. Peripheral parasitemia does not reflect the
parasite biomass of the organism due to sequestration. This concerns the older forms of the parasite (old trophozoite and schizont) only and may be accompanied by a decrease in peripheral parasitemia [26]. The pathogenesis of neurological signs observed in severe malaria and reduced peripheral parasitemia may be related to sequestration. It can cause a negative test in peripheral blood. During sequestration, the HRP2 is secreted in plasma and released to the outbreak of schizonts. This should allow its passage into the CSF as was already described by some authors [6-8] and lead to positive test in CSF. But the absence of HRP2 in the CSF of our patients with neurological signs might suggest other mechanisms of occurrence of these signs. Among these include the cytokines released by the bursting of parasitized erythrocytes with a parasitemia therefore detectable by the test.
6. Conclusion
HRP2 detection in the CSF could allow the diagnosis of severe malaria among subjects whose peripheral parasitemia would be below the detection threshold of both TBS and test. Therefore, this study deserves to be performed in adults living in endemic areas in which acquired immunity could promote this situation.
References
[1] World Health Organization, World Malaria Report, Geneva, 2008.
[2] A. Moody, Rapid diagnostic tests for malaria parasites, Clinical Microbiology Reviews 15 (2002) 66-78. [3] C.K. Murray, R.A. Gasser, A.J. Magill, R. Scott Miller,
Update on rapid diagnostic testing for malaria, Clinical Microbiology Reviews 21 (2008) 97-110.
[4] V. Desakorn, A.M. Dondorp, K. Silamut, W. Pongtavornpinyo, D. Sahassananda, K. Chotivanich, et al., Stage-dependent production and release of histidine-rich protein 2 by Plasmodium falciparum, Transactions of the Royal Society of Tropical Medicine and Hygiene 99 (2005) 517-524.