LAPORAN AKHIR
PENELITIAN PASCASARJNA
DANA ITS 2020
Pemodelan Multi-Criteria Sorting Problem pada Akuisisi Core dalam Sistem
Remanufaktur
Tim Peneliti :
Prof. Dr. Ir. Udisubakti Ciptomulyono, M.Eng.Sc.
(Departemen Teknik Sistem dan Industri/Fakultas Teknologi Industri dan Rekayasa Sistem)
Nani Kurniati, S.T., M.T., Ph.D.
(Departemen Teknik Sistem dan Industri/Fakultas Teknologi Industri dan Rekayasa Sistem)
M. Imron Mustajib, S.T., M.T.
(Departemen Teknik Sistem dan Industri/Fakultas Teknologi Industri dan Rekayasa Sistem)
DIREKTORAT RISET DAN PENGABDIAN KEPADA MASYARAKAT
INSTITUT TEKNOLOGI SEPULUH NOPEMBER
SURABAYA
Daftar Isi
Daftar Isi ... i
Daftar Tabel ... ii
Daftar Gambar ... iii
Daftar Lampiran ... iv
BAB I RINGKASAN ... 2
BAB II HASIL PENELITIAN ... 3
BAB III STATUS LUARAN ... 7
BAB IV PERAN MITRA (UntukPenelitian Kerjasama Antar Perguruan Tinggi) ... 8
BAB V KENDALA PELAKSANAAN PENELITIAN ... 9
BAB VI RENCANA TAHAPAN SELANJUTNYA ... 10
BAB VII DAFTAR PUSTAKA ... 28
BAB VIII LAMPIRAN ... 34
Daftar Tabel
Tabel 2.1 Kriteria kualitas incoming coreDaftar Gambar
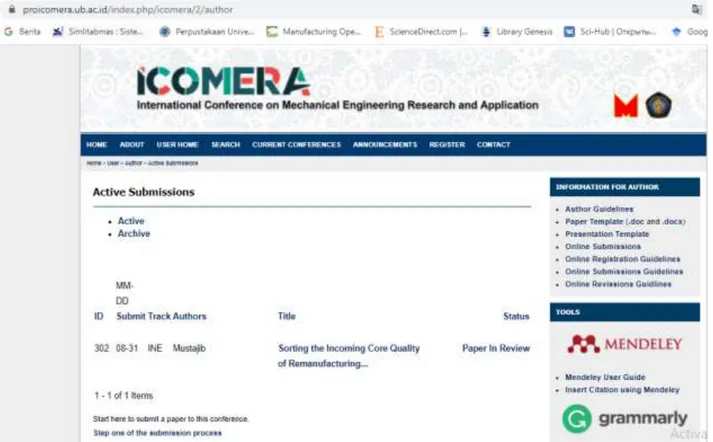
Gambar 3.1 Status manuskrip seminar internasionalDaftar Lampiran
BAB I RINGKASAN
Remanufaktur merupakan salah satu strategi recovery produk yang sangat penting untuk mengembalikan fungsi-fungsi produk yang telah berada pada fase end of life menjadi produk dengan satus useful life, sehingga kualitasnya dapat disetarakan dengan produk baru. Praktik remanufaktur tidak hanya dapat memberikan manfaat bagi perusahaan, tetapi juga bagi konsumen, dan lingkungan sekitar. Bagi perusahaan remanufaktur, proses yang dilakukan dapat membantu mengurangi penggunaan virgin material dan konsumsi energi. Oleh sebab itu, praktek remanufaktur dapat mengurangi biaya dan dapat meningkatkan profit bagi perusahaan. Sementara itu, dari sisi lingkungan praktek remanufaktur juga dapat mengurangi polusi dan emisi. Adapun dari sudut pandang konsumen, produk remanufaktur mampu diperoleh dengan harga yang terjangkau. Meskipun demikian, bagi sebagian konsumen kualitas produk remanufaktur masih dipandang rendah, dan tidak sama dengan produk baru. Hal ini disebabkan input material produk remanufaktur berasal dari produk bekas yang level kualitasnya diasumsikan lebih rendah dari material baru atau virgin material.
Input dari proses remanufaktur adalah produk bekas atau core, yang diterima pada aktifitas akuisisi core. Kualitas incoming core yang diterima oleh sistem remanufaktur kondisinya cenderung bervariasi karena faktor penggunaan produk selama di tangan konsumen. Selain itu, faktor teknologi produk dan kondisi fisik produk itu sendiri juga ikut berpengaruh. Ketiga faktor tersebut menjadi penyebab ketidakkpastian kualitas core yang menjadikan sistem remanufaktur perlu melakukan pengendalian kualitas pada saat aktifitas akuisi core
Sorting dan grading merupakan pengendalian kualitas pada level operasional remanufaktur
yang merupakan solusi langsung sehingg dapat memitigasi adanya ketidakpastian kualitas
incoming core. Meskipun telah banyak penelitian yang membahas tentang pengendalian
kualitas pada aktifitas akuisi core, tetapi ukuran performansi yang diusulkan untuk mengklasifikasikan kulitas incoming core lebih banyak berorientasi pada single criteria, yaitu aspek ekonomi. Adapun kriteria-kriteria kualitas untuk penerimaan incoming core belum diperhatikan. Karena kriteria ekonomi saja tidak selalu cocok untuk diterapkan pada produk yang komplek.
Berdasarkan research gap di atas, maka penelitian ini mengusulkan pengendalian kualitas pada aktifitas akuisi core diusulkan dengan membangun model multi criteria sorting problem pada tahapan akuisisi core dengan memperhatikan kondisi teknologi, fisik, dan penggunaan.
Ringkasan penelitian berisi latar belakang penelitian,tujuan dan tahapan metode penelitian, luaran yang ditargetkan, kata kunci
BAB II HASIL PENELITIAN
Saat ini ada banyak metodologi yang tersedia yang telah dikembangkan dari berbagai disiplin ilmu penelitian untuk menangani masalah klasifikasi dan sortir, diantaranya adalah untuk penyelidikan sistem yang tidak pasti: matematika fuzzy, teori sistem abu-abu, probabilitas, dan statistik. Banyak studi terbaru (misalnya Golinska et al., 2015; Xin, 2016) telah menunjukkan bahwa metode yang didasarkan pada grey system theory yang sangat berguna untuk masalah klasifikasi dalam keadaan operasi remanufaktur saat ini dalam kondisi ketidakpastian, mengingat klasifikasi abu-abu sedang kompleksitas dalam perhitungan. Grey
clustering adalah metode yang dikembangkan yang dapat didefinisikan sebagai cabang grey system theory yang berkaitan dengan pengklasifikasian indeks pengamatan atau objek
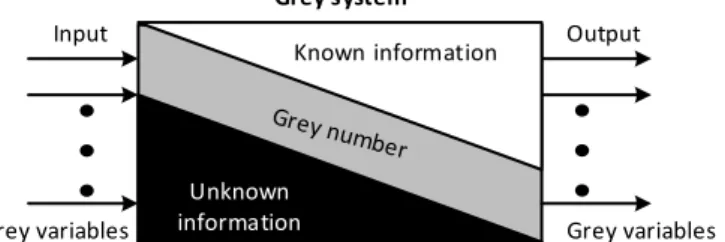
pengamatan ke dalam kelas yang dapat ditentukan menggunakan grey indeks matrix atau fungsi kemungkinan abu-abu (Liu et al., 2016). Agar lebih memahami hubungan sistem tidak pasti dan sistem abu-abu, Altintas et al. (2020) menjelaskan bahwa suatu sistem disebut "abu-abu" jika memiliki informasi yang tidak lengkap dan tidak pasti, sedangkan sistem "putih" memiliki semua informasi dan sistem "hitam" tidak memiliki data seperti yang dapat dilihat pada gambar 3. Metode ini adalah sangat berguna dalam mempelajari masalah ketidakpastian kumpulan data kecil dan informasi yang tidak lengkap yang sulit ditangani dengan pendekatan probabilitas dan matematika fuzzy (Liu et al., 2016).
Model grey clustering bertindak sebagai sistem yang mengubah masukan menjadi keluaran. Input berisi objek dan sistem indeks kualitas, sedangkan outputnya adalah kelas kualitas dari inti yang masuk. Secara umum, kelas mutu adalah kumpulan informasi tentang sifat kualitatif dari objek yang dievaluasi, yang memungkinkan identifikasi kriteria dan identifikasi hasil yang diperoleh (Kosacka et al., 2015).
Studi kasus yang diidentifikasi pada peneltian ini adalah perusahaan remanufaktur Indonesia untuk suku cadang alat berat, misalnya: silinder hidrolik. Dalam praktek bisnisnya, banyak perusahaan remanufaktur telah melakukan recovery silinder hidrolik bekas untuk komponen alat berat (suspensi depan, suspensi belakang, dan silinder hoist) untuk alat berat pertambangan dan konstruksi.
Untuk memberikan kriteria kualitas produk bekas, Mustajib et al. (2019) telah menetapkan kriteria kualitas untuk pemilahan core yang masuk berdasarkan: kondisi teknologi,
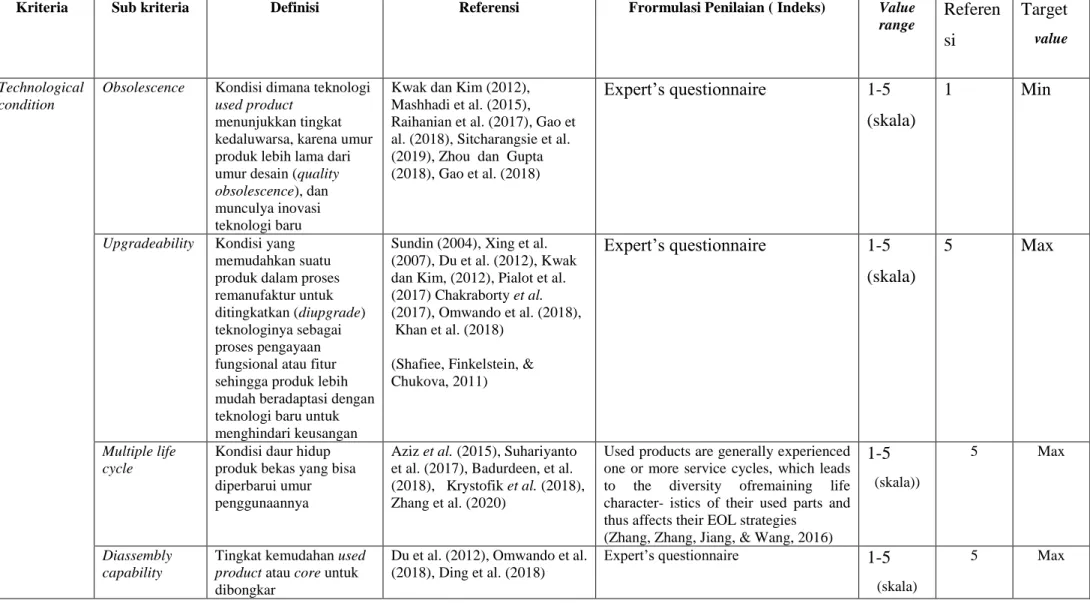
fisik, dan penggunaan. Mari kita perhatikan, jika ada delapan (I = 8) inti silinder bekas yang diakuisisi oleh pabrikan ulang, dan perlu diklasifikasikan berdasarkan kriteria tersebut yang kemudian dikembangkan menjadi 11 subkriteria (J = 11). Selain itu, silinder hidrolik diurutkan menjadi tiga kelas grey yang berbeda (K = 3), yaitu: buruk, sedang, dan terbaik. Klasifikasi untuk inti ke dalam kelas abu-abu ke-k berdasarkan nilai pengamatan inti ke-i yang dinilai terhadap kriteria ke diindeks oleh xij. Adapaun nilai xij. Dapat diperoleh dari table 2.1 berikut ini.
Tabel 2.1 Kriteria kualitas incoming core
Kriteria Sub kriteria Definisi Referensi Frormulasi Penilaian ( Indeks) Value
range Referen si Target value Technological condition
Obsolescence Kondisi dimana teknologi used product
menunjukkan tingkat kedaluwarsa, karena umur produk lebih lama dari umur desain (quality obsolescence), dan munculya inovasi teknologi baru
Kwak dan Kim (2012), Mashhadi et al. (2015), Raihanian et al. (2017), Gao et al. (2018), Sitcharangsie et al. (2019), Zhou dan Gupta (2018), Gao et al. (2018)
Expert’s questionnaire 1-5 (skala)
1 Min
Upgradeability Kondisi yang memudahkan suatu produk dalam proses remanufaktur untuk ditingkatkan (diupgrade) teknologinya sebagai proses pengayaan fungsional atau fitur sehingga produk lebih mudah beradaptasi dengan teknologi baru untuk menghindari keusangan
Sundin (2004), Xing et al. (2007), Du et al. (2012), Kwak dan Kim, (2012), Pialot et al. (2017) Chakraborty et al. (2017), Omwando et al. (2018), Khan et al. (2018)
(Shafiee, Finkelstein, & Chukova, 2011) Expert’s questionnaire 1-5 (skala) 5 Max Multiple life cycle
Kondisi daur hidup produk bekas yang bisa diperbarui umur penggunaannya
Aziz et al. (2015), Suhariyanto et al. (2017), Badurdeen, et al. (2018), Krystofik et al. (2018), Zhang et al. (2020)
Used products are generally experienced one or more service cycles, which leads to the diversity ofremaining life character- istics of their used parts and thus affects their EOL strategies
(Zhang, Zhang, Jiang, & Wang, 2016)
1-5
(skala))
5 Max
Diassembly capability
Tingkat kemudahan used product atau core untuk dibongkar
Du et al. (2012), Omwando et al. (2018), Ding et al. (2018)
Expert’s questionnaire 1-5
(skala)
Physical condition
Damage level Tingkatan yang
mengindikasaikan adanya cacat atau kerusakan secara fisik. Misalnya: retak, korosi, aus
Seliger et al. (2006), Wang et al. (2017), Gao et al. (2018), Jiang et al. (2019b) 𝑁𝑢𝑚𝑏𝑒𝑟 𝑜𝑓𝑑𝑎𝑚𝑎𝑔𝑒𝑠 𝑇𝑜𝑡𝑎𝑙 𝑛𝑢𝑚𝑏𝑒𝑟 𝑜𝑓 𝑎𝑙𝑙𝑜𝑤𝑎𝑏𝑙𝑒 𝑑𝑎𝑚𝑎𝑔𝑒𝑠 × 100% 0-100 (%) 0% Min Completeness of components Tingkat kelengkapan komponen-komponen yang menjadi bagin integral produk bekas
(Kosacka, 2018) 𝑁𝑢𝑚𝑏𝑒𝑟 𝑜𝑓𝑎𝑣𝑎𝑖𝑙𝑎𝑏𝑙𝑒 𝑐𝑜𝑚𝑝𝑜𝑛𝑒𝑛𝑡𝑠 𝑇𝑜𝑡𝑎𝑙 𝑛𝑢𝑚𝑏𝑒𝑟 𝑜𝑓 𝑐𝑜𝑚𝑝𝑜𝑛𝑒𝑛𝑡𝑠 × 100% 0-100 (%) 0% Max Traceability of identitiy Kemudahan penulusuran infomasi variasi produk yang memungkinkan pengenalan model atau jenis menjad ilebih mudah. Misalnya nomor pabrikan sebagai nomor identifikasi.
Xia et al. (2015), (Kosacka,
2018) 1-5 (skala) 5 Max Dimensional & geometric tolerance Batas penyimpangan dimensi atau geoetri yang dijinkan pada core
Zhou et al. (2012), Liu et al. (2013), Ge et al. (2014) Liu (2016), Liu et al. (2016), Yang et al. (2016), Expert’s questionnaire 0-100 (%) 0% Min Usage condition Frequency of use Frekuensi pemakaian produk pada saat fase penggunaan
Gavidel dan Rickli (2017), Diallo et al. (2017), 𝑁𝑢𝑚𝑏𝑒𝑟 𝑜𝑓 𝑒𝑥𝑒𝑐𝑢𝑡𝑒𝑑 𝑢𝑠𝑒𝑠 𝑖𝑛 𝑝𝑒𝑟𝑖𝑜𝑑 𝑡 𝑇𝑜𝑡𝑎𝑙 𝑛𝑢𝑚𝑏𝑒𝑟 𝑜𝑓 𝑝𝑙𝑎𝑛𝑛𝑒𝑑 𝑢𝑠𝑒𝑠 𝑖𝑛 𝑝𝑒𝑟𝑖𝑜𝑑𝑒 𝑡 × 100% 0-100 (%) 0% Min Remaining useful life
Sisa umur pakai Hu et al. (2014), Zhang et al. (2016), Jiang et al. (2019b) (Meng, Lou, Peng, & Prybutok, 2017) Expert’s questionnaire, or 𝑅𝑈𝐿 = 𝑚𝑒𝑎𝑛 𝑢𝑠𝑒𝑓𝑢𝑙 𝑙𝑖𝑓𝑒(𝑇𝑚) − 𝑎𝑐𝑡𝑢𝑎𝑙 𝑢𝑠𝑒𝑓𝑢𝑙 𝑙𝑖𝑓𝑒 𝑜𝑓 𝑝𝑎𝑟𝑡𝑠 0-100 (%) 100% Max Maintenance history
Histori perawatan Diallo et al. (2017) 𝑁𝑢𝑚𝑏𝑒𝑟 𝑜𝑓 𝑒𝑥𝑒𝑐𝑢𝑡𝑒𝑑 𝑚𝑎𝑖𝑛𝑡𝑒𝑛𝑎𝑛𝑐𝑒 𝑖𝑛 𝑝𝑒𝑟𝑖𝑜𝑑 𝑡 𝑇𝑜𝑡𝑎𝑙 𝑛𝑢𝑚𝑏𝑒𝑟 𝑜𝑓 𝑝𝑙𝑎𝑛𝑛𝑒𝑑 𝑚𝑎𝑖𝑛𝑡𝑒𝑛𝑎𝑛𝑐𝑒 𝑖𝑛 𝑝𝑒𝑟𝑖𝑜𝑑𝑒 𝑡 × 100%
0-100 (%)
BAB III STATUS LUARAN
Status Luaran berisi status tercapainya luaran untuk kemajuan penelitian saat ini adalah manuskrip yang dikirim ke International Conference on Mechanical Engineering Research and Application (iCOMERA) http://icomera.teknik.ub.ac.id/ dengan status “paper in review” seperti yang terlihat pada gambar di bawah ini.
BAB IV PERAN MITRA
BAB V KENDALA PELAKSANAAN PENELITIAN
Kendala penelitian ini adalah proses pengambilan data yang melibatkan kuisoner yang melibatkan pendapat pakar (expert) dari perusahaan remanufaktur alat berat guna melakukan penilaian (assessment) kriteria-kriteria yang telah dirancang pada belum bisa didapatkan saat ini karena adanya masih physical distancing maupun social distancing adanya Pandemi COVID 19.BAB VI RENCANA TAHAPAN SELANJUTNYA
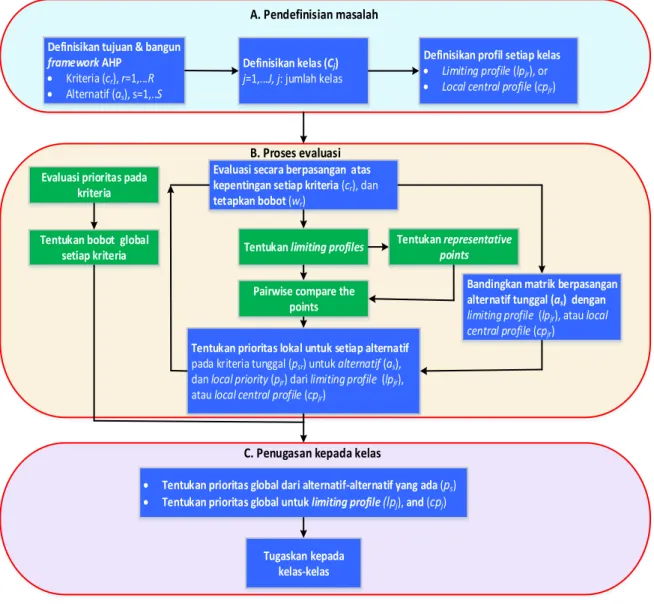
Rencana tahapan selanjutnya penyelesaian penelitian untuk mencapai luaran yang dijanjikan. Pengembangan model pengambilan keputusan untuk penyortiran kualitas incoming core menggunakan AHPSort dengan langkah-langkah ditunjukkan pada Gambar berikut ini.Definisikan tujuan & bangun framework AHP
Kriteria (cr), r=1,...R
Alternatif (as), s=1,..S
Definisikan kelas (Cj)
j=1,...J, j: jumlah kelas
Definisikan profil setiap kelas
Limiting profile (lpjr), or
Local central profile (cpjr)
Evaluasi secara berpasangan atas kepentingan setiap kriteria (cr), dan
tetapkan bobot (wr)
Tentukan limiting profiles
Pairwise compare the points
Tentukan prioritas lokal untuk setiap alternatif
pada kriteria tunggal (psr) untuk alternatif (as), dan local priority (pjr) dari limiting profile (lpjr), atau local central profile (cpjr)
Evaluasi prioritas pada kriteria
Tentukan bobot global setiap kriteria
Tentukan representative points
Bandingkan matrik berpasangan alternatif tunggal (as) dengan
limiting profile (lpjr), atau local
central profile (cpjr)
Tentukan prioritas global dari alternatif-alternatif yang ada (ps)
Tentukan prioritas global untuk limiting profile (lpj), and (cpj)
Tugaskan kepada kelas-kelas
A. Pendefinisian masalah
B. Proses evaluasi
C. Penugasan kepada kelas
Gambar 6.1 Konseptual model AHPSort untuk klasifikasi kualitas incoming core
Pada Gambar 6.1 diperlihatkan bahwa penyortiran kualitas incoming core menggunakan AHPSort dimulai dengan menetapkan kriteria (c) sejumlah R (𝑐1, ⋯ , 𝑐𝑟, ⋯ 𝑐𝑅) dengan alternatif core (a) sebanyak S (𝑎1, ⋯ , 𝑎𝑠, ⋯ , 𝑎𝑆). Selanjutnya, ditetapkan kelas (C) sebanyak J
misalnya dapat digolongkan menjadi tiga, yaitu: C1 untuk alternatif core dengan kualitas yang terbaik, C2 untuk alternatif core yang memiliki kualitas sedang, C3 untuk alternatif core yang memiliki kualitas rendah. Hal ini dapat dilakukan dengan menetapkan sebuah pembatas yang disebut sebagai limiting profile (lp) atau central profile (cp) pada setiap kriteria untuk setiap kelas ke j.
A Multi-Criteria Quality Sorting Model Based on AHP Grey Clustering for
Incoming Core Grading in Remanufacturing System
Mohamad Imron Mustajib1,2, Udisubakti Ciptomulyono3, Nani Kurniati4 1 Department of Industrial and Systems Engineering, Institut Teknologi Sepuluh Nopember. Surabaya, Jawa Timur 60111, Indonesia
Email: 1[email protected], 3[email protected], 4[email protected]
2 Department of Industrial and Mechanical Engineering, Universitas Trunojoyo Madura. Bangkalan, Jawa Timur 69162, Indonesia
Abstracts
Remanufacturing is the backbone of the circular economy, which helps in salvaging the used products by extending its life cycle to be as good as new products. Cores acquisition in remanufacturing is challenging for remanufacturers due to uncertain quality, time, and volume of returns. Therefore, quality sorting plays an important role in core acquisition for remanufacturing systems to mitigate the quality uncertainty of incoming core as an immediate solution. In this paper, we present the usefulness of grey systems for handling quality uncertainty information for sorting incoming core in the remanufacturing system. Grey systems are a powerful method to handle uncertainty with small data. For this reason, we propose a multi-criteria quality sorting model base on the Analytical Hierarchy
Process (AHP) is coupled with grey clustering using possibility functions. The quality criteria for sorting the incoming core according to the technological, physical, and usage conditions. To provide the
practical contribution of this research, a case study of the quality sorting problem in heavy equipment remanufacturer was presented.
Keywords:core acquisition, quality uncertainty, grading, multi-criteria, grey decision making
1. Introduction
In the new global economy, circular economy has become a central issue for current international concern. Many studies by researchers and policymakers in recent years have
focused on the circular economy as a possible solution to pursue
the global issue of sustainable development goals. There are multiple definitions of a circular
economy. In general terms, the circular economy can be viewed as a closed-loop industrial
system that has activities for reducing, reusing, and recycling resources usage for sustainability
achievement.
Remanufacturing is the backbone of the circular economy, which helps in salvaging the used products by extending its life cycle to be as good as new products. Three main activities in the remanufacturing system are cores acquisition, remanufacturing operations,
remanufacturing in closed-loop supply chains characterized by uncertain quality, time, and volume of returns. The term uncertainty is generally understood to mean lack or incompleteness of information, known only incompletely, or imprecisely. This uncertainty leads to economic (cost, feasibility) and technical (remanufacturability, scheduling, process planning) risks for remanufacturing companies. Therefore, these uncertainties need to be
handled technically by mitigations for desired performance.
Quality is an essential element for the performance evaluation of used products, which is a key driver in remanufacturing decisions. The quality of incoming cores has a significant effect on the remanufacturing cost and cost of quality. In order to return the used products into a good functional state, best quality cores need limited reconditioning (thus entail lower process costs), whereas worst quality cores will need comprehensive processes or replacement of parts (Diallo et al. 2017). Therefore, sorting and quality grading play a major part in core acquisition for remanufacturing systems to handle the quality uncertainty of incoming core. The sorting operation in core acquisition is vital for two important reasons. First, to identify physical, usage, and technological conditions of incoming cores are sorted under their quality level before the remanufacturing processes. Two, this operation is an immediate solution to mitigate the quality uncertainty condition in the core acquisition (Li et al. 2016; Mashhadi and Behdad, 2017).
Sorting can broadly be defined as the case where a set of alternatives are grouped in an ordinal manner according to the absolute evaluation, beginning with those that include the most preferred alternatives to those that include the least preferred alternatives (Zopounidis and Doumpos, 2002). Quality sorting in the remanufacturing system plays an important role to grade the cores according to their different conditions to plan the process and the cost of remanufacturing required. Cores with similar quality grades can be remanufactured in dedicated processes so that the time and cost can be handled efficiently. Quality classification and sorting policies are urgent and direct solutions that are used in remanufacturing systems to handle this source of variability in incoming products (Mashhadi and Behdad, 2017). Complete information is needed in order to decide the quality level of incoming cores. Unfortunately, when the cores are sorted into different quality grades, the uncertain conditions of the incoming core makes it difficult to estimate the associated quality level and the process planning stage becomes difficult.
Recent evidence suggests that fast sorting in long term quality control can be accomplished by installing information and communication technology, an automatic sorting system using radio frequency identification (RFID), sensors, bar codes, and other technologies to automate product monitoring and testing that can maintain valuable usage data to assess remanufacturing feasibility (Loomba & Nakashima, 2012). For instance, in order to record operating hours and speed, Bosch integrates chips into electric motor power tools (Gavidel and Rickli, 2017). After that, they evaluate tool quality and sorts them into two classes; remanufacturable or non-remanufacturable. Unfortunately, these methods do not always
guarantee usefulness for many remanufacturers. These technologies are only useful for the remanufacturers who originally manufactured or have control over the product design and wish to use such these to invest in long-term payback periods only if they are economically feasible.
Alternatives approaches are necessary to solve the problem of quality sorting for remanufacturing as short term quality control. In this case quality uncertainty refers to the information in which conditions of the incoming core are not known precisely. Several methods currently exist to deal with uncertainty. A well-known example of these methods is the probability for randomness behavior is based on density function and fuzzy sets for fuzziness problem according to membership function for ambiguity. However, the probability statistic approach requires large sample data to determine its probability density function. On the other hand, the fuzzy mathematic method depends on experience and cognitive aspects to develop a fuzzy membership function.
The quality sorting problem of incoming core can be subjective or objective uncertain depends on the facts. For example, the classification of physical condition based on damage level on cores by labor visual inspection is subjective, as it can change from inspector to inspector. In contrast, the classification of cores according to their usage condition according to the frequency of use is objective. As a result, there remains a need for an efficient method that can handle quality uncertainty with small data in the sorting problem of the incoming core for remanufacturing
In 1982, the theory of grey systems was first proposed by Professor Julong Deng from
Huazhong University of Science and Technology, as a model for limited and incomplete data (Yang et al. 2019). Grey system theory has been widely used in various fields.This paper set out to investigate the usefulness of grey systems for handling quality uncertainty information for sorting incoming core in the remanufacturing system.The concern of grey systems theory is about the uncertainty issues of limited data or missing information that is difficult to address
with possibility theory. In grey systems, grey sets employ the basic concept of grey numbers
and deal with the characteristic function values of a set as grey numbers. A grey number is a number that has clear upper and lower limits but which has an unknown location within the limits. Moreover, grey clustering is a method that may be defined as the branch of grey system theory (GST) which is concerned with the Classification of observation indices or observation objects into definable groups using grey incidence matrices or grey possibility functions (Liu et al. 2016). Grey clustering evaluation models using possibility functions have been extensively studied for uncertain systems analysis.Many recent studies (Golinska et al, 2015, Xin, 2016) have shown that a method based on a grey clustering decision was helpful for classification problems in the current state of remanufacturing operations under uncertain conditions because grey classification is moderate complexity in the computations.
The rest of this paper is structured as follows. Section 2 below describes the sorting methodology by using grey clustering and the analytical hierarchy process (AHP) approach. The problem of quality sorting of incoming core in heavy equipment remanufacturer is discussed in the case study of section 3. presented, conclusions are in section 4.
2. Methodology
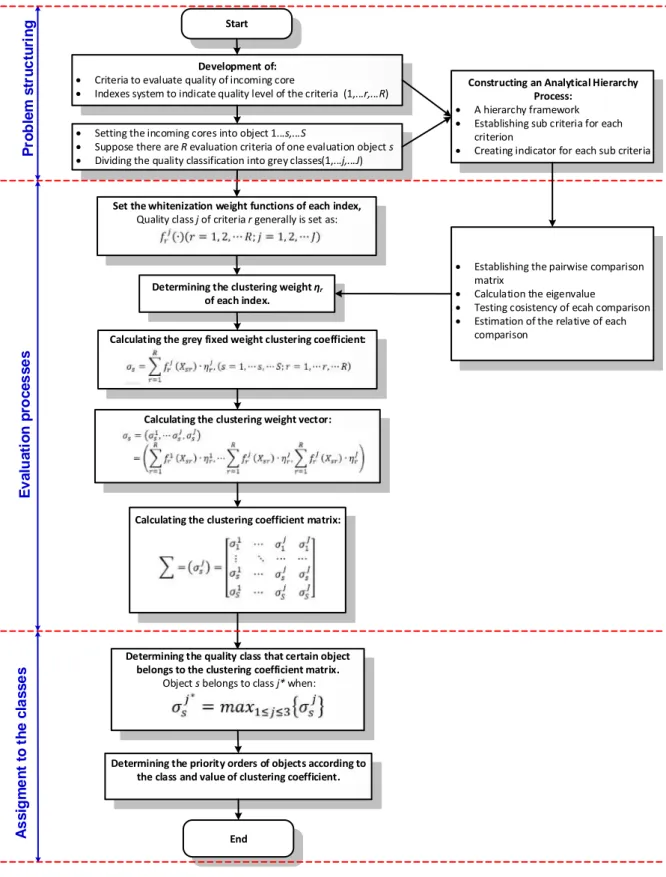
The multi-criteria decision-making problem for sorting problems on the incoming core was faced with conditions of quality uncertainty, which can be tackled by combining grey clustering and the AHP approach. The development of a multi-criteria quality sorting model based on AHP grey clustering for incoming core in the remanufacturing system is illustrated by the diagram in figure 1. In general, the quality sorting model based on AHP grey clustering is divided into three stages; problem structuring, evaluation process, and assignment to classes.
The problem structuring focus on the effective structuring of the problem situation in sorting by defining a set of criteria to evaluate the quality of incoming core, setting core alternatives, and dividing the quality of incoming cores into several classes. To classify the quality of incoming cores, there are J quality classes, and we refer to the quality class j as a subscript to differentiate between the different qualities of cores, j= 1, 2,..., J. The smaller the
j, the better the quality class of the core. The quality level of the cores in the same quality class
is almost the same in the remanufacturing process need. Overall, the decision model can be described in Figure 1 as follows
Development of: Criteria to evaluate quality of incoming core
Indexes system to indicate quality level of the criteria (1,...r,...R)
Setting the incoming cores into object 1...s,...S
Suppose there are R evaluation criteria of one evaluation object s
Dividing the quality classification into grey classes(1,...j,...J)
Determining the priority orders of objects according to the class and value of clustering coefficient.
End Start
Determining the clustering weight ηr
of each index.
Set the whitenization weight functions of each index,
Quality class j of criteria r generally is set as:
Calculating the clustering weight vector:
Calculating the clustering coefficient matrix:
Determining the quality class that certain object belongs to the clustering coefficient matrix.
Object s belongs to class j* when:
Calculating the grey fixed weight clustering coefficient:
P ro b le m s tr u c tu ri n g E v a lu a ti o n p ro c e s s e s A s s ig m e n t to t h e c la s s e s
Constructing an Analytical Hierarchy Process:
A hierarchy framework
Establishing sub criteria for each criterion
Creating indicator for each sub criteria
Establishing the pairwise comparison matrix
Calculation the eigenvalue
Testing cosistency of ecah comparison
Estimation of the relative of each comparison
Figure 1. Flow diagram of the AHP grey cluster model for sorting problem
3. Case Study
Many researchers (Zhou et al., 2012; Xu et al. 2018; Saidani et al., 2020) have utilized a case study of heavy-duty equipment remanufacturing to show the practical contribution of their research. The following emergent case study was identified from the
Indonesian remanufacturer company for heavy equipment parts, for instance: hydraulic cylinder (see figure 2). In business practice, many remanufacturing companies have recovered the used hydraulic cylinder for heavy equipment components (front suspension, rear suspension, and hoist cylinders) for mining and construction heavy equipment.
Figure 2. Remanufactured hydraulic cylinder (Source: http://www.komi.co.id)
Although the eight dimensions of quality for new products have been successfully proposed by Garvin (1987), these dimensions cannot always be recognized to evaluate the quality level of used products. This is because the used products have entered the end of life phase so they cannot perform their main functionality. Therefore, there remains a need for compatible quality criteria with used products. In order to provide the quality criteria for the used product in remanufacturing, Mustajib et al. (2019) have established that the quality criteria for sorting the incoming core based on: technological, physical, and usage conditions.
Technological Condition
Quality sorting of incoming cores based on conditions Physical Condition Level 1 Goal/objective Level 2 Criteria (cr) Usage Condition Frequency of use
Obsolescence Damage level
Multiple lifecycles Remaining useful Life
Upgradability Completeness of components Dimensional and geometrical tolerance Maintenance history Level 3 Sub Criteria (cro) Level 4 Set of decision Alternatives (as) Core 1 (a1) Core s (as) Core S (aS) Traceablity of identity Disassemblability
. . .
. . .
. . .
Figure 3. Hierarchy of decision levels for incoming core quality sorting problem The indicators of sub-criteria in Figure 3 can be calculated in a simplified way based on the expertise of decision-makers, in the absence of detailed data for estimation, as seen in Tables 1 and 2. Furthermore, the sub-criteria for each criterion is defined as follows:
Obsolescence
An Obsolescence happens when products are "out of use" or "out of date” (Rai and Terpenny, 2007). Rapid innovations and technology developments have led a significant to shorten the life cycle of products to be obsolescence. A product is technical or functional obsolescence as customers are more interested in new products with better quality performance as a result of new technology. To assess
the grades for the technical obsolescence, Gao et al. (2018) proposed five criteria to guide a qualitative evaluation of used products.
Upgradability
An upgrade is a technical mitigation to handle the uncertain quality of used products. Meanwhile, the term upgradeability is used here refer to the level of potential of used products to be upgraded efficiently and effectively to keep its admissible on the market. Upgradeability represents the relative technological ease or viability of fostering continuous system renewal and enhancement at the level of engineering characteristics, part level, and level of the overall system. Remanufacturing with component upgrades may be an efficient alternative to used product obsolescence. In addition, an upgrade action in remanufacturing will improve the reliability of the used product.
Multiple lifecycles
The principle of multiple lifecycles products is a key technique in product development for remanufacturing. Since it is one of the strategies for prolonging the product lifecycle after the end of life. Durable products are more effective for multiple lifecycles. To assess the average number of lives times a component, Geyer et al. (2003) have proposed a quantitative approach by dividing the average component life by average product use.
Disassemblability
Disassembly is characterized as a complete assembly being dismantled down to its individual parts. Meanwhile, disassemblability can be loosely described as a level of ease with which a used product could be disassembled. The principles of ease for disassemblability are disassembly without force and by simple mechanism (Mok et al., 1997), due to disassembly is a labor-intensive task. For this reason, Xing et al. (2007) dan Gao et al. (2018) used five criteria to give a qualitative assessment of for disassemblability. Meanwhile, Nof et al. (1997) recommended a guideline for easy disassembly. On contrary, Ali (2017) has suggested that comprehensive methods to quantitatively evaluate the disassemblability based on product design, process technology, and incoming quality assessment.
Damage level
Used products may have degraded features with different degrees of damage. This indicator is typically calculated by fault features such as corrosions, cracks, wear, and so on. The damage level can be quantified and classified according to the size of the damage (Wang et al. 2017; Jiang et al. 2019)
Components completeness
Completeness is defined by Yoe (2019) as all the necessary parts are accounted for and included in the option. It is means the incoming core should not be broken down into constituent parts and should be delivered entirely without missing parts. In case of any uncertainty as to the completeness of the incoming core, an extended inspection is carried out to verify the inner structure of the used product (Golinska-dawson, 2018).
Traceability of identity
Product identification and traceability are essential for the quality acceptance of used products. The core should have an original equipment manufacturer's identification number (e.g. manufacturer stickers) because of the wide variety of products, allowing the model, type, parameters to be recognized (Golinska-dawson, 2018). The availability of a used product’s identity such as text, readable labels, and barcodes that do not missing or fading over the use phase of life’s product allows easy recognition for quality sorting.
Dimensional and geometrical tolerance
The term dimensional tolerance is generally understood to mean minimum and maximum values allowable of dimension for the parts to works properly. Meanwhile, geometric tolerance is a significant assessment factor that depends on the consistency of the parts of used products. Being classified, the sorted parts of used products will be reprocessed based on the quality loss degree according to an allowable tolerance. If the used products have the highest deformation from ideal dimension and shape (exceeding the acceptable tolerance), it can not be reconditioned to its original performance by remanufacturing they are then recycled (Liao et al., 2019)
Frequency of use
Usage condition is influenced by the user’s behavior during the use phase of a product. During the middle of life, a product's performance deteriorates with the frequency of use and operations. This is evident in the case of quality of used parts in heavy equipment is evaluated based on hours of operation.
Remaining useful life
Being used for a period of time, the remaining life of a used part can be defined as the lifetime of residual operation that can be predicted. To assess the degree of the remaining life of the used product can be categorized into several levels according to the minimum and maximum values of the remaining useful life values obtained (Jiang et al., 2019).
Maintenance history
Maintenance has characterized a set of actions taken to allow the product to work at predetermined levels during the use phase of a product. Proper maintenance strategy will extend its original life of a product, then makes it compatible with remanufacturing (Go et al., 2015). Due to the potentially lower reliability of the
used products requires an appropriate maintenance strategy. Moreover, Stadnicka
et al. (2014) have proposed a set of criteria to carry out the classification of equipment maintenance based on the failure frequency (amount of failure registry entries each year).
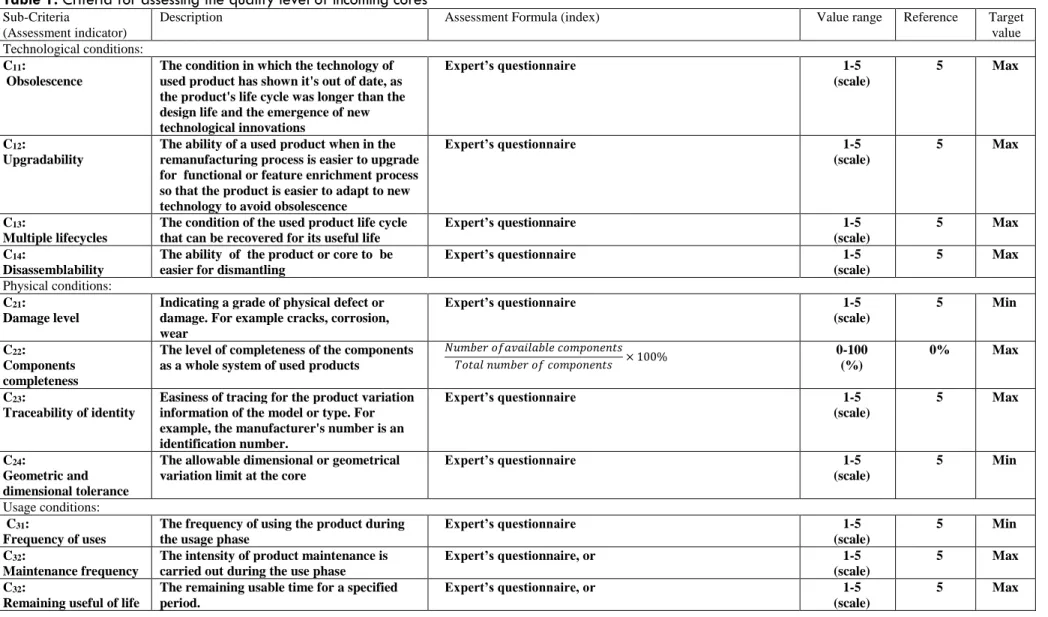
Table 1. Criteria for assessing the quality level of incoming cores
Sub-Criteria
(Assessment indicator)
Description Assessment Formula (index) Value range Reference Target
value Technological conditions:
C11:
Obsolescence
The condition in which the technology of used product has shown it's out of date, as the product's life cycle was longer than the design life and the emergence of new technological innovations Expert’s questionnaire 1-5 (scale) 5 Max C12: Upgradability
The ability of a used product when in the remanufacturing process is easier to upgrade for functional or feature enrichment process so that the product is easier to adapt to new technology to avoid obsolescence
Expert’s questionnaire 1-5
(scale)
5 Max
C13:
Multiple lifecycles
The condition of the used product life cycle that can be recovered for its useful life
Expert’s questionnaire 1-5
(scale)
5 Max
C14:
Disassemblability
The ability of the product or core to be easier for dismantling
Expert’s questionnaire 1-5 (scale) 5 Max Physical conditions: C21: Damage level
Indicating a grade of physical defect or damage. For example cracks, corrosion, wear Expert’s questionnaire 1-5 (scale) 5 Min C22: Components completeness
The level of completeness of the components as a whole system of used products
𝑁𝑢𝑚𝑏𝑒𝑟 𝑜𝑓𝑎𝑣𝑎𝑖𝑙𝑎𝑏𝑙𝑒 𝑐𝑜𝑚𝑝𝑜𝑛𝑒𝑛𝑡𝑠 𝑇𝑜𝑡𝑎𝑙 𝑛𝑢𝑚𝑏𝑒𝑟 𝑜𝑓 𝑐𝑜𝑚𝑝𝑜𝑛𝑒𝑛𝑡𝑠 × 100% 0-100 (%) 0% Max C23: Traceability of identity
Easiness of tracing for the product variation information of the model or type. For example, the manufacturer's number is an identification number. Expert’s questionnaire 1-5 (scale) 5 Max C24: Geometric and dimensional tolerance
The allowable dimensional or geometrical variation limit at the core
Expert’s questionnaire 1-5 (scale) 5 Min Usage conditions: C31: Frequency of uses
The frequency of using the product during the usage phase
Expert’s questionnaire 1-5
(scale)
5 Min
C32:
Maintenance frequency
The intensity of product maintenance is carried out during the use phase
Expert’s questionnaire, or 1-5
(scale)
5 Max
C32:
Remaining useful of life
The remaining usable time for a specified period.
Expert’s questionnaire, or 1-5
(scale)
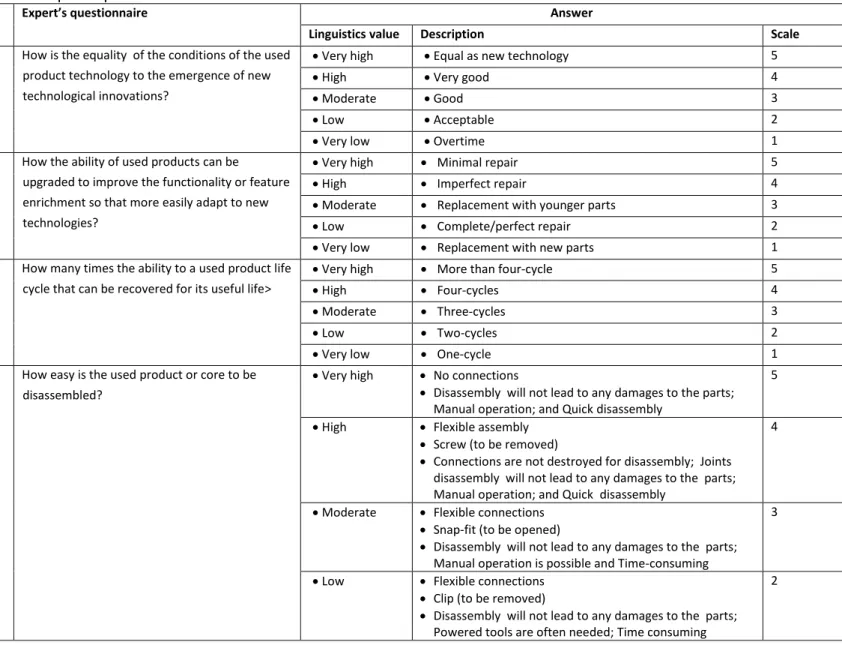
Table 2. Example of an expert’s questionnaire
Sub Criteria Expert’s questionnaire Answer
Linguistics value Description Scale
c11: Obsolescence How is the equality of the conditions of the used
product technology to the emergence of new technological innovations?
Very high Equal as new technology 5
High Very good 4
Moderate Good 3
Low Acceptable 2
Very low Overtime 1
c12: Upgradability How the ability of used products can be
upgraded to improve the functionality or feature enrichment so that more easily adapt to new technologies?
Very high Minimal repair 5
High Imperfect repair 4
Moderate Replacement with younger parts 3
Low Complete/perfect repair 2
Very low Replacement with new parts 1
c13:
Multiple lifecycles
How many times the ability to a used product life cycle that can be recovered for its useful life>
Very high More than four-cycle 5
High Four-cycles 4
Moderate Three-cycles 3
Low Two-cycles 2
Very low One-cycle 1
c14:
Disassemblability
How easy is the used product or core to be disassembled?
Very high No connections
Disassembly will not lead to any damages to the parts; Manual operation; and Quick disassembly
5
High Flexible assembly Screw (to be removed)
Connections are not destroyed for disassembly; Joints disassembly will not lead to any damages to the parts; Manual operation; and Quick disassembly
4
Moderate Flexible connections Snap-fit (to be opened)
Disassembly will not lead to any damages to the parts; Manual operation is possible and Time-consuming
3
Low Flexible connections Clip (to be removed)
Disassembly will not lead to any damages to the parts; Powered tools are often needed; Time consuming
Very low Permanent connection (to be broken)
Disassembly will lead to damages to the parts; Large powered tools are required, and Time-consuming
1
c21:
Damage level
What is the volume of damage? Very high 𝑥 ≥ 4𝑚𝑚3 5
High 3𝑚𝑚3≤ 𝑥 < 4𝑚𝑚3 4 Moderate 2𝑚𝑚3≤ 𝑥 < 3𝑚𝑚3 3 Low 1𝑚𝑚3≤ 𝑥 < 2𝑚𝑚3 2 Very low 0 < 𝑥 < 1𝑚𝑚3 1 c24: Geometric and dimensional tolerance
How is tolerance deformation from ideal shape and dimension?
Very high Highest deformation from ideal dimension and shape (exceeding the acceptable tolerance)
5 High Higher deformation from ideal shape and
dimension (still acceptable tolerance)
4 Moderate Moderate deformation from ideal shape and
dimension (still acceptable tolerance)
3 Low Lower deformation from ideal shape and dimension
(still acceptable tolerance)
2 Very low No deformation from ideal shape and dimension 1 C32:
Maintenance history
How many failures frequency (number of entries in the shutdown register per year)
Very high 5
High 4
Moderate Approximately 24–47 times
(i.e. on average 1–4 failures per month)
3 Low Approximately 12–23 times
(i.e. on average 1–4 failures per month)
2 Very low Approximately 0–11 times
(i.e. on average 1–4 failures per month)
1 C33:
Remaining useful of life
How long is the remaining useful life (RUL) of the incoming core, which is calculated from the end of the period of use to the end of the useful life?
Very high More than four years 5
High Four years 4
Moderate Three years 3
Low Two years 2
Let us consider, there were eight (𝑆 = 8) the incoming core of used hydraulic cylinder which was acquired by the remanufacturer, and they needed to be classified according to these criteria which are then expanded into 11 sub-criteria (𝑅 = 11). Moreover, the hydraulic cylinder is sorted out into three distinctive grey classes(𝐽 = 3), namely: best, middle, and worst quality. The classification for the sth core into the jth grey class according to the observed value of the sth core judged against the rth criterion is indexed by xsr
Table 4. Matrix for pairwise comparisons for criteria
𝑐1 𝑐2 𝑐3 Weight (Wr)
𝑐1 1 5 3 0.62
𝑐2 1/5 1 3 0.24
𝑐3 1/3 1/3 1 0,14
Table 5. Matrix for pairwise comparison for sub criteria of technological conditions 𝑐11 𝑐12 𝑐13 𝑐14 Weight (𝑤̃𝑟𝑜) 𝑐11 1 1/5 1/9 3 0.10 𝑐12 5 1 1/7 1/7 0.13 𝑐13 9 7 1 9 0.62 𝑐14 1/3 7 1/9 1 0.16
Table 6. Matrix for pairwise comparison for sub criteria of physical condition 𝑐21 𝑐22 𝑐23 𝑐24 Weight (𝑤̃𝑟𝑜) 𝑐21 1 1/3 5 5 0.34 𝑐22 3 1 1/3 5 0.32 𝑐23 1/5 3 1 5 0.29 𝑐24 1/5 1/5 1/5 1 0.05
Table 7. Matrix for pairwise comparison for sub criteria of usage condition
𝑐31 𝑐32 𝑐33 Weight (𝑤̃𝑟𝑜)
𝑐31 1 1 3 0.39
𝑐32 1 1 7 0.51
𝑐33 1/3 1/7 1 0.1
In summary, then we can get global weight for each sub-criteria 𝑐𝑟𝑜 can be
obtained
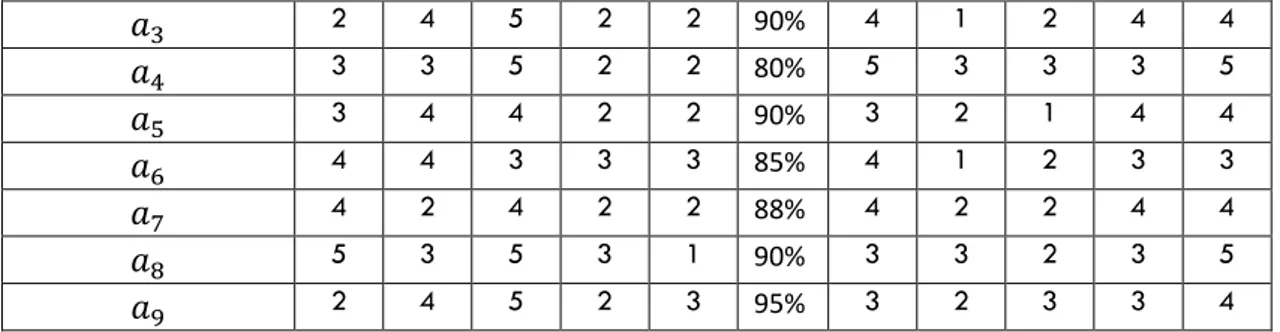
Table 3. The observed value of each criterion on each incoming core s (Xsr)
Core alternative (as)
Sub criteria (𝑐𝑟𝑜) and global weights
𝑐11 𝑐12 𝑐13 𝑐14 𝑐21 𝑐22 𝑐23 𝑐24 𝑐31 𝑐32 𝑐33
0.06 0.08 0.38 0.10 0.08 0.08 0.07 0.01 0.05 0.07 0.01
𝑎1 3 3 4 2 2 80% 3 2 3 4 4
𝑎3 2 4 5 2 2 90% 4 1 2 4 4 𝑎4 3 3 5 2 2 80% 5 3 3 3 5 𝑎5 3 4 4 2 2 90% 3 2 1 4 4 𝑎6 4 4 3 3 3 85% 4 1 2 3 3 𝑎7 4 2 4 2 2 88% 4 2 2 4 4 𝑎8 5 3 5 3 1 90% 3 3 2 3 5 𝑎9 2 4 5 2 3 95% 3 2 3 3 4
Assessment indicators are used to measure the quality condition level of a core. In order to evaluate these indicators, we need to establish an evaluation index system used to control and measure uniformity. The index developed in these indicators are presented in Table 1. But, due to the high uncertainty in the core conditions, sometimes it is very hard to determine the technical index quantitatively for each criterion as its complexity and difficulty; thus, it can only be measured qualitatively by expert assessment as can be seen in table 1. Furthermore, to assess the qualitative indicators, the expert’s questionnaire in Table 2 was used. Thus, the values for the lower, middle, and best classes can be obtained by applying the whitenization weight function (figure 5) as proposed by formula 1 until 9 as follows.
1 1 1
0 X 0 X 0 X
Xrj(1) Xrj(2) Xrj(1) Xrj(2) Xrj(4) Xrj(3) Xrj(4)
B. Best of quality class C. Middle of quality class D. Lower of quality class 1 0 X Xr j (1) Xrj(2) Xr j (4) A. Typical whitenization function
frj ( ) Xr j (3) frj ( ) f r j ( ) fr j ( )
Figure 5. The whitenization weight function For example the criterion 𝑐22, the whitenization weight function is given as:
𝑓𝑟1(𝑋𝑟𝑠) = { 0, 𝑋 < 0 % 𝑋 85, 0% ≤ 𝑋 < 85% 1, 85% ≤ 𝑋 ≤ 100% (1) 𝑓𝑟2(𝑋𝑟𝑠) = { 0, 𝑋 < 0 𝑋 77.5, 0 ≤ 𝑋 ≤ 77.5% 100 − 𝑋 22.5 77.5% < 𝑋 ≤ 100% 0, 𝑋 > 100% (2)
𝑓𝑟3(𝑋𝑟𝑠) = { 0, 𝑋 < 0 1, 0 ≤ 𝑋 ≤ 66% 100 − 𝑋 34 66 < 𝑋 ≤ 100% 0, 𝑋 > 100% (3)
Meanwhile, the criteria with r 𝑐11, 𝑐12,𝑐13, 𝑐14, 𝑐21, 𝑐24 𝑐32, 𝑐33,the whitenization weight
function are expressed with: 𝑓𝑟1(𝑋𝑟𝑠) = { 0, 𝑋 < 0 𝑋 5, 0 ≤ 𝑋 < 5 1, 𝑋 ≥ 5 (4) 𝑓𝑟2(𝑋𝑟𝑠) = { 0, 𝑋 < 0 𝑋 2.5, 0 ≤ 𝑋 ≤ 5 5 − 𝑋 2.5 2.5 < 𝑋 ≤ 5 0, 𝑋 > 5 (5) 𝑓𝑟3(𝑋𝑟𝑠) = { 0, 𝑋 < 0 1, 0 ≤ 𝑋 ≤ 2.5 5 − 𝑋 2.5 2.5 < 𝑋 ≤ 5 0, 𝑋 > 5 (6)
Moreover, the criteria with r 𝑐21, 𝑐24 𝑐31, 𝑡he whitenization weight function are expressed
with: 𝑓𝑟1(𝑋𝑟𝑠) = { 0, 𝑋 < 0 5 − 𝑋 5 , 0 ≤ 𝑋 < 5 1, 𝑋 ≥ 5 (7) 𝑓𝑟2(𝑋𝑟𝑠) = { 0, 𝑋 < 0 𝑋 2.5, 0 ≤ 𝑋 ≤ 2.5 5 − 𝑋 2.5 2.5 < 𝑋 ≤ 5 0, 𝑋 > 5 (8) 𝑓𝑟3(𝑋𝑟𝑠) = { 0, 𝑋 < 0 1, 0 ≤ 𝑋 ≤ 2.5 𝑋 5 2.5 ≤ 𝑋 ≤ 5 0, 𝑋 > 5 (9)
Table 4. The value of the gray fixed weight cluster coefficient for each class (𝜎𝑠𝑗)
𝑎𝑠 𝜎𝑠𝑗
= ∑ 𝑓𝑟𝑗
𝑅 𝑟=1
(𝑋𝑟) ∙ 𝜂𝑟
Maximum coefficient value Grey Class
𝑗 = 1 𝑗 = 2 𝑗 = 3 𝜎 𝑠 𝑗∗ = 𝑚𝑎𝑥1≤𝑗≤3{𝜎𝑠𝑗} 𝑎1 0.428 0.372 0.2 0.428 𝑗∗=1 𝑎2 0.250 0,453 0,297 0,453 𝑗∗=2 𝑎3 0,275 0,125 0,6 0,6 𝑗∗= 3 𝑎4 0,313 0.436 0.251 0.436 𝑗∗=2 𝑎5 0,153 0,521 0.326 0,521 𝑗∗=2
𝑎6 0,368 0,220 0,412 0,412 𝑗∗=3
𝑎7 0,212 0,290 0,498 0,498 𝑗∗=3
𝑎8 0.406 0,344 0,250 0.406 𝑗∗=1
𝑎9 0.360 0,50 0,14 0,50 𝑗∗=2
It is apparent from this table 4 that alternative
𝑎1, 𝑎8 are classified tot class 1. Meanwhile core alternative a2, a4, a5, a9 are classified to class 2, and
the remaining are classified to class 3. This research has been success conducted to assess the importance of the quality level in used products. The most interesting finding was that the assessment formula can be obtained quantitatively and qualitatively. Another important finding was that the grey quality class of the incoming core can be achieved by applying the cluster model.
4. Conclusion
This study set out to propose a multi-criteria quality sorting model base on the Analytical Hierarchy
Process (AHP) is coupled with grey clustering using possibility functions. The quality criteria for sorting the incoming core according to the technological, physical, and usage conditions. The research has
also shown thatthe practical contribution of this research, a case study of the quality sorting problem
in heavy equipment remanufacturer
5. Acknowledgments
The authors would like to thanks DRPM Institut Teknologi Sepuluh Nopember for the funding Postgraduate Research Grant of the year 2020 Dissertation Doctoral Research Grant, No. Contract: 930/PKS/ITS/2020
References
Ali, A. (2017). Product Disassemblability and Remanufacturability Assessment: A Quantitative
Approach. University of Kentucky.
Diallo, C., Venkatadri, U., Khatab, A., & Bhakthavatchalam, S. (2017). State of the art review of quality, reliability and maintenance issues in closed-loop supply chains with remanufacturing.
International Journal of Production Research, 55(5), 1277–1296.
http://doi.org/10.1080/00207543.2016.1200152
Gao, Y., Feng, Y., Wang, Q., Zheng, H., & Tan, J. (2018). A multi-objective decision making approach for dealing with uncertainty in EOL product recovery. Journal of Cleaner Production, 204, 712– 725. http://doi.org/10.1016/j.jclepro.2018.09.080
Gavidel, S. Z., & Rickli, J. L. (2017). Quality assessment of used-products under uncertain age and usage conditions. International Journal of Production Research, 55(23), 7153–7167.
http://doi.org/10.1080/00207543.2017.1349954
Geyer, R., & Van Wassenhove, L. N. (2003). Working Paper Series Remanufacturing Products with
Limited Component Durability and Finite Life Cycles.
sustainability : the way forward. Journal of Cleaner Production, 95, 16–29. Golinska-dawson, P. (2018). Sustainability in Remanufacturing Operations.
http://doi.org/10.1007/978-3-319-60355-1
Golinska, P., Kosacka, M., Mierzwiak, R., & Werner-Lewandowska, K. (2015). Grey Decision Making as a tool for the classification of the sustainability level of remanufacturing companies. Journal of
Cleaner Production, 105, 28–40. http://doi.org/10.1016/j.jclepro.2014.11.040
Jiang, Z., Wang, H., Zhang, H., Mendis, G., & Sutherland, J. W. (2019). Value recovery options portfolio optimization for remanufacturing end of life product. Journal of Cleaner Production,
210, 419–431. http://doi.org/10.1016/j.jclepro.2018.10.316
Li, X., Li, Y., & Cai, X. (2016). On Core Sorting in RMTS and RMTO Systems: A Newsvendor Framework.
Decision Sciences, 47(1), 60–93. http://doi.org/10.1111/deci.12152
Liao, H., Shi, Y., Liu, X., Shen, N., & Deng, Q. (2019). A non-probabilistic model of carbon footprints in remanufacture under multiple uncertainties. Journal of Cleaner Production, 211, 1127–1140. http://doi.org/10.1016/j.jclepro.2018.11.218
Liu, S., Yang, Y., & Forrest, J. (2016). Grey Data Analysis: Methos, Model and Applications. Singapore: Springer-Verlag.
Loomba, A. P. S., & Nakashima, K. (2012). Enhancing value in reverse supply chains by sorting before product recovery. Production Planning and Control, 23(2–3), 205–215.
http://doi.org/10.1080/09537287.2011.591652
Mashhadi, A. R., & Behdad, S. (2017). Optimal sorting policies in remanufacturing systems: Application of product life-cycle data in quality grading and end-of-use recovery. Journal of
Manufacturing Systems, 43, 15–24. http://doi.org/10.1016/j.jmsy.2017.02.006
Mok, H. S., Kim, H. J., & Moon, K. S. (1997). Disassemblability of Mechanical Parts in Automobile for Recycling. Computers & Industrial Engineering, 33(3–4), 621–624.
Mustajib, M. I., Ciptomulyono, U., & Kurniati, N. (2019). Determining Factors of Quality Uncertainty and Its Control Analysis in Remanufacturing System. International Journal of Applied Science
Engineering, 16(1), 35–45. http://doi.org/10.6703/IJASE.201906
Nof, S. Y., Whilem, W. E., & Warnecke, H.-J. (1997). Industrial Assembly (1st ed.). London: Springer Science & Business Media. http://doi.org/10.1007/978-1-4615-6393-8
Rai, R., & Terpenny, J. (2007). PRINCIPLES FOR MANAGING TECHNOLOGICAL PRODUCT
OBSOLESCENCE. In NTERNATIONAL CONFERENCE ON ENGINEERING DESIGN, (pp. 1–12). France. Saidani, M., Yannou, B., Leroy, Y., & Cluzel, F. (2020). Resources , Conservation & Recycling
Dismantling , remanufacturing and recovering heavy vehicles in a circular economy — Technico-economic and organisational lessons learnt from an industrial pilot study. Resources,
Conservation & Recycling, 156(January), 104684.
http://doi.org/10.1016/j.resconrec.2020.104684
Stadnicka, D., Antosz, K., & Ratnayake, R. M. C. (2014). Development of an empirical formula for machine classification : Prioritization of maintenance tasks. Safety Science, 63, 34–41. http://doi.org/10.1016/j.ssci.2013.10.020
method for remanufacturing process planning optimization. Journal of Cleaner Production, 161, 708–719. http://doi.org/10.1016/j.jclepro.2017.05.178
Xin, J. (2016). Evaluation of auto parts remanufacturing by grey cluster model. Grey Systems: Theory
and Applications, 6(3), 296–308. http://doi.org/10.1108/GS-08-2016-0022
Xing, K., Belusko, M., Luong, L., & Abhary, K. (2007). An evaluation model of product upgradeability for remanufacture. International Journal of Advanced Manufacturing Technology, 35(1–2), 1– 14. http://doi.org/10.1007/s00170-006-0698-9
Xu, F., Liu, X., Chen, W., Zhou, C., & Cao, B. (2018). An Ontology and AHP Based Quality Evaluation Approach for Reuse Parts of End-of-Life Construction Machinery. Mathematical Problems in
Engineering, 2018.
Yang, Y., Liu, S., & Xie, N. (2019). Uncertainty and grey data analytics data analytics. Marine
Economics and Managment, 2(2), 73–86. http://doi.org/10.1108/MAEM-08-2019-0006
Yoe, C. (2019). Principles of Risk Analysis: Decision Making Under Uncertainty (2nd ed.). Boca Raton, NY, Florida: CRC Press.
Zhou, J., Huang, P., Zhu, Y., & Deng, J. (2012). A quality evaluation model of reuse parts and its management system development for end-of-life wheel loaders. Journal of Cleaner Production,
35, 239–249. http://doi.org/10.1016/j.jclepro.2012.05.037
Zopounidis, C., & Doumpos, M. (2002). Multicriteria classification and sorting methods : A literature review. European Journal of Operational Research, 138, 229–246.
BAB VII DAFTAR PUSTAKA
Altintas, K., Vayvay, O., & Apak, S. (2020). An Extended GRA Method Integrated with Fuzzy AHP to Construct a Multidimensional Index for Ranking Overall Energy Sustainability Performances. Sustainability, 12(1602), 3–21.
Aziz, N. A., Wahab, D. A., Ramli, R., & Azhari, C. H. (2015). Modelling and optimisation of upgradability in the design of multiple life cycle products : a critical review. Journal of
Cleaner Production, 112, 282–290. http://doi.org/10.1016/j.jclepro.2015.08.076
Badurdeen, F., Aydin, R., & Brown, A. (2018). A multiple lifecycle-based approach to sustainable productconfiguration design.pdf. Journal Of Cleaner Production, 200, 756– 769.
Behdad, S., & Thurston, D. (2011). A Markov Chain Model to Maximize Revenue by
Varying Refurbished Product Upgrade Levels. Volume 9: 23rd International Conference
on Design Theory and Methodology; 16th Design for Manufacturing and the Life Cycle Conference, 951–959. http://doi.org/10.1115/DETC2011-47879
Chakraborty, K., Mondal, S., & Mukherjee, K. (2017). Analysis of product design
characteristics for remanufacturing using Fuzzy AHP and Axiomatic Design. Journal of
Diallo, C., Venkatadri, U., Khatab, A., & Bhakthavatchalam, S. (2017). State of the art review of quality, reliability and maintenance issues in closed-loop supply chains with
remanufacturing. International Journal of Production Research, 55(5), 1277–1296. http://doi.org/10.1080/00207543.2016.1200152
Ding, Z., Jiang, Z., Zhang, H., Cai, W., & Liu, Y. (2018). An integrated decision-making method for selecting machine tool guideways considering remanufacturability.
International Journal of Computer Integrated Manufacturing, 00(00), 1–12.
http://doi.org/10.1080/0951192X.2018.1550680
Doumpos, M., & Zopounidis, C. (2004). Multicriteria Decision Aid Classification Methods. (P. M. Pardalos & D. Hearn, Eds.) (1st ed.). New: Kluwers Academic Publishers. Du, Y., Cao, H., Liu, F., Li, C., & Chen, X. (2012). An integrated method for evaluating the
remanufacturability of used machine tool. Journal of Cleaner Production, 20(1), 82–91. http://doi.org/10.1016/j.jclepro.2011.08.016
Gao, Y., Feng, Y., Wang, Q., Zheng, H., & Tan, J. (2018). A multi-objective decision making approach for dealing with uncertainty in EOL product recovery. Journal of Cleaner
Production, 204, 712–725. http://doi.org/10.1016/j.jclepro.2018.09.080
Gavidel, S. Z., & Rickli, J. L. (2017). Quality assessment of used-products under uncertain age and usage conditions. International Journal of Production Research, 55(23), 7153– 7167. http://doi.org/10.1080/00207543.2017.1349954
Ge, M., Liu, C., & Liu, M. (2014). The online quality control methods for the assembling of remanufactured engines’ cylinder block and cover under uncertainty. International
Journal of Advanced Manufacturing Technology, 74(1–4), 225–233.
http://doi.org/10.1007/s00170-014-5971-8
Golinska, P., Kosacka, M., Mierzwiak, R., & Werner-Lewandowska, K. (2015). Grey Decision Making as a tool for the classification of the sustainability level of remanufacturing companies. Journal of Cleaner Production, 105, 28–40. http://doi.org/10.1016/j.jclepro.2014.11.040
Guide, V. D. R., & Wassenhove, L. N. (2001). Managing Product Returns for Remanufacturing. Production and Operations Management, 10(2), 142–155. http://doi.org/10.1111/j.1937-5956.2001.tb00075.x
Gutowski, T. G., Sahni, S., Boustani, A., & Graves, S. C. (2011). Remanufacturing and energy savings. Environmental Science and Technology, 45(10), 4540–4547. http://doi.org/10.1021/es102598b
Hu, Y., Liu, S., Lu, H., & Zhang, H. (2014). Remaining useful life assessment and its application in the decision for remanufacturing. Procedia CIRP, 15, 212–217. http://doi.org/10.1016/j.procir.2014.06.052
Ilgın, M. A., & Gupta, S. M. (2012). Remanufacturing modeling and analysis-CRC Press
(2012).pdf (1st ed.). London: CRC Press.
Jiang, Z., Wang, H., Zhang, H., Mendis, G., & Sutherland, J. W. (2019). Value recovery options portfolio optimization for remanufacturing end of life product. Journal of
Jiang, Z., Zhou, T., Zhang, H., Wang, Y., Cao, H., & Tian, G. (2016). Reliability and cost optimization for remanufacturing process planning. Journal of Cleaner Production, 135, 1602–1610. http://doi.org/10.1016/j.jclepro.2015.11.037
Khan, M. A., Mittal, S., West, S., & Wuest, T. (2018). Review on upgradability – A product lifetime extension strategy in the context of product service systems. Journal of Cleaner
Production, 204, 1154–1168. http://doi.org/10.1016/j.jclepro.2018.08.329
Kosacka, M. (2018). Sustainability in Remanufacturing Operations. In K. F. Golinska-Dawson P. (Ed.), Sustainability in Remanufacturing Operations (pp. 25–45). London: Springer, Cham. http://doi.org/10.1007/978-3-319-60355-1
Kosacka, M., Mierzwiak, R., & Golinska-Dawson, P. (2015). Sustainability Classification for SMEs—A Guidance of Sustainability Assessment with the Use of Averaged Traits Quality Method. In V. Kachitvichyanukul, P. Golinska-Dawson, & K. Sethanan (Eds.),
Toward Sustainable Operations of Supply Chain and Logistics Systems (1st ed., pp. 141–
152). Springer International Publishing AG. Retrieved from http://www.springer.com/series/10152
Krystofik, M., Luccitti, A., Parnell, K., & Thurston, M. (2018). Adaptive remanufacturing for multiple lifecycles: A case study in office furniture. Resources, Conservation and
Recycling, 135(July), 14–23. http://doi.org/10.1016/j.resconrec.2017.07.028
Kwak, M., & Kim, H. (2012). Market Positioning of Remanufactured Products With Optimal Planning for Part Upgrades. Journal of Mechanical Design, 135(1), 011007.
http://doi.org/10.1115/1.4023000
Li, G., Yamaguchi, D., & Nagai, M. (2007). A grey-based decision-making approach to the supplier selection problem. Mathematical and Computer Modelling, 46, 573–581. http://doi.org/10.1016/j.mcm.2006.11.021
Liu, C. (2016). Tolerance Redistributing of the Reassembly Dimensional Chain on Measure of Uncertainty. Entropy, 18(10), 48. http://doi.org/10.3390/e18100348
Liu, M., Liu, C., & Xing, L. (2013). Study on a tolerance grading allocation method under uncertainty and quality oriented for remanufactured parts. International Journal of
Advanced Manufacturing Technology, 87(5–8), 1265–1272.
http://doi.org/10.1007/s00170-013-4826-z
Liu, M., Liu, C., Xing, L., Mei, F., & Zhang, X. (2016). Study on a tolerance grading allocation method under uncertainty and quality oriented for remanufactured parts.
International Journal of Advanced Manufacturing Technology, 87(5–8), 1265–1272.
http://doi.org/10.1007/s00170-013-4826-z
Liu, S., Yang, Y., & Forrest, J. (2016). Grey Data Analysis: Methos, Model and Applications. Singapore: Springer-Verlag.
Mashhadi, A. R., & Behdad, S. (2017). Optimal sorting policies in remanufacturing systems: Application of product life-cycle data in quality grading and end-of-use recovery.
Journal of Manufacturing Systems, 43, 15–24. http://doi.org/10.1016/j.jmsy.2017.02.006
Mashhadi, A. R., Esmaeilian, B., & Behdad, S. (2015). Uncertainty Management in Remanufacturing Decisions: A Consideration of Uncertainties in Market Demand,
Quantity, and Quality of Returns. ASCE-ASME Journal of Risk and Uncertainty in
Engineering Systems Part B: Mechanical Engineerin, 1(4 Suppl 1), 129–132.
http://doi.org/10.1115/1.4029759
Meng, K., Lou, P., Peng, X., & Prybutok, V. (2017). Quality-driven recovery decisions for used components in reverse logistics. International Journal of Production Research,
55(16), 4712–4728. http://doi.org/10.1080/00207543.2017.1287971
Mustajib, M. I., Ciptomulyono, U., & Kurniati, N. (2019). Determining Factors of Quality Uncertainty and Its Control Analysis in Remanufacturing System. International Journal
of Applied Science Engineering, 16(1), 35–45. http://doi.org/10.6703/IJASE.201906
Mustajib, M. I., Kurniati, N., & Ciptomulyono, U. (2017). Remanufacturing Quality Control Strategies : A Literature Review and Proposed Conceptual Framework. In The 18th Asia
Pasific Industrial Engineering and Management System Conference (APIEMS) (pp.
C5-12-C5-18). Yogyakarta.
Omwando, T. A., Otieno, W. A., Farahani, S., & Ross, A. D. (2018). A Bi-Level fuzzy analytical decision support tool for assessing product remanufacturability. Journal of
Cleaner Production, 174, 1534–1549. http://doi.org/10.1016/j.jclepro.2017.11.050
Pialot, O., Millet, D., & Bisiaux, J. (2017). “Upgradable PSS”: Clarifying a new concept of sustainable consumption/production based on upgradablility. Journal of Cleaner
Production, 141, 538–550. http://doi.org/10.1016/j.jclepro.2016.08.161
Rausand, M., & Haugen, S. (2020). Risk Assessment: Theory, Methods, and Application (2nd ed.). New Jersey: John Wiley & Sons, Inc.
Rizova, M. I., Wong, T. C., & Ijomah, W. (2020). A systematic review of decision-making in remanufacturing. Computers & Industrial Engineering, 106681.
http://doi.org/10.1016/j.cie.2020.106681
Seliger, G., Kernbaum, S., & Zettl, M. (2006). Remanufacturing Approaches Contributing to Sustainable Engineering. Gestão & Produção, 13(3), 367–384.
Shafiee, M., Finkelstein, M., & Chukova, S. (2011). On optimal upgrade level for used products under given cost structures. Reliability Engineering and System Safety, 96(2), 286–291. http://doi.org/10.1016/j.ress.2010.07.008
Simatupang, T. M. (2012). Penerapan sistem rantai pasok konstruksi dalam kerangka sistem logistik nasional. Retrieved August 11, 2020, from
https://www.slideshare.net/togar/sistem-rantai-pasok-konstruksi-sislognas-samarinda Simatupang, T. M. (2013). Logistics and Supply Chain in Indonesia : Emerging Practices (1st
ed.). Bandung: School of Busisness and Managment, Institut Teknologi Bandung. Sitcharangsie, S., Ijomah, W., & Wong, T. C. (2019). Decision makings in key
remanufacturing activities to optimise remanufacturing outcomes: a review. Journal of
Cleaner Production. http://doi.org/10.1016/j.jclepro.2019.05.204
Suhariyanto, T. T., Wahab, D. A., & Rahman, M. N. A. (2017). Multi-Life Cycle Assessment for sustainable products: A systematic review. Journal of Cleaner Production, 165, 677– 696. http://doi.org/10.1016/j.jclepro.2017.07.123