STEREO DERIVED CLOUD TOP HEIGHT CLIMATOLOGY OVER GREENLAND
FROM 20 YEARS OF THE ALONG TRACK SCANNING RADIOMETER (ATSR)
INSTRUMENTS
D. Fisher a, * and J-P. Muller a
a Mullard Space Science Laboratory, University College London, Holmbury St. Mary, Dorking, Surrey, U.K., RH5 6NT
KEY WORDS: Climate, Environment, Atmosphere, Imagery, Matching, Pattern, Stereoscopic
ABSTRACT:
Current algorithms for the determination of cloud top height and cloud fraction in Polar Regions tend to provide unreliable results,
particularly in the presence of isothermal conditions within the atmosphere. Alternative methods to determine cloud top heights in such regions effectively, from space borne sensors, are currently limited to stereo-photogrammetry and active sensing methods, such as LiDAR. Here we apply the modified census transform to one month of AATSR stereo data from June 2008. AATSR is unique in that it is the only space borne stereo capable instrument providing data continuously in both the visible, near infrared and thermal channels. This allows for year round imaging of the poles and therefore year round cloud top height and cloud fraction estimation. We attempt a preliminary validation of the stereo retrieved cloud top height measurements from AATSR against collocated cloud height measurements from the CALIOP LiDAR instrument. CALIOP provides an excellent validation tool due to its excellent height resolution of between 30-60 meters. In this validation, a pair of collocated swaths is assessed with a total of 154 inter-comparisons; the results show that AATSR correlates well with CALIOP cloud base layers with an R2 score of 0.71. However, in all cases AATSR appears to be underestimating the cloud top height compared to CALIOP, the causes for this are currently not fully understood and more extensive inter-comparisons are required. Once validation is completed a processing chain is in place to process the entire ATSR time-series data generating a 20 year cloud top height dataset for Greenland.
* Corresponding author: [email protected]
1. INTRODUCTION
The current predominant algorithms for the determination of cloud top height from space-borne sensors rely upon absolute radiance measurements and knowledge of well-defined thermal profiles. Such techniques include the use of the infrared window technique (Rossow et al,. 1989) and CO2 slicing (Frey et al., 1999). It is well known that these methods perform poorly where thermal gradients do not exist (Schweiger and Key, 1992). Such isothermal conditions often occur in the lower troposphere during polar summer (Karlsson and Dybbroe, 2010) or when thermal inversions are present and the land surface is colder than the overlying clouds. Therefore in Polar Regions, when using the aforementioned algorithms, cloud top height (CTH) assignment and cloud fraction (CF) estimation is unreliable.
The relationship between CTH and CF and the net radiation balance in Polar Regions is complex. Over fresh snow with a high albedo, increasing cloud cover leads an increase in the net radiation balance (Ambach, 1974). Whilst over melting snow or clean ice, with a lower albedo, increased cloud fraction leads to a decrease in the net radiation balance, with a marked dependence on the cloud type (Cawkwell and Bamber, 2002). These effects are significant as they may lead to forcing of the ice-albedo feedback mechanism, which is the attributed cause of increased warming at higher latitudes in comparison to the global mean in most climate models. Indeed, it has been shown that a ±5% change in cloud amount over Greenland is
equivalent to a 1˚K change in temperature (loc. cit.). Improved knowledge of both CTH and CF is vital to generate better understanding of the responses of Polar Regions to climate change.
Currently, effective and accurate CTH and CF estimation in polar regions at suitable spatial and temporal scales is still to be achieved. Datasets which can effectively resolve CTH and CF are available; however, their spatial and temporal sampling is a limiting factor. Such data sets include the Multi-angle Imaging SpectroRadiometer (MISR) instrument which uses the principles of stereo-photogrammetry to determine CTH to an accuracy of ~500m. However, MISR is limited to the visible spectrum so cannot provide year round coverage. Also able to effectively resolve CTH over Polar Regions to an accuracy of 30-60m (depending upon the clouds altitude) is the LiDAR type Cloud-Aerosol Lidar with Orthogonal Polarisation (CALIOP) instrument. CALIOP, due to the LiDAR technology involved can operate year-round, however it only provides very limited spatial sampling. Perhaps of more promise is the ATSR instrument series with its long time series of ~20 years, thermal channels to provide year round coverage and stereo capability to eliminate the reliance upon ancillary LUTs for height assignment. ATSR-2 data has already been successfully applied for the determination of CTH using stereo-photogrammetric methods over Greenland (Cawkwell et al., 2001. Here, we hope to demonstrate the potential of extending this dataset to provide coverage over the entirety of Greenland for the extraction of both CTH and CF for initially one month of AATSR data, with the ultimate aim extending this to the entire ATSR time series.
2. CLOUD TOP HEIGHT DETERMINATION
2.1 AATSR Instrument
The Along Track Scanning Radiometer (ATSR, Mutlow, 1998) instrument series began with ATSR launched on ERS-1 with the mission of measuring sea surface temperature. The ATSR instrument used four infrared channels (1.6, 3.7, 11 and 12um), blackbody calibration to ensure consistent on board calibration
to effectively detect sea surface temperature trends (its primary mission aim) throughout its mission and a dual view to correct
for
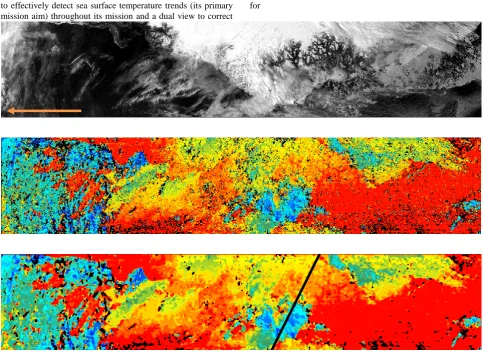
Figure 1 (a-c). The top image (Figure 1a.) is the 0.55um nadir view from AATSR orbit 33086 (28th June 2008). The image is of the Eastern coast of Greenland, the orange arrow represents the direction of motion. The middle image (Figure 1b.) is the raw CTH output from the Census stereo matching between the nadir and forward views, with red denoting the height at sea-level and blue and dark blue a value of around 8km. The bottom image (Figure 1c.) is the CTH after application of a 5x5 median filter. The black transect passing through the image is the path of the CALIOP overpass used for the validation.
atmospheric effects. Following on from ATSR were the ATSR-2 instrument launched onboard ERS-ATSR-2 in 1995 (with three additional visible bands at 0.55, 0.65 and 0.87um) and the AATSR instrument onboard Envisat in 2001 (with 12 bit radiometric resolution). The instrument employs conical
canning an ha t o vie one at na ir an one or ar at an
inci ence angle o , which allows the use of
photogrammetric techniques. The swath width is 512km and is resampled to give a nominal product resolution of 1km.
The potential for Stereoscopic CTH determination from the (A)ATSR(-2) instruments was first proposed prior to the launch of ATSR (Lorenz, 1985). With accurate knowledge of the (A)ATSR(-2) viewing geometry and a method to determine parallax, hereafter referred to as disparity, by matching of pixels in the along track direction between the two views, CTH can be retrieved. A technique for doing so was first implemented on ATSR imagery by Prata and Turner (1997), using a simple patch based correlation matching metric. A camera model described in the same paper was then applied to convert the parallax measurements into CTHs. More recently a far more sophisticated patch-based algorithm, referred to as M4 (Muller et al., 2007), with an improved (A)ATSR(-2) camera model
(Denis et al., 2007), has been developed.
2.2 M4
The M4 stereo matching algorithm was developed for extensive processing of ATSR-2 data for the EU-CloudMap (Muller and Fischer, 2007). With a shared heritage to the M2/M3 matchers applied to MISR (Muller et al., 2002, Moroney et al., 2002), M4 achieves significant performance gains over it predecessors through application of advanced image processing techniques. The matching metric applied in M4 is normalised cross correlation (NCC). NCC is an excellent metric as it can account for gain differences between images and is the optimal method for dealing with Gaussian noise typically present in imagery (Hisrchmuller et al., 2002). Therefore it is robust any changes in illumination caused by the different view angles and noise effects caused by the different resolutions of the ATSR images.
The effectiveness of NCC in providing effective disparity estimates deteriorates in the presence of depth discontinuities. A depth discontinuity is the change from one disparity population
to another, rom the Earth’ ur ace to a clou , or example.
These depth discontinuities typically present as intensity
changes within the imagery. The statistical measures (regional mean and standard deviation) used in the NCC algorithm assume the intensity values within the patch have a Gaussian distribution, at discontinuities this assumption may be invalidated due to the occurrence of multi-modal intensity distributions. This leads to erroneous disparity measurements at discontinuities. Here we implement a stereo matching algorithm based on the Census algorithm (Zabih and Woodfill, 1994) to achieve better results at depth discontinuities.
2.3 Census
The Census transform belongs to the group of patch based non-parametric transforms, including the Rank transform (Zabih and Woodfill, 1994) and Ordinal measures (Baht and Nayer, 1998). These transforms do not rely on the pixel values themselves; rather they encode the ordering of the pixel values. The Census transform in addition to encoding the ordering of the pixels also stores the spatial structure of the pixels within the patch. This is achieved through the definition of a bit string which encodes the relationship of a pixel of interest to those pixels within its local neighbourhood, defined by the patch size. Here, we apply the modified census transform (MCT, Froba, 2004), which
neighbourhood. Lastly,
denotes a concatenation operation, which generates the bit string.As non-parametric transforms depend solely on the ordering of the local intensities and not the magnitudes they are robust to all radiometric distortions that do not change the ordering. Further they are less susceptible to the effects of intensity variations at discontinuities (Zabih and Woodfill, 1994), leading to more accurate disparity estimations and less smoothing across discontinuities. For a detailed analysis of cost metrics see Hamming Weight. The raw output from MCT for a scene over Greenland is shown in Figure 1b.
3. VALIDATION
Validation is carried out against LiDAR cloud layer measurements at 5km spatial resolution obtain from the CALIOP instrument. For the month of June 2008 all AATSR
scenes over-passing Greenland processed using MCT and the CTHs were extracted using the Mannstien camera model (Denis et al., 2007). From this dataset a total of 6 AATSR orbits were found to have collocated CALIOP measurements within their swath, with at most two minutes between acquisitions. Here, we present an initial inter-comparison using one of these collocated datasets for stereo results derived from the 0.55um channels (the nadir image is show in Figure 1a).
The collocation methodology involves a number of steps: Firstly, a 5x5 pixel median filter is applied to the AATSR CTH result, this smoothes the AATSR data to a similar resolution to the CALIOP data (see Figure 1c). Secondly, the data are optical thickness, whereas CALIOP determines the cloud top to be where it first encounters a cloud signal. The matching CALIOP cloud layer from the column is the layer height which has the minimum distance from the AATSR CTH. Lastly outlier removal is performed on each collocated data set, with an outlier defined as any collocated measurement pair whose heights differ by more than two sigma from the mean height.
4. RESULTS
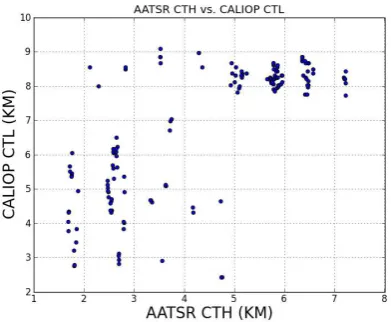
The two sets of inter-comparison results are presented here. In Figure 2, the inter-comparison between the AATSR CTH and CALIOP CTL are presented. A total of 154 inter-comparisons were made. The AATSR CTH measurements appear quantised in comparison to the CALIOP results, this is due to the pixel level accuracy of the AATSR measurements leading to ~1km groupings. In the CALIOP transect (shown in Figure 1c) there appear to be two main CTL groupings, one cloud feature at between 4-6km and another at 8-9km. The results in Figure 2 show that AATSR is generally underestimating CTH in comparison to the CALIOP CTL. The bias between the measurements confirms this at -2.45 km. The RMSE is 2.76 km and the coefficient of determination is 0.54.
Figure 2. This Figure presents the results of the inter-comparison between AATSR CTH and CALIOP CTL for the transect presented in Figure 1c.
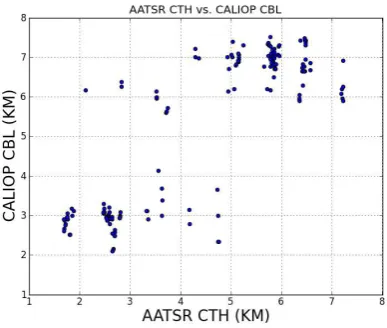
In Figure 3 the inter-comparison between the AATSR CTH and CALIOP CBL are presented. The same number of inter-comparisons were made. The CALIOP CBLs appear to show better agreement with the AATSR CTH measurements, though some under-estimation is still apparent. The bias between the measurements confirms this at -0.77 km. The RMSE is 1.36 km and the coefficient of determination is 0.71.
Figure 3. This Figure presents the results of the inter-comparison between AATSR CTH and CALIOP CBL for the transect presented in Figure 1c.
5. DISCUSSION
The inter-comparison of the AATSR CTH measurements with the CALIOP CTL measurements appears to show that, in general, the AATSR stereo retrievals are underestimating the height of clouds. The bias demonstrates that CALIOP typically retrieves heights which are 2.5km above those retrieved by AATSR. Further doubt in the AATSR measurements is given by the RMSE (2.76km) and R2 (0.54) scores, both of which show poor agreement between the height retrievals. The cause of the poor agreement is likely due to a number of different effects. Firstly, CALIOP is more sensitive to the actual top of the cloud; AATSR returns the height of the cloud where the optical thickness becomes sufficient to provide enough texture within the image for the stereo matcher to perform effectively. A second cause is likely to be wind displacement of the clouds in the along-track direction. This displacement can affect the accuracy of the stereo CTH retrieval by modifying the relative parallax between image acquisitions. To create noticeable effects at pixel level accuracy, the wind speed must be at least 8m/s-1 (Prata and Turner, 1997), and previous studies have shown that the only region where these wind speeds occur with regularity in the meridional axis, which typically effects CTH estimation, is over Greenland (Muller et al., 2007).
In order to assess whether winds are affecting the validation, coincident ECMWF single layer meridional wind profiles have been extracted and are presented in Figure 4. The collocated study region is approximated by the black transect running through Figure 4. The wind speeds are at most ± 2 m/s-1 in the meridional direction; therefore they are unlikely to be influencing the results of the validation. More likely is the higher sensitivity of CALIOP to the true cloud top.
To assess whether AATSR is better able to detect the bulk of the cloud a second inter-comparison was made against the
CALIOP CBL. The results for this are presented in Figure 3. The scatter plot shows much better agreement between AATSR CTH and CALIOP CBL with far fewer outliers present. The statistical analysis of the inter-comparison again shows a low bias present in the AATSR CTH retrievals, with the CALIOP CBL being around 0.8 km higher in general. The RMSE is still quite high and above 1km at 1.36km, but the R2 value is much improved at 0.71, showing much better agreement between AATSR CTH and the CALIOP CBL.
From this limited validation it appears that AATSR retrieves lower CTH heights than the CALIOP instrument, indeed retrieving heights which are below the base layer of the detected CALIOP clouds. The cause of this is undetermined currently. More extensive inter-comparisons are required to better under-stand the processes at work. Indeed this inter-comparison is limited, so is unlikely to be effectively representing the relationship between the AATSR and CALIOP CTH retrievals.
Figure 4. This Figure shows the meridional wind speeds for the collocation region. The approximate path of the CALIOP instrument in shown by the black transect. All units are in m/s-1.
6. CONLCUSIONS
This work has demonstrated the application of the Census stereo matching algorithm to a month of AATSR data over Greenland. Of the scenes processed, one was selected to be inter-compared with the CALIOP LiDAR instrument for preliminary validation purposes. Whilst the validation is very limited, some good agreement is found between the CALIOP cloud base layer and the AATSR cloud top height. Further work is required to more extensively validate the Census stereo outputs; however the initial results do show some promise. Once fully validated a processing chain is in place to process 20 years worth of ATSR cloud top height data over Greenland for improving the understanding of clouds in this region, which is challenging for current retrieval methods.
7. REFERENCES
Ambach, W. 1974. The influence of fractional cloud cover on the net radiation balance of a snow surface with high albedo, J. Glaciol., 67, 73-84.
Bhat, D., and S. Nayar. 1998. Ordinal measures for image
corre pon ence,” IEEE Transaction on Pattern Analysis and Machine Intelligence, vol. 20, no. 4, pp. 415–423.
Cawkwell, F.G.L. and Bamber, J.L. 2002 The Impact of Cloud Cover on the Net Radiation Budget of the Greenland Ice Sheet, Ann. Glaciol 34, 141-149.
Cawkwell, F.G.L. and Bamber, J.L. and Muller J-P. 2001. Determination of Cloud Top Amount and Altitude at High Latitudes. Geophys. Res. Lett., 28(9), 1675-1678
M. -A. Denis , J. -P. Muller , H. Mannstein. 2007. ATSR-2 camera models for the automated stereo photogrammetric retrieval of cloud top height initial assessments. International Journal of Remote Sensing, v.28 n.9, p.1939-1955
Frey, R. A., B. A. Baum, C. C. Moeller, W. P. Menzel, et al. 1999. Validation of CO2-slicing cloud heights computed from MAS radiance data during SUCCESS. J. Geophys. Res., 104, 24,547-24,555,
Froba, B., and A. Ernst. 2004. Face Detection with the Modified Census Transform. Proceedings of the IEEE international conference on automatic face and gesture recognition (FGR’04)
Hirschmuller, H., Innocent, P., & Garibaldi, J. 2002. Real-time correlation-based stereo vision with reduced border errors. Int J Comput Vision, 47, 229-246
Karlsson, K.-G. and Dybbroe, A. 2010. Evaluation of Arctic cloud products from the EUMETSAT Climate Monitoring Satellite Application Facility based on CALIPSO-CALIOP observations, Atmos. Chem. Phys., 10, 1789-1807
Lorenz, D., 1985. On the feasibility of cloud stereoscopy and wind determination with the along-track scanning
radiometer. Int. J. Rem. Sens., 6 (8), pp. 1445-1461.
Moroney, C., Davies, R., & Muller, J.P. 2002. Operational retrieval of cloud-top heights using MISR data. IEEE TRANSACTIONS ON GEOSCIENCE AND REMOTE SENSING, 40, 1532-1540
Muller, J., Mandanayake, A., Moroney, C., Davies, R., Diner, D., & Paradise, S. (2002). MISR stereoscopic image matchers: Techniques and results. In, IEEE TRANSACTIONS ON GEOSCIENCE AND REMOTE SENSING (pp. 1547-1559)
Muller, J.-P., Denis, M.-A., Dundas, R.D., Mitchell, K.L., Naud, C., & Mannstein, H. (2007). Stereo cloud-top heights and cloud fraction retrieval from ATSR-2. In, International Journal Of Remote Sensing (pp. 1921-1938)
Muller J.-P., J. Fischer, (2007) The EU-CLOUDMAP project: Cirrus and contrail cloud-top maps from satellites for weather forecasting climate change analysis, International Journal of Remote Sensing, v.28 n.9, p.1915-1919
Mutlow, C. 1998 ATSR-1/2 user guide. Oxford, RAL.
Prata, A and P. Turner. 1997. Cloud-top determination using ATSR data. Remote Sensing Environ., 59(1), 1-13.
Rossow, W.B., L.C. Garder, and A.A. Lacis, 1989: Global, seasonal cloud variations from satellite radiance measurements. Part I: Sensitivity of analysis. J. Climate, 2, 419-458,
doi:10.1175/1520-0442(1989)002<0419:GSCVFS>2.0.CO;2
Hirschmüller, H., and D. Scharstein. 2008. Evaluation of stereo matching costs on images with radiometric
differences. IEEE Trans. Pattern Analysis and Machine Intelligence,
Schweiger, A.J. and J. Key, 1992. Comparison of ISCCP-C2 and Nimbus-7 satellite-derived cloud products with a surface-based cloud climatology in the arctic. J. Climate, 5(12), 1514-1527.
Zabih, R. an J. Woo fill. Non-parametric local transforms for
computing vi ual corre pon ence. In ECCV ’94, page 1 1–
158, 1994