No. 31/05/Th. XIII, May 10 , 2010
E
CONOMIC
G
ROWTH IN
I
NDONESIA
F
IRST
Q
UARTER
2010
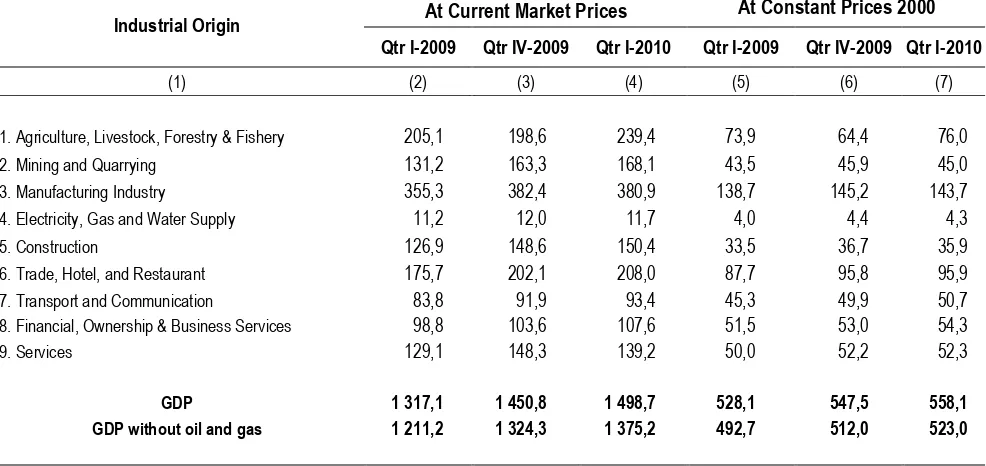
Table 1
GDP at Current Market Price and Constant Price 2000 by Industrial Origin 2000
(Trillion Rupiah)
!
" # # $#% & $ # !
"$# '$ # (#% ! ! !
) *$ $#% +$ ,
--. # # !
/ $% 0 $#% 1 $ $# ! ! !
/ $# - $#% . 22 # $ # ! !
! #$# $ 34# - 5 # , ! !
, !
! "# !$ " $! # $! #" !# ##$!
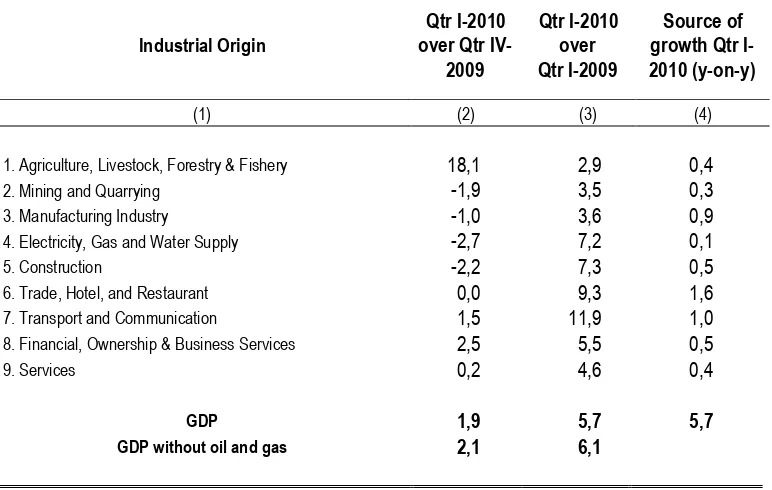
Growth Rate of Quarterly Gross Domestic Product By Industrial Origin (%)
' '
( )
% &
*+ +,
!
" # # $#% & $ # 6
"$# '$ # (#% 6
) *$ $#% +$ , -- 6
. # # 6
/ $% 0 $#% 1 $ $#
/ $# - $#% . 22 # $ #
! #$# $ 34# - 5 # ,
,
! #! #!
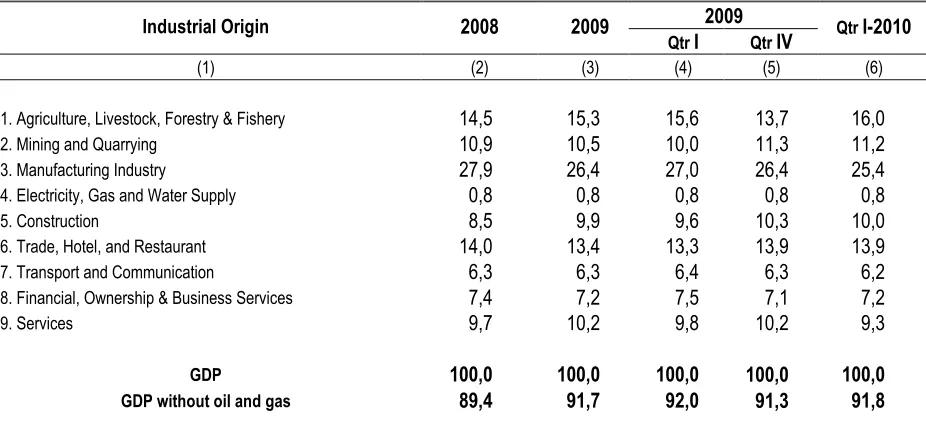
Structure of Gross Domestic Product By Industrial Origin 2008-2009, Qtr I-2009, Qtr IV-2009 and Qtr I-2010
(%)
$
" # # $#% & $ # "$# '$ # (#%
) *$ $#% +$ , -- ! ! ! ! !
. # # !
/ $% 0 $#% 1 $ $#
/ $# - $#% . 22 # $ #
! #$# $ 34# - 5 # ,
, !
! ! ! ! !
% & $ !" ! ! ! !$
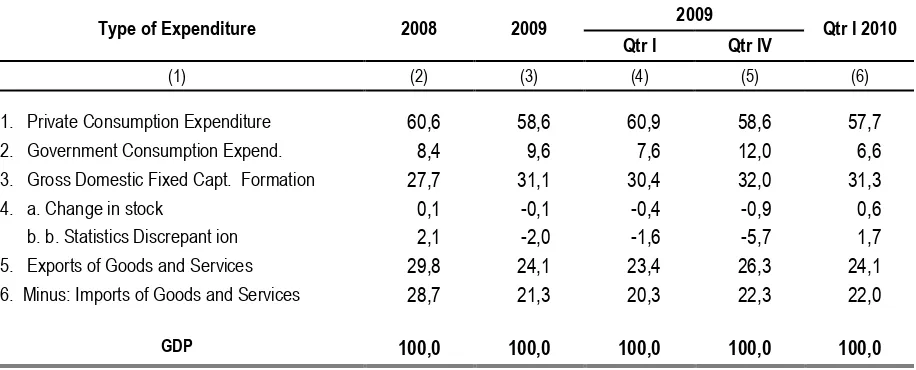
Table 4
Gross Domestic Product by Type of Expenditure (Trillion Rupiah)
.+/ ) 01/
7 $ . # 2- # )8- #% ! ! ! ! * #2 # . # 2- # )8- #% ! * 9 2 8 %
.$-2$ # ! ! ! !
$ . $# # 6 6 ! 6 6
: : , $ 9 -$# # 6 6! 6
)8- ' * % $#% , ! ! !
" # ; (2- ' * % $#% , ! !
Growth Rate of Quarterly Gross Domestic Product by Type of Expenditure (%)
.+/ ) 01/ ' '
( ) % &
*+ +,
7 $ . # 2- # )8- #%
* #2 # . # 2- # )8- #% 6 6! ! 6
* 9 2 8 % .$- 2$ # 6 !
)8- ' * % $#% , 6
" # ; (2- ' * % $#% , 6
! #! #!
Table 6
Structure of GDP by Type of Expenditure 2008-2009, Qtr I-2009, Qtr IV-2009 and Qtr I-2010
(%)
.+/ ) 01/ $
7 $ . # 2- # )8- #% ! !
* #2 # . # 2- # )8- #% !
* 9 2 8 % .$- 2$ #
$ . $# # 6 6 6
: : , $ 9 -$# # 6 6 6
)8- ' * % $#% , !
" # ; (2- ' * % $#% , !
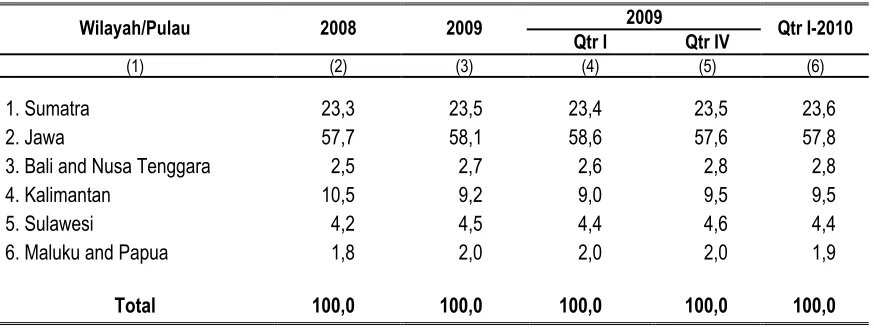
Share of Each Area in GDP (%)
2 + &3 $
, 2$ $
<$4$ ! ! !
5$ $#% = $ / # $ $ ! !
>$ 2$# $# , $4
"$ $#% 7$- $ !