A PREALIMINARY STUDY OF SHIP DETECTION FROM UAV IMAGES BASED ON
COLOR SPACE CONVERSION AND IMAGE SEGMENTATION
A.M. Klimkowska a, I. Lee a, *
a Dept of Geoinformatics, University of Seoul, 163, Seoulsiripdae-ro, Dongdaemun-gu Seoul, Korea –
[email protected], [email protected]
Commission I, ICWG I/Vb
KEY WORDS: Ship Detection, Remote Sensing Images, Edge Detection, Colour Space, Marine Surveillance, UAV
ABSTRACT:
Ship detection is an inherent process supporting tasks such as fishery management, ship search, marine traffic monitoring and control, and helps in the prevention of illegal activities. So far, sea and shore monitoring has been carried out by ship patrols and aircrafts along with sea vessel detection from data from space-borne platforms. Recently an increase interest in applying images delivered by UAV for marine application due to their advantages such as high spatial resolution, independence on time acquisition can be noticed. While investigating state of the art methods used for ship detection from different platforms using optical images, we found a significant problem with occurrence of a ship wake. This phenomena may prohibit correct detection of ship location and results in overestimating the ship size as the ship and its wake are often considered as being part of the same object in image or wakes are distinguished as a separate ship due to their possible similar brightness compared with sea vessel. In order to reduce the impact of ship wakes we investigated the behavior of images in different color spaces to provide data with little or almost no trace of ship wake. We took into consideration following color spaces: HSV, YCbCr, NTSC, XYZ and L*a*b and investigated each channel from new images. Finally we decided to use 2nd channel of L*a*b space where the ship wakes occurrence were significantly reduced. Object of interest were detected through the use of image segmentation. Applied method uses edge detection based on the gradient magnitude calculation. Afterwards several characteristics such as centroids, major and minor axis, size and orientation were calculated for later use to remove false positives and thus improve accuracy of the proposed method.
1. INTRODUCTION
Ship detection plays an important role in border control, safety, security (Barale and Gade, 2014) and observation of marine environment (Seltenrich, 2014). It allows people to monitor ship traffic, prevent illegal activities such as illegal fisheries (Perez et al. 2013), piracy, and immigration (Dysart, 2011). It is especially important as some of the smaller vessels (e.g. fishing boats, vessels with immigrants) do not have the Automatic Identification System (AIS). The AIS is either switched off on purpose or is defective. Such situations force the appropriate authorities to find reliable and effective approach to detect and monitor sea vessels.
Up to now, the majority of previous studies have been using data from space borne platforms both radar and optical sensors, as well as radar imagery from manned aerial vehicles. Space borne platforms provide data that covers a wide area of interest at the cost of spatial resolution. On those imagery ships are often mistaken with the objects such as rocks or waves which makes the correct classification difficult. The fact that sea vessels can differ significantly in terms of size (from a couple of meters to few hundred meters) and shape (e.g. ferry, yacht, fishing boat etc.) makes the task even more complicated.
Ships detection systems using Synthetic-Aperture Radar (SAR) provides data which can be captured during day and night under almost any weather conditions (rain, clouds). As ships are mainly made of metal, the radar rays are intensively reflected from the vessels, which makes radar data a great source of information for ship detection. It is important to note, that one of the greatest limitations of this approach is the problem with
* Corresponding author
detection of small vessels. Optical satellite images, second most frequently used source of data, are characterized with higher spatial resolution compared to radar data, which is without a doubt an advantage. This allows to detect smaller vessels, as well as detailed ship sea vessel classification can be carried out. The limitation of optical satellite imagery lies in its strong dependence on the weather conditions, images can be obtained only during daytime.
Radar imagery for ship detection are also delivered by sensors mounted to manned aerial vehicles which does not apply to optical images. Examples to the second type of data can be barely found in literature.
Recent development of UAV technology and sensors miniaturization has led to the application of UAV across a wide range of disciplines (Harwin and Lucieer, 2012). UAV images are characterized by high definition and resolution and can be captured when necessary, presenting better temporal resolution compared to data delivered by other platforms, which all are undoubtedly the strengths of UAV. Among the disadvantages, it is worth to mention a problem with UAV operation time which leads to limitation in the mapped area size. Despite the apparent advantages of data obtained from UAV, to the best of our knowledge, not many research has been done to detect ships from UAV images.
Figure 1. Classification of ship detection studies from different platforms and sensors
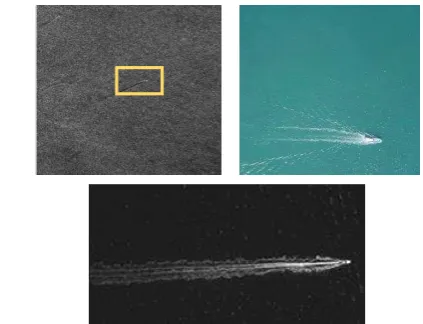
state of the art approaches for ship detection, we realized that ship wake prevent proper detection of sea vessels size (more contours that exact shape are important) and thus, precise estimation of ship position is straitened. This is because ship and its wake are considered as being part of the same object in image. Separate studies have been conducted to find a solution for wake ship recognition. On optical images moving vessel and its wake are hard to separate due to their connection and possible similar brightness (Greidanus and Kourti, 2006). A thorough search of the relevant literature yielded that vast majority of studies for wake detection use SAR images on which wakes are mapped as bright or dark lines over the sea clutter (Graziano et al., 2016). This phenomena does not exist in thermal images or is barely visible, but is a significant problem in optical images (Fig.2).
Figure 2. Examples of ship wakes. On the left: ERS-1 C-VV image (www.nrcan.gc.ca), middle: optical satellite image (Mattyus, 2013), on the right: UAV image.
For the purpose of our research we looked for methods to reduce influence of the ship wake for sea vessel detection application. This motivated us to investigate the behavior of ship wakes in different color spaces. Conversion of RGB color space to others such as HSV, YCbCr or L*a*b is often used to separate foreground-background or target-clutter in color images (Philipp and Rath, 2002). In some studies color spaces are used in specific applications. For example Mirghasemi et al. (2010) worked on a new nonlinear quadratic transform to generate target-based color space (TCS) for sea target detection, face recognition in new space based on K-L1 transform (Jones and Abbott, 2004), brain
tumor detection using CIELab color space and K-Means clustering segmentation (Wu, M. N., et al, 2007), Sun et al. (2016) use YCbCr color space to detect targets captured on images from UAV for Search and Rescue purposes. Problem with moving object detection was a subject of study in Balcilar et al. (2014) where Gaussian Mixture Model (GMM) along with spatial and temporal features in LAB2000HL color space was used to solve the problem.
In our project we are interested in using both RGB and thermal images to detect ships on data from UAV platform. As ship wakes does not exist or are barely visible on thermal images, we decided to look in more details for possibilities to reduce ship wake appearance in RGB images. That is why we decided to investigate how wakes are mapped in RGB image when we convert one into different color space. Following this approach we first converted RGB to LAB color space and then 2nd channel is used for further computations.
In this study we present an approach to detect ships and estimate their location, and direction from optical images obtained from UAV. The proposed algorithm is based on colour space conversion and image segmentation, where everything except the objects of interest is filtered out from the original image. Experimental results are shown for each step of the implemented approach.
2. METHODOLOGY
2.1 Color features
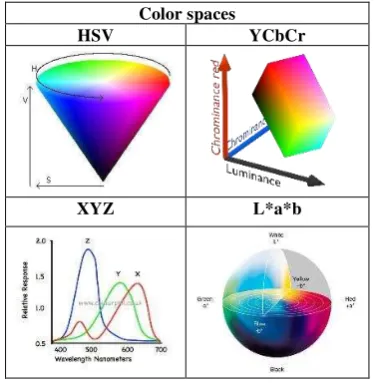
represented by the high of the cone and vary from 0 to 100% where for 0, colour space will be totally black. YCbCr is a color space model where Y is the brightness (luminance component), Cb is the difference between luminance and blue, and Cr is the difference between luminance and red. The green color is derived from these three values. In the CIE XYZ color space, also named tristimulus color space. Y corresponds to relative luminance as well as carries color information related to the eye’s yellow-green cone response, while X and Z brings additional information about how the light waves of varying frequencies affect the cones in the human eye. L*a*b color space is a 3-axis color system with dimensions L for luminance, a and
b for the color dimensions. A is a in a range from -128 (a bluish green) to +127 (pinkish magenta) and b is in a range from -128 (blue) to +127 (yellow). Figure 3 presents HSV, YCbCr, XYZ and L*a*b color space models.
Color spaces
HSV YCbCr
XYZ L*a*b
Figure 3. HSV, YCbCr, XYZ and L*a*b color space models
Figure 4 shows a sample image presenting a ship and a ship wake converted to a different color spaces. Based on the results from this step we decided to choose L*a*b color space for further process. From each image, three separate channels were extracted and investigated. Based on the results we decided to choose the 2nd channel for further investigation and ship detection (Fig. 5).
Conversion of RGB image to different color spaces Original Image RGB to HSV RGB to YCbCr
RGB to XYZ RGB to LAB
Figure 4. Original image converted into different color spaces
LAB image – channels extraction L*a*b color space image 1st channel of L*a*b
2nd channel of L*a*b 3rd channel of L*a*b
Figure 5. L*a*b color space image and its three channels
2.2 Sea target detection
Extraction of 2nd channel of L*a*b color space gave us an image with reduced appearance of wake ship. With this result we are going to perform main part of the algorithm leading to detect sea vessels. Figure 6 presents the flow chart of the implemented method. Firstly the input image is smoothed by Gaussian filter to blur images and remove noise, and details (Fig 7).
Figure 6. Flow chart of the ship detection process
Figure 7. Left: original image, right: smoothed image
� = �� ∗ � (1)
� = �� ∗ � (2)
� , = √� + � (3)
where I = input image
� , � = x and y derivatives of image smoothed by Gaussian filter (�� and �� ) M = magnitude of gradient at every pixel
As image presents sea surface, it is possible to find unwanted features such as waves which magnitude is smaller than the one of objects of interest. Thus, Otsu’s method is used to find a global image threshold. This means that the objects with magnitude smaller than a threshold value calculated via Otsu’s method will be removed (Fig. 8). Otsu’s method is based on finding a threshold value that minimize the weighted within-class variance:
� (��) = (��)� (��) + (��)� (��) (4)
where , = weights (probabilities of the two classes divided by a threshold)
�� = threshold
� , � = variances of classes
Figure 8. Left: the gradient image, right: threshold image
After this operation, some objects different form objects of interest still appears in the images. To remove them, edges are filled in. Remained objects are labeled and are for each blob is calculated. This allows to find objects with size smaller or greater from the expected one and remove them (Fig. 9).
Figure 9. Left: pseudo colored blobs, right: detected target of interest
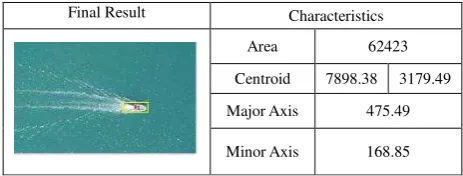
At the end, bounding box of the remaining ship targets are estimated along with some characteristics such as major/minor axis, orientation and eccentricity. Those information are calculated to help with better classification between object of interest and others (Fig. 10).
Final Result Characteristics Area 62423 Centroid 7898.38 3179.49 Major Axis 475.49 Minor Axis 168.85
Figure 10. Results of implementation of the algorithm. Final image with bounding box in yellow, and centroid in red. On the
right characteristics of the detected object.
3. RESULTS
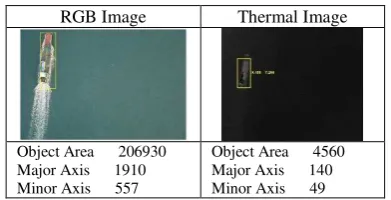
The proposed method was checked on the data obtained from 200m and 350m. Image from 350m was presented to show steps of the algorithm in Methodology section. Figure 11 presents results obtained by applying the approach to a ship mapped in the image obtained from 200m. As can be seen in fig. 12 shape and size of the ship was not perfectly estimated, which is not that important it terms of locating position of the ship as long as the major and minor axis are calculated precisely. To investigate obtained characteristics we compared data obtained from RGB and optical images. As the resolution of images is different, RGB has 4000x6000pixels and thermal 512x640 pixels we calculated ratio between input data.
After scaling results from thermal images we received following values: area – 333984, major axis – 1312 and minor axis – 359. While looking at the images one can notice the difference in the bounding box size. For thermal image box doesn’t cover the whole ship, while in the RGB image the box is too big which is the reason for the difference. We also evaluated results for a ship mapped in the image obtained from 350m. In this case additionally results are compared with the ship which was not moving (Fig 13).
The difference between results obtained for ship with ship wake and without shows smaller differences than in case of 200m which can be seen just by looking at the bounding boxes. Scaling results obtained from thermal images we received following values area – 53833, major axis – 346 and minor axis – 203. While the area is comparable, the length of major and minor axis is different which can be investigated later.
Original RGB Image 2nd Channel Image
Binary Image Blobs Removing Final Result
RGB Image Thermal Image
Figure 12. Comparison of characteristics for same ship mapped on RGB image (left) and thermal image (right). Altitude 200m
RGB Image Thermal Image RGB Image (ship without wake) Figure 13. Comparison of characteristics for same ship mapped
on RGB image (left), thermal image (middle), same ship without ship wake (right). Altitude 350m
4. CONCLUSION
In this paper we present preliminary approach for ship detection from images obtained from UAV. Our goal was to calculate as precisely as possible the location of the ship. Through investigation of different techniques used for ship detection we found, that existence of ship wakes plays an important role in this case. Based on that we decided to search for ways to reduce the influence of ship wakes on sea vessel detection process. To do so, behavior of object of interest was checked for different color spaces. Hence, 2nd channel of L*a*b color space was used for further calculations. Ship detection is based on image segmentation where gradient magnitude and Otsu’s global threshold are implemented. In future, the method will be investigated on bigger stack of data in real time measurements.
AKNOWLEDGEMENT
This research was a part of the project titled “Base Research for Building Wide Integrated Surveillance System of Marine Territory” funded by the Ministry of the Oceans and Fisheries, Korea.
REFERENCES
Balcilar, M., Amasyalim M.F. and Sonmez, A.C., 2014. Moving Object Detection using Lab2000HL Color Space with Spatial and Temporal Smoothing, Applied Informatics and Information Science, 8, No. 4, pp 1722-1766.
Barale. V, and Gade, M., 2014. Remote Sensing of the African Seas, Springer.
Dysart, M.D., 2011. Remote Sensing and Mass Migration Policy Development, A Research Report Submitted to the Faculty In Partial Fulfillment of the Graduation Requirements, AIR University.
Graziano, M.D., D’errico, M., Rufino, G., 1016. Ship Heading and Velocity Analysis by Wake Detection in SAR Images”, Acta Astronautica, 128, pp. 72-82.
Greidanus, H. and Kourti, N., 2006. Findings of the DECLIMS project - Detection and classification of marine traffic from space”, Proc. 1st Int. Workshop Adv. SAR Oceanogr. from ENVISAT and ERS Mission, ESA-ESRIN, Frascati, Italy.
Harvin, S., and Lucieer, A., 2012. Assessing the accuracy of georeferenced point clouds produced via multi-view stereopsis from Unmanned Aerial Vehicle (UAV) imagery, Remote Sensing,
4(6), 1573 – 1599.
Jones, C. F. and Abbott, A. L., 2004. Optimization of Color Conversion for Face Recognition, Eurasip Journal on Applied Signal Processing, vol.4, pp. 522–529.
Mattyus, G., 2013. Near Real –Time Automatic Marine Vessel Detection on Optical Satellite Images, International Archives of the Photogrammetry, Remote Sensing and Spatial Information Sciences, vol. XL-1/W1, ISPRS Hannover Workshop, Germany.
Mirghasemi, S., Yazdi,H.S. and Lotfizad, M., (2010), Linear and Quadratic PSO Based Color Space Conversion for Sea Target Detection, International Jourlal of Computer and Electrical Engineering, Vol. 2, No. 1, pp. 1793-8163
Perez, J.C., Alvarez, M.A., Heikkonen, J., Guillen, J., Barbas, T., “The Efficiency of Using Remote Sensing for Fisheries Enforcement: Application to the Mediterranean Bluefin tuna fishery”, Fisheries Research, vol. 147, pp. 24-31, 2013.
Philipp, I. and Rath, T., 2002. Improving Plant Discrimination in Image Processing by Use of Different Color Space Transformations, Computers and Electronics in Agriculture, vol.35, pp.1–15.
Seltenrich, N., 2014. Remote-Sensing Applications for Environmental Health Research”, Environmental Health Perspectives, vol. 122
Sun, J., Li, B., Jiang, Y., & Wen, C., 2016. A Camera-Based Target Detection and Positioning UAV System for Search and Rescue (SAR) Purposes. Sensors (Basel, Switzerland), 16(11), 1778. http://doi.org/10.3390/s16111778.
Wu, M.N., Lin, C.C. and Chang, C.C., 2007. Brain Tumor Detection Using Color-Based K-Means Clustering Segmentation, third International Conference on Intelligent Information Hiding and Multimedia Signal Processing, DOI: 10.1109/IIHMSP.2007.4457697