VEGETATION ANALYSIS AND LAND USE LAND COVER CLASSIFICATION OF
FOREST IN UTTARA KANNADA DISTRICT INDIA THROUGH
GEO-INFORMATICS APPROACH.
A.G. Koppada, B S Janagoudarb
a Professor and Head (NRM), College of Forestry Sirsi-581401,Karnatak, India; e-mail: [email protected] 2 Director of Education, University of Agricultural Sciences, Dharwad, India; e-mai:[email protected]
KEY WORDS: forest, software, LULC class, NDVI, aspect, altitude, classification, imageries
ABSTRACT:
The study was conducted in Uttara Kannada districts during the year 2012-2014. The study area lies between 13.92o N to 15.52o N latitude and 74.08o E to 75.09o E longitude with an area of 10,215 km2. The Indian satellite IRS P6 LISS-III imageries were used to classify the land use land cover classes with ground truth data collected with GPS through supervised classification in ERDAS software. The land use and land cover classes identified were dense forest, horticulture plantation, sparse forest, forest plantation, open land and agriculture land. The dense forest covered an area of 63.32 % (6468.70 sq km) followed by agriculture 12.88 % (1315.31 sq. km), sparse forest 10.59 % (1081.37 sq. km), open land 6.09 % (622.37 sq. km), horticulture plantation and least was forest plantation (1.07 %). Settlement, stony land and water body together cover about 4.26 percent of the area. The study indicated that the aspect and altitude influenced the forest types and vegetation pattern. The NDVI map was prepared which indicated that healthy vegetation is represented by high NDVI values between 0.1 and 1. The non-vegetated features such as water bodies, settlement, and stony land indicated less than 0.1 values. The decrease in forest area in some places was due to anthropogenic activities. The thematic map of land use land cover classes was prepared using Arc GIS Software.
INRTODUCTION
The vegetation distribution is mainly depends on topographic and environmental factors. Vegetation cover affects local and regional climate. Among the topographic factors altitude, slope and aspect are effective parameters on spatial distribution of vegetation (Clerk,1999, Solan,2007, Stage,2007). The soil characteristics are most important which are affected by aspect and altitude in-turn helps to determine plant ecological group (Sneddon, 2001). In a forest ecosystem, soil properties are also influenced by vegetation composition. The aspect and slope can control the movement of water and material in a hill slope and contribute to the spatial differences of soil properties (Chun, 2007). The remote sensing technique is most useful tool to determine the vegetation pattern.
Major anthropogenic activities (crop cultivation and livestock grazing) are dominantly undertaken on gentle sloppy area. Major ecosystem changes due to human activities are crop cultivation and animal husbandry (Wondie, 2012). Aspect, slope and elevation have been found to significantly affect the spatial and temporal distribution of vegetation. The land use land cover classes identification would provide proper planning to protect further reduction of forest vegetation. In the present scenario of climate change it is necessary to take the stock of vegetation cover and planning for further forest coverage to help mitigating the climate change scenario. Forest deterioration in many situations is mostly because of anthropogenic activities, the mapping of land use land cover would provide base to plan further protection in one way and
plan to increase the forest vegetation in most of the places where spare forest area and open land and waste land exist. Also helps to introduce interventions to reduce the pressure on deforestation and degradation keeping these points in view covering Uttara Kannada (UK) district were procured from Survey of India. (topo-sheet Nos. 48 I, (48 I/8,11,12, 15, and 16) 48 J ( 48 J/5, 6, 9, 10, 11, 13, 14, 15, and 16,) 48 M (48 M/3, and 4)and 48 N (48N/1, 2, 3, and 4). The each topo-sheet covering an area of 15’x 15’ latitude and longitude.
signature set for generation of signature file for each LULC with the help of spectral reflectance in ERDAS Imagine software. Using signature file of each land use land cover class, different LULC class was done using supervised classification technique in ERDAS software. In the supervised classification process, Maximum Likelihood parametric rule was used to produce better accuracy of the thematic maps. ETM+ images was downloaded to study the aspect and NDVI map of coastal region of the district.
Figure 1. Study area of Uttara Kannda district.
RESULT AND DISCUSSION
The land use land cover classes in Uttar Kannada district was demarcated based on ground truth data collected from GPS and classification made using supervised classification in ERDAS software. The different land use land cover classes with their area covered in the district is given in table 1. The LULC classes are also shown in the form of colored map in figure 2.
There are 11 LULC classes were identified in the district. Among the different LU/LC classes, dense forest covered an area of 63.32 % (6468.70 sq km) followed by agriculture 12.88 % (1315.31 sq. km), sparse forest 10.59 % (1081.37 sq. km), open land 6.09 % (622.37 sq. km), horticulture plantation and least area was covered by forest plantation (1.07 %) which includes teak and Acacia plantation also. The remaining classes include settlement, stony land and water body together covered an area 4.26 percent. The total area of the district is 10215.23sq.km (Table 1).
Table 1. Area covered by different LULC classes
Figure 2. Land use land cover classes
solar radiation resulting change in vegetation pattern (Panthi et al., 2007). Some of the land use classes in the district is shown in plates 1 to 5.
Plate 1. Dense forest
Plate 2. Agriculture land (Paddy crop)
Plate 3.Teak plantation
Plate 4.Open land
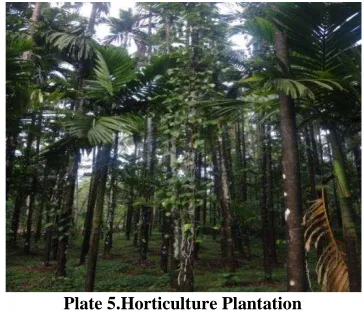
Plate 5.Horticulture Plantation
The part of the district covering five taluks which are covering the coastal belt of the district was taken to study the effect of aspect, since it is having hilly, undulating and plane area. The ETM+ (Enhanced thematic mapper) image 2006 was downloaded and prepared Normalized Differential Vegetation Index (NDVI) in coastal region of UK district. Digital Elevation Model (DEM) was used to generate aspect and altitude map to assess its effect on vegetation pattern. The aspect and NDVI map is shown in figure 3.
Figure 3. Aspect and NDVI map of coastal region of UK district
The NDVI value for the land use classes with altitude is given in table 2. The NDVI indicating the range of value from -0.51 to -0.27 for water body, -0.27 to 0.14 for open land, 0.14 to 0.37 for agriculture and 0.37 to 0.69 for the forest cover. The most of the healthy vegetation cover is found in the altitude from 70-750 m on the sloppy area of 20-86 degrees.
The lower altitude area are more suitable for anthropogenic activities, hence most of the lower altitude places reduction in vegetation cover occurred as indicated by lower NDVI values (Koppad and Tikhile 2012). The increase in NDVI values with higher altitude are due to non interference of the human/domestic animal activities. At the higher altitude beyond 625 m the NDVI values decreases due to steep slope at the tip of hill, erosion is one of the cause at steeper slope which resulted sparse vegetation. The change in the NDVI values with different altitude is shown in figure 4. It indicated that the NDVI values are increasing up to 625 at NDVI reduced due to higher slope and exposure of land for erosion. In the lower altitude it was recorded lower NDVI value as the altitude increases the NDVI values also increase further increase in altitude shows the decrease in NDVI value
Figure 4. Change in NDVI value with altitude
Healthy vegetation is represented by high NDVI values between 0.1 and 1. Inversely, non-vegetated surfaces such as water bodies yield negative values of NDVI because of the electromagnetic absorption quality of water. Bare soil areas represent NDVI values which are closest to 0 due to high reflectance in both the visible and NIR portions of the EMS (Lilles and Kiefer 1994). The NDVI value change with aspect is shown in figure 5.
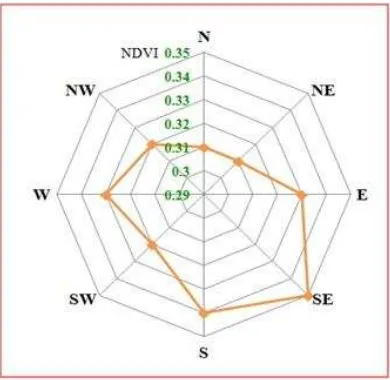
Figure 5. Change in NDVI value with aspect
The aspect also plays an important role for forest vegetation. All the eight aspects are considered, among them south east are important once to decide the vegetation. Anthropogenic activities are the main caused for degradation and deforestation which results to change in land use land cover from one class to another like dense forest to sparse forest otr sparse forest to open land etc. The thematic map of the district becomes the blueprint to plan for protection of the existing forest and plan to increase the forest area to combat against the climate change of present scenario.
ACKNOWLEDGEMENT
Authors are thankful to the Department of Science and Technology, New Delhi for providing the financial assistance to carry out research work in Uttara Kannada district
REFERENCES
Brang, P. Schonenberger, W., Ott, E. R.H. Gardner, 2001. Forests as protection from natural hazards. In: Evans, J. (Ed.), The Forests Handbook. Blackwell Science Ltd., Oxford, pp.53-81. and Zahedi, G. ,2004. Effective environmental factors in the distribution of vegetation types in Poshtkouh rangelands of Yazd Province (Iran). J Arid Environment, 56: 627–641.
Koppad, A.G., Tikhile, P., 2012. Anthropogenic impact assessment on forest biodiversity in coastal region of Uttara Kannada district using RS and GIS technique. The Ecoscan,
1(1): 287-291.
Lilles and, T.M., Kiefer (1994). Remote Sensing and Image Interpretation, John Wiley, New York.
Sneddon, L.,2001. Vegetation classification of the Fire Island national seashore. TNC/ABI Vegetation Mapping Program. Association for Biodiversity Information Boston MA, USA, , pp.78.
Solon, J. Degorski, M. Roo-Zieli ska, E., 2007. Vegetation response to a topographical-soil gradient, Catena J. 71(2), 309-320.
Stage, A.R., Salas, C., 2007. Interactions of Elevation, Aspect, and Slope in Models of Forest Species Composition and Productivity, Forest Science. 53(4), 486-492.
Wang, Z., Liu, G., Xi, M., Zhang, J., Wang, Y. and Tang, L. 2012. Temporal and spatial variation in soil organic carbon sequestration following revegetation in the hill Loess Plateau, China. Catena, 99: 26-33.