Refer to Important disclosures in the last page of this report
Stock DataTarget price (Rp) Rp2,500
Prior TP (Rp) Rp3,500
Shareprice (Rp) Rp2,290
Upside/downside (%) +9.2
Sharesoutstanding (m) 5,434
Marketcap. (US$ m) 856
52w high/low (Rp) 6,100 - 2,290
Major Shareholders
PT Indo Premier Sekuritas [email protected] +62 21 5793 1168
Profit turnaround still lack visibility
Better YoY top-line growth next year albeit from low base.
Cost control to limit margin pressure.
Network investment is rapidly catching up to drive future growth.
Maintain Hold TP Rp2,500 (9% ups), 7% above -1STD of 7-yr mean.
We view new management’s transformation strategy will be positive to ISAT.
However, we remain conservative in our estimates given uncertainty in recovery
timing and momentum (e.g. core profitability turnaround) after tightening in
prepaid card registration.
Better YoY top-line growth next year.
This is supported by diminishing impact
from registration and blocking of prepaid card during 2018. We expect subscribers
might still decline in 4Q18F (on-going “cleansing” in subscriber base), but
increase in ARPU will limit impact on revenue. We expect full-year revenue growth
to turn positive in 2019F (+7%YoY) from negative in 2018F (-26%YoY).
Stabilization of EBITDA margin
. After significant margin decline in 1H18, we
expect effective cost control to limit FY18F/19F margin pressure and
conservatively assume slight recovery in margin afterward. Thus, our 2018F-29F
EBITDA margin (c.30-35%) is still below 43% EBITDA margin booked in FY17.
Strong capex jump to support future growth.
After slowing down of (booked)
capex realization in FY16-17, we expect ISAT to enter capex cycle during
2018F-19F to support network expansion and improvement, incl. to outer Java. Our total
18F-19F capex assumption is Rp15tn (USD1bn, assuming Rp14.7K/USD), c.48%
lower than management’s estimate of > Rp29tn (USD2bn using Rp14.7K/USD
rate). Management said this amount is yet to be finalized. We expect 18F-19F
capex to account for 34-32% of revenue, above FY16-17 at 22-20%.
We cut DCF-based TP by 29% to Rp2,500 – Maintain Hold
. We lowered TP
by 29% to Rp2,500 mainly because we cut EBITDA estimates by c.14-18% for
translates to 4x 19F EV/EBITDA, similar to -1STD of 7-yr mean.
Risks
(page 6). Upside risks: Outer Java expansion, possibility of
tower-sale-and-lease back. Downside risks: Low stock liquidity.
Indosat
(
ISAT IJ
)
Source: ISAT, IndoPremier Share Price Closing as of :8-November-2018
2
Refer to Important disclosures in the last page of this report
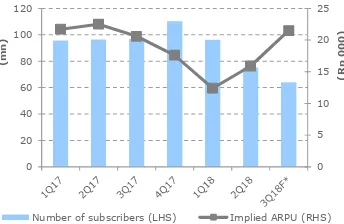
Fig. 7: 3Q18F results indicationFig. 1: ISAT’ revenue breakdown 2Q18* Fig. 2: ISAT’s subscribers and ARPU
Voice, SMS, *) 3Q18 revenue breakdown yet disclosed (waiting for audited result).
0
Number of subscribers (LHS) Implied ARPU (RHS)
*) Based on ISAT's highlight announcement (unaudited). Company said key highlights may differ from ISAT's official financial statement (est. release schedule on c. 23 Nov).
Source: Company, IndoPremier Source: Company, IndoPremier
Fig. 3: Investor Day 2018: Chief Technology & Information
Officer (CTO)’s Presentation (1) Fig. 3: Investor Day 2018: CTO’s Presentation (2)
Source: Company, IndoPremier Source: Company, IndoPremier
Fig. 5: ISAT fw-hist. EV/EBITDA until 2 Nov 2018 (4.1x) Fig. 6: Big 3 Telcos’ EV/EBITDA
2.5
ISAT Fw-EV/EBITDA ISAT Fw-EV/EBITDA avg Fw-EV/EBITDA + 1 STD
Fw-EV/EBITDA - 1 STD Fw-EV/EBITDA - 2 STD Fw-EV/EBITDA + 2 STD
-2STD 3.8 -1STD 3.0 Avg 4.7 +1STD 5.5 +2STD 6.3
TLKM Fw-EV/EBITDA EXCL Fw-EV/EBITDA ISAT Fw-EV/EBITDA
2 Nov: TLKM* 8.9x; EXCL 3.6x; ISAT 4.1x
*) TLKM’s EV/EBITDA is adj. to ownership in Telkomsel.
3
Refer to Important disclosures in the last page of this report
(Rp bn) 3Q17 2Q18 3Q18F* QoQ YoY 9M17 9M18F* YoY 3Q18F* /
*) Based on ISAT's highlight announcement (unaudited). Company said key highlights may differ from ISAT's official financial statement (est. release schedule on c. 23 Nov).
Source: Company, IndoPremier
Analysis on 3Q18F Result Highlight
Expect modest QoQ recovery in top-line
. Company expect 9M18F revenue to
be Rp17tn (-26%YoY), in-line to our estimate but below consensus. 3Q18F
revenue to grow +6%QoQ (slower than Telkomsel +36%QoQ) thanks to
diminishing pressure from prepaid card registration impact. We note 3Q18 cellular
subscribers still declined to 64mn (-15%QoQ; -34%YoY), but ARPU increased in
higher QoQ rate to Rp22K (+35%QoQ; -21%YoY).
EBITDA margin stabilized.
9M18F EBITDA might be below to consensus and
our estimate. 3Q18F EBITDA showed positive QoQ of 6% (inflection point).
EBITDA margin was stable in 3Q18 vs. 2Q18 at 29%, which we think due to
effective cost control. We assume EBITDA margin to roughly stable at c.30% in
2018F-20F, slightly higher than 3Q18F at 29%.
Strong capex jump to support future growth.
9M18F capex would be Rp4.8tn
(+93%YoY; 62% of our FY estimate). 3Q18F capex jumped by +57%QoQ
(+170%YoY), to Rp2.1tn. We view strong capex growth to support ISAT’s growth
trend recovery in the future.
Investor Day (30 October 2018)
New management targets to improve nation wide 4G population coverage to 80%
in 4Q18F from 53% in 4Q17: Outer Java to 60% in 4Q18F from 26% in 4Q17;
Java to 80% in 4Q18F from 68% in 4Q17. The company has improved customer
experience based on improvement by close to 50% faster in 4G download speed
in Jun 2018 vs. Dec 2017, according to company and OpenSignal.
Outer Java expansion on-track: Lampung in April 2018; Banjarmasin and Makasar
in Sep 2018; and Medan later in 2018. This might give slight negative sentiment
mainly to TLKM than EXCL as Telkomsel might have higher revenue contribution
from outer Java than EXCL (c.15% to revenue), in our view.
4
Refer to Important disclosures in the last page of this report
Fig. 8: Forecast drivers*Description FY16 FY17 2018E 2019E 2020F
Total minutes carried
(b min) 63 55 35 29 27
% change 11.2% -13.3% -36.8% -15.0% -10.0%
Voice revenue / outgoing minute (Rp) 173 181 180 178 169
% change -9.0% 4.6% -0.6% -1.0% -5.0%
Data
Data traffic (terabyte) 491,789 1,082,761 1,925,547 4,159,182 7,029,018
% change 147.1% 120.2% 77.8% 116.0% 69.0%
*) We have not included potential tower sale-and-lease-back in our estimates. **) Actual SMS traffic is not disclosed in 1H18.
5
Refer to Important disclosures in the last page of this report
Fig. 9: Changes in forecasts and estimatesYE 31 Dec (Rp bn) 2018E 2019E YE 31 Dec (Rp bn) 2018E 2019E
Revenues - Current 22,529 24,201 Net interest expense - Current (1,964) (1,956)
Revenues - Old 22,547 23,748 Net interest expense - Old (1,888) (1,765)
% change -0.1% 1.9% % change 4.0% 10.8%
Cellular Revenue - Current 17,933 19,430 Net Income - Current (3,120) (2,873)
Cellular Revenue - Old 17,951 18,977 Net Income - Old (2,082) (1,916)
% change -0.1% 2.4% % Change NM NM
Fixed line, MIDI, others revenue
- Current 4,596 4,771 Core profit - Current (3,955) (2,979)
Fixed line, MIDI, others revenue
- Old 4,596 4,771 Core profit - Old (2,917) (2,022)
% change 0.0% 0.0% % change NM NM
EBITDA - Current 6,831 7,455 Capex booked - Current 7,735 7,679
EBITDA - Old 8,140 8,700 Capex booked - Old 7,741 7,906
% change -16.1% -14.3% % change -0.1% -2.9%
EBITDA margin - Current 30.3% 30.8% Capex booked to Revenue - Current 34.3% 31.7%
EBITDA margin - Old 36.1% 36.6% Capex booked to Revenue - Old 34.3% 33.3%
Net debt - Current 16,953 17,437
D&A - Current (9,235) (9,703) Net debt - Old 15,918 15,453
D&A - Old (9,235) (9,712) % change 6.5% 12.8%
% change 0.0% -0.1%
EBIT - Current (2,403) (2,248)
EBIT - Old (1,095) (1,012)
% change NM NM
6
Refer to Important disclosures in the last page of this report
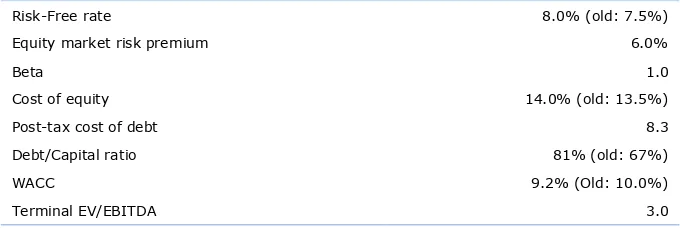
Fig. 10: Risk-free-rate and terminal EV/EBITDA assumption
Risk-Free rate 8.0% (old: 7.5%)
Equity market risk premium 6.0%
Beta 1.0
Cost of equity 14.0% (old: 13.5%)
Post-tax cost of debt 8.3
Debt/Capital ratio 81% (old: 67%)
WACC 9.2% (Old: 10.0%)
Terminal EV/EBITDA 3.0
Source: Company, IndoPremier, Bloomberg
Risks
Upside risk: Possibility of new performance guidance in next earning call (usually
near result release schedule on 23 Nov); result from recent push marketing
strategy to end customers; outer Java expansion; 2018F cost efficiency (2Q18
company guidance is high 30’s EBITDA margin); possibility of
tower-sale-and-lease-back (company said it is still in assessment process and are not in talks with
any party).
7
Refer to Important disclosures in the last page of this report
Year To 31 Dec (RpBn) 2016A 2017A 2018F 2019F 2020F
Income Statement
Net Revenue 29,185 29,926 22,529 24,201 25,989
Cost of Sales 0 0 0 0 0
Gross Profit 29,185 29,926 22,529 24,201 25,989
SG&A Expenses (25,293) (26,016) (24,932) (26,449) (28,055)
Operating Profit 3,891 3,910 (2,403) (2,248) (2,066)
Cash & Equivalent 1,850 1,675 1,422 1,729 1,517
Receivable 2,750 3,989 3,003 3,226 3,464
Inventory 79 88 66 71 76
Other Current Assets 3,394 3,728 2,716 2,821 2,925
Total Current Assets 8,073 9,479 7,208 7,847 7,983
Fixed Assets - Net 39,078 35,892 34,392 32,367 29,500
Goodwill 1,440 1,597 1,597 1,597 1,597
Non Current Assets 1,877 3,078 2,206 2,363 2,585
Total Assets 50,839 50,661 45,831 44,666 42,204
ST Loans 399 0 616 339 318
Payable 845 872 0 706 758
Other Payables 10,429 10,726 10,789 11,017 11,052
Current Portion of LT Loans 7,413 4,602 3,049 3,118 3,283
Total Current Liab. 19,087 16,200 15,111 15,179 15,411
Long Term Loans 12,349 14,899 14,710 15,710 15,100
Other LT Liab. 5,226 4,746 4,362 4,855 5,379
Total Liabilities 36,662 35,846 34,183 35,744 35,890
Equity 968 866 543 543 543
Retained Earnings 12,382 13,131 9,614 6,741 3,981
Minority Interest 827 819 1,490 1,637 1,790
Total SHE + Minority Int. 14,177 14,816 11,648 8,922 6,314
Total Liabilities & Equity 50,839 50,661 45,831 44,666 42,204
8
Refer to Important disclosures in the last page of this report
Year to 31 Dec 2016A 2017A 2018F 2019F 2020F
Cash Flow
Net Income (Excl.Extraordinary&Min.Int) 1,276 1,302 (2,449) (2,726) (2,608)
Depr. & Amortization 7,865 (4,367) 9,235 9,703 10,167
Changes in Working Capital (1,991) (838) 2,185 (123) (352)
Others 2,648 1,531 1,214 1,450 1,859
Cash Flow From Operating 9,798 (2,372) 10,185 8,304 9,067
Capital Expenditure (4,984) 6,196 (6,863) (7,835) (7,522)
Others 37 (29) 113 27 35
Cash Flow From Investing (4,947) 6,167 (6,750) (7,808) (7,487)
Loans (3,515) (660) (1,125) 790 (465)
Equity 0 0 0 0 0
Dividends 0 (387) (397) 0 0
Others (2,687) (2,701) (2,061) (1,367) (1,349)
Cash Flow From Financing (6,201) (3,748) (3,583) (576) (1,814)
Changes in Cash (1,350) 48 (148) (80) (234)
Financial Ratios
Gross Margin (%) 100.0 100.0 100.0 100.0 100.0
Operating Margin (%) 13.3 13.1 (10.7) (9.3) (8.0)
Pre-Tax Margin (%) 6.2 6.5 (14.4) (16.8) (15.0)
Net Margin (%) 3.8 3.8 (13.9) (11.9) (10.6)
ROA (%) 2.1 2.2 (6.5) (6.3) (6.4)
ROE (%) 8.1 7.8 (23.6) (27.9) (36.2)
ROIC (%) 3.5 3.6 (9.8) (10.3) (10.9)
Acct. Receivables TO (days) 34.3 41.1 56.6 47.0 47.0
Acct. Receivables - Other TO (days) 0.0 0.0 0.0 0.0 0.0
Inventory TO (days) 0.0 0.0 0.0 0.0 0.0
Payable TO (days) 0.0 0.0 0.0 0.0 0.0
Acct. Payables - Other TO (days) 0.0 0.0 0.0 0.0 0.0
Debt to Equity (%) 142.2 131.6 157.8 214.8 296.2
Interest Coverage Ratio (x) 0.6 0.5 (0.8) (0.9) (1.0)
Net Gearing (%) 129.2 120.3 145.5 195.4 272.2
Head Office
PT INDO PREMIER SEKURITAS
Wisma GKBI 7/F Suite 718
Jl. Jend. Sudirman No.28
Jakarta 10210 - Indonesia
p +62.21.5793.1168
f +62.21.5793.1167
INVESTMENT RATINGS
BUY : Expected total return of 10% or more within a 12-month period
HOLD : Expected total return between -10% and 10% within a 12-month period
SELL : Expected total return of -10% or worse within a 12-month period
ANALYSTS CERTIFICATION.
The views expressed in this research report accurately reflect the analysts personal views about any and all of the subject securities or issuers; and no part of the research analyst's compensation was, is, or will be, directly or indirectly, related to the specific recommendations or views expressed in the report.
DISCLAIMERS