Refer to Important disclosures on the last of this report
Stock DataTarget price (Rp) Rp4,000
Prior TP (Rp) Rp4,100
Shareprice (Rp) Rp3,720
Upside/downside (%) +7.5
Sharesoutstanding (m) 99,062
Marketcap. (US$ m) 25,364
Republic of Indonesia 52.1%
Bank of New York Mellon 6.1%
Public 41.8%
Estimate Change; Vs. Consensus 18F 19F
PT Indo Premier Sekuritas [email protected] +62 21 5793 1168
Recovery mostly priced-in
Post-SIM-card-registration recovery mostly priced in.
More uncertainty in Telkomsel’s long-term growth in outer Java
TLKM group’s EBITDA growth might remain moderate
Reduce TP to Rp4,000 (6% premium to +1STD) – Downgrade to Hold
We expect Telkomsel’s growth to slow.
We believe uncertainty in Telkomsel
(Tsel)’s long-term growth outlook in outer Java has increased as Indosat,
accelerating forecast its capex spending in 4G network coverage (ISAT’s target
18F 4G coverage in outer Java at 60% vs. 2Q18 27%) and is looking for ways to
fund aggressive capex in 19F-21F. Although we expect Tsel would remain as
market leader, but its declining competitive advantage in network coverage vs.
peers in outer Java (XL already improve its outer Java’s network earlier than
Indosat) might affect the effectiveness of Telkomsel’s cluster pricing strategy.
Thus, we slightly reduced TLKM’s EBITDA by 2-4% in 22F-28F.
Modest EBITDA growth.
We forecast moderate YoY growth in TLKM’s revenue
and EBITDA growth of +9%YoY and +6%YoY, respectively in 2019F (vs.
+4/-7%YoY in 2018F) due to: 1) Gradual decline in voice and SMS revenue; 2) Margin
pressure from growing data business; 3) More limited pricing increase opportunity
as more players expand 4G network coverage in outer Java.
Limited contribution from fixed broadband.
We still view TLKM’s fixed
broadband business (Indihome) as positive factor for TLKM, considering its market
growth potential, its management and operational readiness to fulfill demand, and
gradually increasing margin. However, we see limitation from Indihome’s strong
growth impact to TLKM Group in near-term as we estimate Indihome’s revenue
contribution at 9-11% in 18F/19F.
Slightly decrease TP by 3% to Rp4,000 - Downgrade to Hold.
Our
DCF-based TP assume WACC of 10.2% (old: 10.1%; see Fig. 9). We slightly reduced
TP by 3% as we revised down 22F-28F EBITDA by 2-4%. We downgrade to Hold
and argue share price might be more volatile given: 1) Telkomsel in last earning
call said further pricing increase might be limited (depend on competition); 2)
Slightly more uncertainty in outer Java’s long-term growth (slightly higher
competition risk). Our TP translates to 19F EV/EBITDA of 9.4x, 6% premium to
+1STD of 8-yr mean.
TLKM trades at 19F EV/EBITDA of 8.6x, near +1STD.
Risks (page 5).
There might still be downslide risk from concern on Telkomsel’s
network gap (leadership strength) in outer Java vs. peers (depends on realization
progress of other telcos’ expansion to outer Java). Upside risk: If network roll-out
(capex realization) from competitors, incl. Indosat, is significantly lower than its
target; no sufficient funding (balance sheet limitation) for competitor(s) to
support aggressive capex.
Telkom
(
TLKM IJ
)
28 November 2018
Company Update
HOLD
(from Buy)
Year To 31 Dec 2016A 2017A 2018F 2019F 2020F
Revenue (RpBn) 116,333 128,256 133,250 144,567 158,844
EBITDA (RpBn) 59,498 64,609 60,255 63,591 69,145
Source: TLKM, IndoPremier Share Price Closing as of : 28-November-2018
2
Refer to Important disclosures on the last of this report
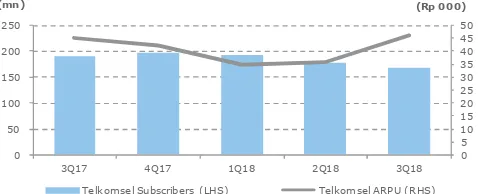
Fig. 1: Tsel’s subscriber base and ARPU Fig. 2: Telkomsel’s data traffic vs. effective data yield
0
Telkomsel Subscribers (LHS) Telkomsel ARPU (RHS)
We expect subscriber base still slightly decline in 4Q18F, but ARPU to increase as subscriber adjusting behaviour to operators’ marketing and pricing strategy post- registration of prepaid card.
0
2Q17 3Q17 4Q17 1Q18 2Q18 3Q18
(Rp/MB) (PB)
Data traffic (LHS) Effective yield (RHS)
Source: Company, IndoPremier Source: Company, IndoPremier
Fig. 4: TLKM’s Indihome Subscribers and ARPU Fig. 5: TLKM’s expenses excl. D&A (3Q18)
0
3Q17 4Q17 1Q18 2Q18 3Q18
(Rp 000) (mn)
Indihome Subscriber Indihome ARPU
Personnel
Source: Company, IndoPremier Source: Company, IndoPremier
Fig. 5: 2015-20F Tsel’s revenue based on service type Fig. 6: TLKM’s hist-fw. EV/EBITDA (adj. to ownership in Tsel)
0
2015 2016 2017 2018F 2019F 2020F
(
Voice Data SMS Digital service Others
4
TLKM Fw-EV/EBITDA Fw-EV/EBITDA avg (LHS)
Fw-EV/EBITDA + 1 STD (LHS) Fw-EV/EBITDA - 1 STD (LHS)
23 Nov 2018 at 9.0x
-2STD 4.6 -1STD 6.0 Avg. 7.5 +1STD 8.9 +2STD 10.3
3
Refer to Important disclosures on the last of this report
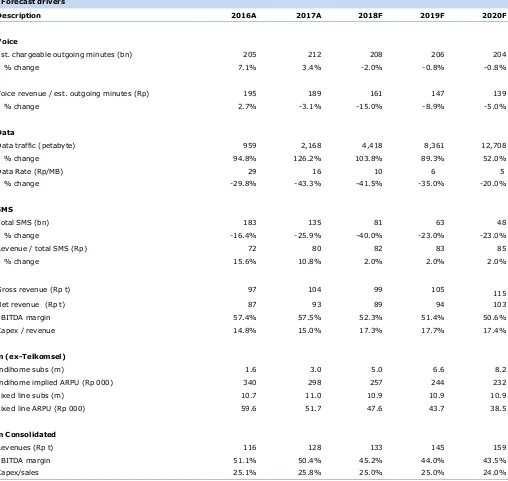
Fig. 7: Forecast drivers4
Refer to Important disclosures on the last of this report
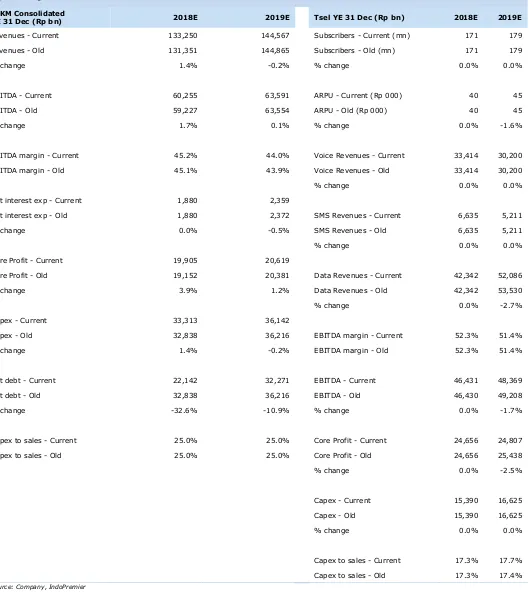
Fig. 8: Change in estimates5
Refer to Important disclosures on the last of this report
Fig. 9: Risk-free-rate and terminal EV/EBITDA assumptionsRisk-Free rate 8.0%
Equity market risk premium 6.0%
Beta 0.80 (old 0.77)
Cost of equity 12.8% (old 12.6%)
Post-tax cost of debt 6.0%
Debt/Capital ratio 38%
WACC 10.2% (old. 10.1%)
Terminal EV/EBITDA Telkomsel: 8x
Non-Telkomsel: 6x
Note: If we use old WACC of 10.1%, our TP would increase by 2% to Rp4,200, assuming all else the same.
Source: Company, IndoPremier, Bloomberg
Risks
Upside risk:
Data revenue growth (traffic and pricing); Telkomsel’s Java
monetization; Indihome’s productivity and monetization; cost saving; if
aggressive (capex realization) network roll-out from competitors, incl. Indosat, is
significantly lower than those competitors’ target; no sufficient funding available
(balance sheet limitation) for competitor(s) to support aggressive capex.
6
Refer to Important disclosures on the last of this report
Year To 31 Dec (RpBn) 2016A 2017A 2018F 2019F 2020F
Income Statement
Net Revenue 116,333 128,256 133,250 144,567 158,844
Cost of Sales 0 0 0 0 0
Gross Profit 116,333 128,256 133,250 144,567 158,844
SG&A Expenses (75,367) (84,093) (93,014) (102,822) (113,382)
Operating Profit 40,966 44,163 40,236 41,745 45,462
Net Interest (1,094) (1,335) (1,880) (2,414) (3,174)
Cash & Equivalent 31,238 27,318 22,138 20,173 18,333
Receivable 7,900 9,564 9,741 10,568 11,612
Inventory 584 631 656 711 781
Other Current Assets 7,979 10,048 10,283 10,991 12,009
Total Current Assets 47,701 47,561 42,817 42,443 42,734
Fixed Assets - Net 114,498 130,171 144,746 160,495 176,560
Goodwill 0 0 0 0 0
Non Current Assets 15,565 18,604 29,292 37,150 47,923
Total Assets 179,611 198,484 219,352 242,993 270,596
ST Loans 911 2,289 1,401 1,744 1,916
Payable 13,690 15,791 0 17,711 19,460
Other Payables 20,640 22,087 22,574 24,393 26,722
Current Portion of LT Loans 4,521 5,209 6,406 3,053 4,284
Total Current Liab. 39,762 45,376 47,268 46,901 52,382
Long Term Loans 26,367 27,974 37,568 49,515 56,231
Other LT Liab. 7,938 13,004 15,560 20,041 26,427
Total Liabilities 74,067 86,354 100,397 116,457 135,040
Equity 7,769 7,817 8,031 8,031 8,031
Retained Earnings 76,615 84,896 88,192 93,842 100,426
Minority Interest 21,160 19,417 22,732 24,663 27,099
Total SHE + Minority Int. 105,544 112,130 118,955 126,535 135,555
Total Liabilities & Equity 179,611 198,484 219,352 242,993 270,596
7
Refer to Important disclosures on the last of this report
Year to 31 Dec 2016A 2017A 2018F 2019F 2020F
Cash Flow
Net Income (Excl.Extraordinary&Min.Int) 29,172 32,701 28,535 29,261 31,460
Depr. & Amortization 4,628 3,479 18,738 20,393 22,058
Changes in Working Capital 4,154 (336) 708 930 1,788
Others (10,123) (9,290) (6,746) (7,380) (7,181)
Cash Flow From Operating 27,831 26,554 41,235 43,203 48,125
Capital Expenditure (18,237) (22,191) (44,000) (44,001) (48,895)
Others 3,023 431 3,077 609 453
Cash Flow From Investing (15,214) (21,760) (40,923) (43,392) (48,442)
Loans (2,813) 3,673 9,903 8,937 8,119
Equity 1,996 0 (2,541) 0 0
Dividends (13,547) (16,609) (14,929) (15,434) (16,513)
Others 3,291 414 6,456 3,970 5,784
Cash Flow From Financing (11,073) (12,522) (1,110) (2,527) (2,610)
Changes in Cash 1,544 (7,728) (799) (2,715) (2,928)
Financial Ratios
Gross Margin (%) 100.0 100.0 100.0 100.0 100.0
Operating Margin (%) 35.2 34.4 30.2 28.9 28.6
Pre-Tax Margin (%) 32.8 33.3 28.8 27.2 26.6
Net Margin (%) 16.6 17.3 14.9 14.2 13.9
ROA (%) 11.2 11.7 9.5 8.9 8.6
ROE (%) 19.5 20.3 17.2 16.8 16.8
ROIC (%) 18.6 19.3 15.7 14.5 14.0
Acct. Receivables TO (days) 24.7 24.9 26.4 25.6 25.5
Acct. Receivables - Other TO (days) 0.0 0.0 0.0 0.0 0.0
Inventory TO (days) 0.0 0.0 0.0 0.0 0.0
Payable TO (days) 0.0 0.0 0.0 0.0 0.0
Acct. Payables - Other TO (days) 0.0 0.0 0.0 0.0 0.0
Debt to Equity (%) 30.1 31.6 38.1 42.9 46.1
Interest Coverage Ratio (x) 0.1 0.1 0.1 0.1 0.1
Net Gearing (%) 1.9 9.2 19.5 27.0 32.5
Head Office
PT INDO PREMIER SEKURITAS
Wisma GKBI 7/F Suite 718
Jl. Jend. Sudirman No.28
Jakarta 10210 - Indonesia
p +62.21.5793.1168
f +62.21.5793.1167
INVESTMENT RATINGS
BUY : Expected total return of 10% or more within a 12-month period
HOLD : Expected total return between -10% and 10% within a 12-month period
SELL : Expected total return of -10% or worse within a 12-month period
ANALYSTS CERTIFICATION.
The views expressed in this research report accurately reflect the analysts personal views about any and all of the subject securities or issuers; and no part of the research analyst's compensation was, is, or will be, directly or indirectly, related to the specific recommendations or views expressed in the report.
DISCLAIMERS