To subscribe to our Daily Focus, please contact us at [email protected]
Mirae Asset Sekuritas Indonesia
16 April 2020
Market Index
Last Trade Chg (%) MoM YoY
JCI 4,625.9 -1.7 0.3 -27.4
MSCI Indonesia 15.3 -3.9 -12.1 -39.1
MSCI EM 888.1 -0.9 7.6 -18.0
HANG SENG 24,145.3 -1.2 5.9 -18.9
KOSPI 1,825.8 1.7 3.1 -18.6
FTSE 5,597.7 -3 12.4 -22.5
DJIA 23,504.4 -1.9 18.6 -9.5
NASDAQ 8,393.2 -1.4 23.3 6.4
Valuation
2018F P/E (x) P/B (x) ROE (%)
JCI 11.9 1.5 16.0
Key Rates
Last Trade Chg (bps) MoM YoY
BI 7-Day RR 4.50 0 0 -150
3yr 6.92 -16 90 -11
10yr 7.94 -3 54 32
FX
Last Trade Chg (%) MoM YoY
USD/IDR 15,575.0 -0.4 4.8 11.2
USD/KRW 1,217.8 0.7 -0.7 7.5
USD/JPY 107.5 0.2 1.5 -4.1
USD/CNY 7.1 0.0 0.8 5.1
Commodities
Last Trade Chg (%) MoM YoY
WTI 19.9 -1.2 -30.8 -62.1
Gold 1,717.0 -0.6 13.4 34.5
Coal 62.3 -0.8 -5.4 -26.2
Palm Oil 2,312.0 0.0 0.4 10.1
Rubber 120.5 0.0 -9.5 -15.2
Nickel 11,773.0 -1.0 -4.4 -9.4
Copper 5,163.0 2.9 -5.4 -20.3
Tin 15,093.0 -2.4 -3.1 -24.9
JCI Index VS MSCI Emerging Markets
Market commentary
Hariyanto Wijaya CFA, CPA (Aust), CMT ([email protected]) IHSG turun 1.7% dipimpin oleh kerugian di counter bank karena investor mulai faktor IMF FY20 Indonesia memperlambat pertumbuhan ekonomi hanya 0.5%, sementara investor asing terus melanjutkan penjualan bersih Rp379milyar kemarin.
Neraca perdagangan Indonesia di bulan Maret berada di atas ekspektasi. Namun, ekonom kami menganggapnya sebagian karena tujuan ekspor dan impor utama Indonesia masih belum mengalami lockdown pada bulan Maret, yang dapat berarti bahwa neraca perdagangan Indonesia pada bulan April mungkin tidak sebaik di bulan Maret. Penjualan mobil domestik Indonesia turun 15% di bulan Maret. Kami berharap IHSG dalam konsolidasi hari ini.
Indeks AS ditutup lebih rendah pada hari Rabu karena sentimen investor terguncang oleh hasil pendapatan mengecewakan 1Q20 dan data ekonomi suram. Beberapa bank terbesar di Wall Street melaporkan penurunan laba sekitar 40% selama kuartal pertama, mengutip cadangan kas yang cukup besar untuk kemungkinan defaults.
Penjualan ritel di AS merosot 8.7% pada bulan Maret, kontraksi terburuk dalam sejarah. The Fed merilis Beige Book-nya, yang menunjukkan ekonomi AS berkontraksi "sharply and abruptly".
HOKI – Ups and downs in the changing situation Andy Wibowo Gunawan ([email protected])
Kami tetap mempertahankan estimasi keuangan HOKI di 2020-21F dan juga mempertahankan target price untuk HOKI di Rp1.140. Kami melihat permintaan beras di modern channel lebih kuat dibandingkan rata-ratanya, tetapi kami kuatir permintaan beras di traditional channel menurun karena efek social distancing serta kami juga kuatir orang-orang mid-to-low income akan switching ke beras medium dari premium. Kami melihat satu-satunya upside risk hanya dari momentum puasa dan lebaran idul fitri saja.
Changing behavior of Indonesian people
Menurut Jakpat, 61% dari 1.721 responden menghindari berbelanja di mall, sementara 46% dari mereka tidak makan di restoran lagi. Lebih lanjut lagi, kami melihat orang Indonesia banyak melakukan pembelian barang kebutuhan pokok sejak diimplementasikannya social distancing.
Strong in modern channel but…
Sepanjang mystery shopping kami, orang-orang mid-to-up income banyak membeli beras HOKI di modern channel. Namun, kami kuatir permintaan beras di traditional channel akan mengalami penurunan seiring dengan banyaknya warung-warung makan yang tutup. Berdasarkan pengamatan kami, warung-warung makan tersebut adalah driver permintaan beras di traditional channel. Selanjutnya, kami juga kuatir konsumen dari sektor informal akan switch dari beras premium ke medium karena banyaknya PHK. Sementara itu, kami melihat bahwa risiko naiknya permintaan beras HOKI akan datang hanya dari bulan puasa dan acara Idul Fitri di 2Q.
Financial outlook
Dengan tidak berubahnya asumsi kami, kami memperkirakan laba bersih HOKI untuk 2020-21F masing-masing akan mencapai Rp124 miliar dan Rp129 miliar (+19,4% dan +4,3% YoY).
Maintain target price at IDR1,140
Seiring kami mempertahankan estimasi keuangan HOKI, kami mempertahankan target harga kami untuk HOKI di Rp1.140/saham. Kami menggunakan metodologi campuran (DCF dan P/E) karena kami berpikir bahwa estimasi keuangan HOKI akan lebih mudah diprediksi di masa mendatang.
550 800 1,050 1,300 1,550
4,000 5,000 6,000 7,000
01/16 07/16 01/17 07/17 01/18 07/18 01/19
JCI (pt)
(pt) (pt)
(pt)
16 April 2020
2 Embun Pagi
Mirae Asset Sekuritas Indonesia
Mirae Asset Sekuritas Indonesia cartoon
16 April 2020
3 Embun Pagi
Mirae Asset Sekuritas Indonesia
Local flashes
MTLA: Metropolitan Land (MTLA) catatkan marketing sales Rp 250 miliar di kuartal I 2020. PT Metropolitan Land Tbk catatkan marketing sales Rp 250 miliar sepanjang tiga bulan pertama ini. Lambatnya realisasi marketing sales lantaran belum adanya peluncuran proyek baru. Direktur Metropolitan Land Olivia Surodjo menyebutkan pada awal tahun ini sebetulnya pihaknya akan meluncurkan klaster baru lantaran sudah banyak menerima Nomor Urut Pemesanan (NUP). Sayangnya, rencana peluncuran tersebut tertunda akibat virus corona. "Harus ditunda karena social distancing dan kami lihat akan terdorong ke semester kedua (Kontan)
IPCC: Kinerja layanan bongkar muat kendaraan alat berat IPCC masih positif. Layanan operasional bongkar muat kendaraan di Terminal PT Indonesia Kendaraan Terminal Tbk (IPCC) masih tetap berjalan normal. Kali ini pada segmen Alat Berat, layanan bongkar muat sepanjang triwulan pertama 2020 kembali melanjutkan tren positifnya secara tahunan. Sekretaris Perusahaan IPCC Reza Priyambada menjelaskan, pada bulan Maret 2020, jumlah alat berat yang ditangani mencapai angka 529 unit untuk ekspor dan 459 unit untuk impor di Lapangan Internasional.
(Kontan)
SIDO: SIDO bagi dividen Rp 401,87 miliar atau Rp 27 per saham, ini detail jadwalnya. Lewat rapat umum pemegang saham (RUPS), PT Industri Jamu dan Farmasi Sido Muncul Tbk (SIDO) memutuskan untuk membagikan dividen sebesar Rp 27 per saham. Secara total, dividen yang akan dibagikan mencapai Rp 401,87 miliar atau 49,75% dari total laba bersih tahun buku 2019 sebesar Rp 807,68 miliar. Dilansir dari keterbukaan informasi (14/4) Sekretaris Perusahaan Sido Muncul Tiur Simamora menjabarkan detail agenda pembagian dividen. (Kontan)
TOTO: Tahun lalu laba Surya Toto Indonesia (TOTO) menyusut lebih dari 50%, ini pemicunya. Produsen produk saniter, fitting, dan peralatan sistem dapur, PT Surya Toto Indonesia Tbk (TOTO) membukukan penurunan laba tahun berjalannya hingga 59,5% year on year (yoy) menjadi Rp 140,59 miliar di sepanjang tahun lalu.
Penurunan laba ini dipicu karena penjualan bersih yang turun 7,71% menjadi Rp 2,05 triliun. Adapun segmen Fitting yang berkontribusi paling besar ke pendapatan TOTO kerap mengalami penurunan 12,6% menjadi Rp 1,01 triliun. (Kontan)
IKAN, DADA: Era Mandiri (IKAN) dan Diamond Citra (DADA) sudah sepenuhnya menyerap dana IPO. Beberapa emiten anyar tercatat telah menggunakan seluruh dana yang terkumpul dari penawaran umum perdana atau initial public offering (IPO). Salah satunya adalah PT Era Mandiri Cemerlang Tbk (IKAN).
Direktur Utama Era Mandiri Cemerlang Johan Rose mengatakan, IKAN telah menggunakan 100% dana hasil IPO untuk ekspansi. “Sebesar 100% dana hasil IPO sudah direalisasikan sesuai peruntukannya. Emiten pendatang baru lainnya yang telah menggunakan 100% dana hasil IPO adalah PT Diamond Citra Propertindo Tbk (DADA).
Emiten yang resmi melantai di Busa Efek Indonesia (BEI) pada 14 Februari 2020 ini meraup dana segar hingga Rp 218,99 miliar dari hasil IPO. "DADA sudah melaksanakan penyetoran modal disetor terhadap anak perusahaan, yakni PT Arba Propertindo," ujar Presiden Direktur Diamond Citra Propertindo Adam Bilfaqih (Kontan)
16 April 2020
4 Embun Pagi
Mirae Asset Sekuritas Indonesia
Technical analysis
Tasrul +62-21-5088-7000 [email protected]
Jakarta Composite Index (JCI) Daily – Consolidation
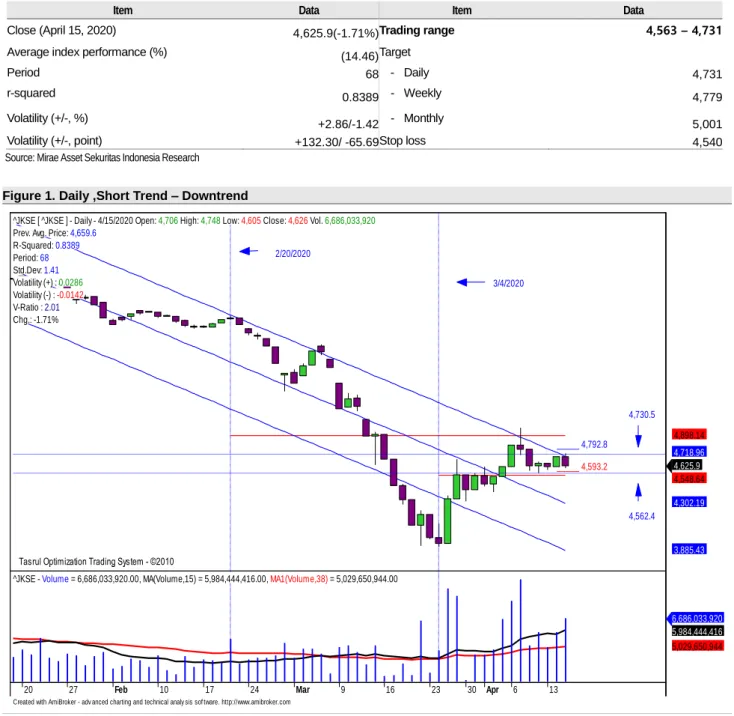
IHSG akan coba naik mendekati normal upper band pada downtrend channel jangka pendek.
IHSG saat ini berada dalam pola downtrend channel jangka pendek dimana trend yang terbentuk saat ini masih relatif valid (r-squared = 0.8389) sejak 68 hari terakhir dimana bergerak normal dalam rentang +/-1.41 std.deviasi dari centerline. IHSG bergerak di luar pergerakan normal sekitar +16.1 % atau sekitar 10 bar chart. Rata-rata volatilitas normal pergerakan IHSG secara harian saat ini sejak naik dari 4 Maret 2020 antara +2.86% / -1.42% atau +132.30/-65.69 point (rata-rata pergerakan normal positif / negatif selama periode analisis) sebagaimana terlihat pada Figure 1.
Summary
Item Data Item Data
Close (April 15, 2020) 4,625.9(-1.71%) Trading range 4,563 – 4,731
Average index performance (%) (14.46) Target
Period 68 - Daily 4,731
r-squared 0.8389 - Weekly 4,779
Volatility (+/-, %) +2.86/-1.42 - Monthly 5,001
Volatility (+/-, point) +132.30/ -65.69 Stop loss 4,540
Source: Mirae Asset Sekuritas Indonesia Research
Figure 1. Daily ,Short Trend – Downtrend
4 - 6,161 Source: Mirae Asset Sekuritas Indonesia Research
Created with AmiBroker - adv anced charting and technical analy sis sof tware. http://www.amibroker.com
_____ 4,792.8 _____ 4,593.2
Tasrul Optimization Trading System - ©2010 Tasrul Optimization Trading System - ©2010 Tasrul Optimization Trading System - ©2010
3/4/2020 2/20/2020
4,730.5
4,562.4
^JKSE [ ^JKSE ] - Daily - 4/15/2020 Open: 4,706 High: 4,748 Low: 4,605 Close: 4,626 Vol. 6,686,033,920 Prev. Avg. Price: 4,659.6
R-Squared: 0.8389 Period: 68 Std.Dev: 1.41 Volatility (+) : 0.0286 Volatility (-) : -0.0142 V-Ratio : 2.01 Chg.: -1.71%
4,625.9 4,548.64 4,302.19
3,885.43 4,718.96 4,898.14
20 27 Feb 10 17 24 Mar 9 16 23 30 Apr 6 13
^JKSE - Volume = 6,686,033,920.00, MA(Volume,15) = 5,984,444,416.00, MA1(Volume,38) = 5,029,650,944.00
6,686,033,920 5,984,444,416 5,029,650,944
16 April 2020
5 Embun Pagi
Mirae Asset Sekuritas Indonesia
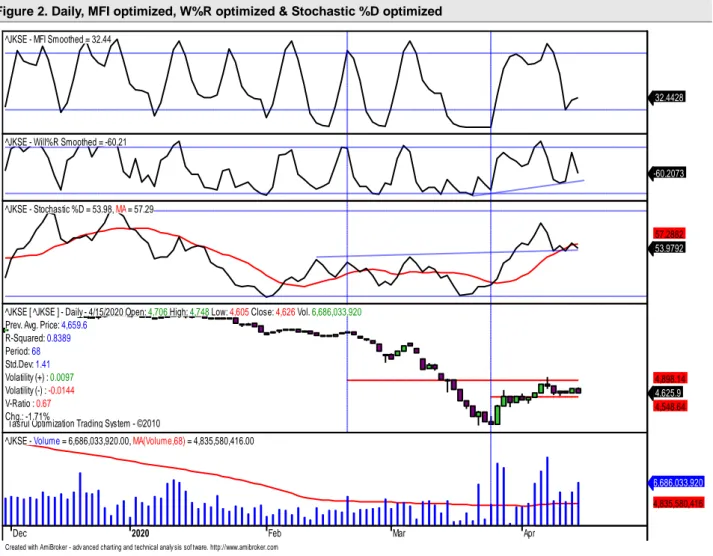
Aliran dana keluar dan volatilitas indeks turun masih terlihat namun sementara akan terbatas
Pada Figure 2, terlihat dari hasil optimalisasi terakhir pada periode daily.Indikator MFI optimized masih cenderung naik, sementara itu indikator W%R optimized dan indikator Stochastic%D optimized akan menguji support trendline. Pada periode weekly indikator MFI optimized dan indikator W%R optimized coba naik lebih lanjut Daily support di 4,563 dan dailyresistance di 4,731, Cut loss level di 4,540.
Figure 2. Daily, MFI optimized, W%R optimized & Stochastic %D optimized X` x`x`
Source: Mirae Asset Sekuritas Indonesia Research
Created with AmiBroker - adv anced charting and technical analy sis sof tware. http://www.amibroker.com
^JKSE - MFI Smoothed = 32.44
32.4428
^JKSE - Will%R Smoothed = -60.21
-60.2073
^JKSE - Stochastic %D = 53.98, MA = 57.29
53.9792 57.2882
Tasrul Optimization Trading System - ©2010 Tasrul Optimization Trading System - ©2010
^JKSE [ ^JKSE ] - Daily - 4/15/2020 Open: 4,706 High: 4,748 Low: 4,605 Close: 4,626 Vol. 6,686,033,920 Prev. Avg. Price: 4,659.6
R-Squared: 0.8389 Period: 68 Std.Dev: 1.41 Volatility (+) : 0.0097 Volatility (-) : -0.0144 V-Ratio : 0.67 Chg.: -1.71%
4,625.9 4,548.64 4,898.14
Dec 2020 Feb Mar Apr
^JKSE - Volume = 6,686,033,920.00, MA(Volume,68) = 4,835,580,416.00
6,686,033,920 4,835,580,416
16 April 2020
6 Embun Pagi
Mirae Asset Sekuritas Indonesia
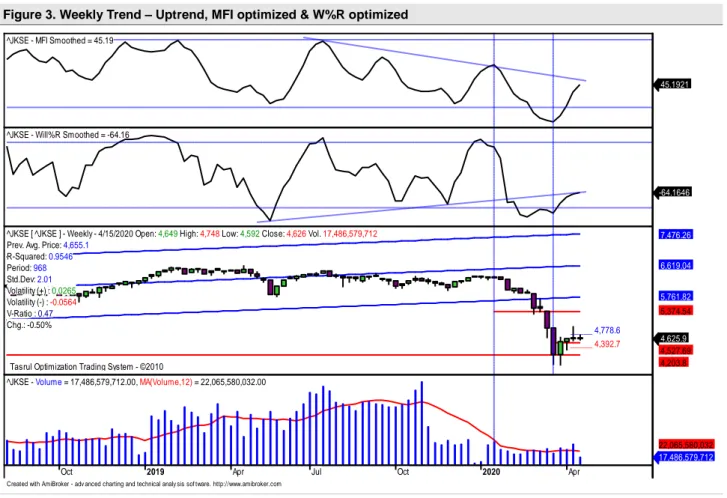
Figure 3. Weekly Trend – Uptrend, MFI optimized & W%R optimized A
Source: Mirae Asset Sekuritas Indonesia Research
IHSG akan coba bertahan diatas rata-rata masing masing periode
Pada pergerakkan daily, rata-rata koreksi normal sekitar -2.08% saat ini di -1.71%.
Sementara itu pada pergerakan weekly koreksi normal rata-rata sekitar -5.64%
sementara saat ini di level -0.50%. Pada pergerakan monthly saat ini di level +1.92%, normal kenaikkan di +7.20%. Dengan demikian diperkirakan potensi koreksi masih terlihat namun relatif terbatas (konsolidasi). Pada Figure 4,5 dan 6 terlihat perkiraan normal trading range untuk masing-masig periode.
Figure 4. Daily : 4,563 – 4,731 Figure 5. Weekly : 4,393– 4,779 Figure 6. Monthly : 4,298 – 5,001
x x x`
Source: Mirae Asset Sekuritas Indonesia Research Source: Mirae Asset Sekuritas Indonesia Research Source: Mirae Asset Sekuritas Indonesia Research
Created with AmiBroker - adv anced charting and technical analy sis sof tware. http://www.amibroker.com _____ 4,730.5
_____ 4,562.4 4,593.2 4,792.8
^JKSE [ ^JKSE ] - Daily - 4/15/2020 Open:
Prev. Avg. Price: 4,659.6 R-Squared: 0.8389 Period: 68 Std.Dev: 1.41 Volatility (+) : 0.0152 Volatility (-) : -0.0208 V-Ratio : 0.73 Chg.: -1.71%
4,625.9
Apr 6 13
^JKSE - Volum e = 6,686,033,920.00
6,686,033,920
Created with AmiBroker - adv anced charting and technical analy sis sof tware. http://www.amibroker.com _____ 4,778.6
_____ 4,392.7
^JKSE [ ^JKSE ] - Weekly - 4/15/2020 Open:
Prev. Avg. Price: 4,655.1 R-Squared: 0.9546 Period: 968 Std.Dev: 2.01 Volatility (+) : 0.0265 Volatility (-) : -0.0564 V-Ratio : 0.47 Chg.: -0.50%
4,625.9
Mar Apr 15
^JKSE - Volum e = 17,486,579,712.00
17,486,579,712
Created with AmiBroker - adv anced charting and technical analy sis sof tware. http://www.amibroker.com _____ 5,001.0
_____ 3,930.5 4,297.8
^JKSE [ ^JKSE ] - Monthly - 4/15/2020 Open:
Prev. Avg. Price: 4,665.0 R-Squared: 0.9513 Period: 230 Std.Dev: 1.98 Volatility (+) : 0.0720 Volatility (-) : -0.1575 V-Ratio : 0.46 Chg.: 1.92%
4,625.9
Jul Oct 2020Apr
^JKSE - Volum e = 61,021,495,296.00
61,021,495,296 Created with AmiBroker - adv anced charting and technical analy sis sof tware. http://www.amibroker.com
^JKSE - MFI Smoothed = 45.19
45.1921
^JKSE - Will%R Smoothed = -64.16
-64.1646
_____ 4,778.6 _____ 4,392.7 Tasrul Optimization Trading System - ©2010
Tasrul Optimization Trading System - ©2010 Tasrul Optimization Trading System - ©2010 Tasrul Optimization Trading System - ©2010
^JKSE [ ^JKSE ] - Weekly - 4/15/2020 Open: 4,649 High: 4,748 Low: 4,592 Close: 4,626 Vol. 17,486,579,712 Prev. Avg. Price: 4,655.1
R-Squared: 0.9546 Period: 968 Std.Dev: 2.01 Volatility (+) : 0.0265 Volatility (-) : -0.0564 V-Ratio : 0.47 Chg.: -0.50%
4,625.9 4,527.69 4,203.8 5,374.54 5,761.82 6,619.04 7,476.26
Oct 2019 Apr Jul Oct 2020 Apr
^JKSE - Volume = 17,486,579,712.00, MA(Volume,12) = 22,065,580,032.00
17,486,579,712 22,065,580,032
16 April 2020
7 Embun Pagi
Mirae Asset Sekuritas Indonesia
Stocks on our focus list
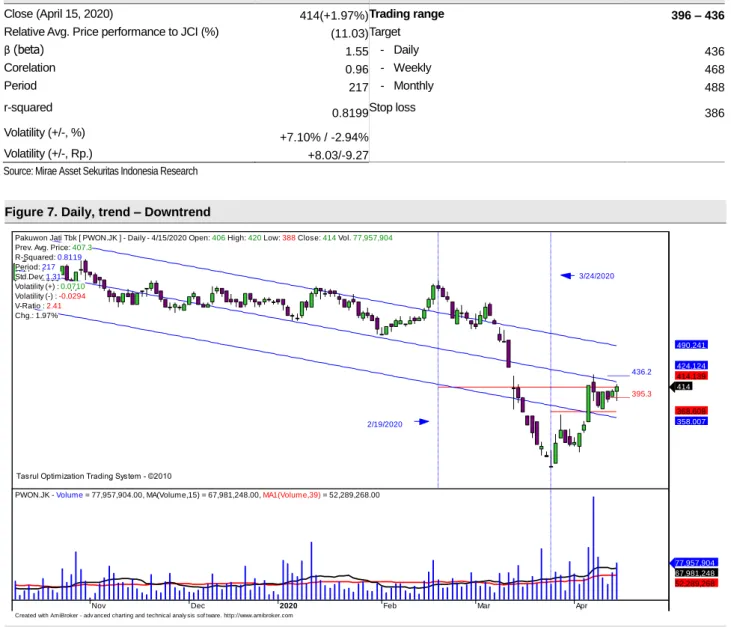
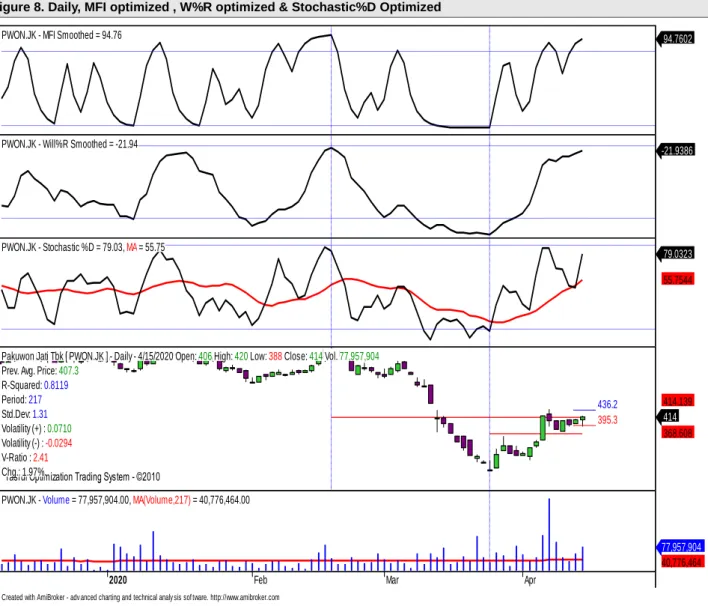
Pakuwon Jati (PWON) – Daily ,Sell on Strength Harga akan menguji center line pada downtrend channel
Secara umum harga saham ini mulai masih berada dalam pola downtrend channel pada pergerakan daily dimana trend yang terbentuk saat ini yang masih relatif kuat (r-squared = 0.8119 selama 217 hari terakhir dan bergerak normal dalam rentang +/- 1.31 std.deviasi dari center line. Harga keluar dari pergerakan normal sekitar 18.81%
(sekitar 40 bar chart ). Rata-rata volatilitas normal pergerakan harga saat ini sejak harga bergerak naik dari 24 Maret 2020 yakni +1.94% /-2.24% atau +8.03 rupiah /- 9.27 rupiah rata-rata pergerakan normal positif / negatif, selama periode analisis).
Volume rata-rata transaksi sisi demand masih lebih besar dari sisi supply, dengan demikian masih terlihat adanya akumulasi beli sejak naik dari tanggal diatas sebagaimana terlihat pada Figure 7.
Summary
Item Data Item Data
Close (April 15, 2020) 414(+1.97%) Trading range 396 – 436
Relative Avg. Price performance to JCI (%) (11.03) Target
β (beta) 1.55 - Daily 436
Corelation 0.96 - Weekly 468
Period 217 - Monthly 488
r-squared 0.8199 Stop loss 386
Volatility (+/-, %) +7.10% / -2.94%
Volatility (+/-, Rp.) +8.03/-9.27
Source: Mirae Asset Sekuritas Indonesia Research
Figure 7. Daily, trend – Downtrend
Source: Mirae Asset Sekuritas Indonesia Research
Created with AmiBroker - adv anced charting and technical analy sis sof tware. http://www.amibroker.com
_____ 436.2 _____ 395.3
Tasrul Optimization Trading System - ©2010 Tasrul Optimization Trading System - ©2010 Tasrul Optimization Trading System - ©2010
3/24/2020
2/19/2020 Pakuwon Jati Tbk [ PWON.JK ] - Daily - 4/15/2020 Open: 406 High: 420 Low: 388 Close: 414 Vol. 77,957,904 Prev. Avg. Price: 407.3
R-Squared: 0.8119 Period: 217 Std.Dev: 1.31 Volatility (+) : 0.0710 Volatility (-) : -0.0294 V-Ratio : 2.41 Chg.: 1.97%
414
368.608 358.007 414.139 424.124 490.241
Nov Dec 2020 Feb Mar Apr
PWON.JK - Volume = 77,957,904.00, MA(Volume,15) = 67,981,248.00, MA1(Volume,39) = 52,289,268.00
77,957,904 67,981,248 52,289,268
16 April 2020
8 Embun Pagi
Mirae Asset Sekuritas Indonesia
Aliran dana masuk dan volatilitas harga naik masih terlihat
Pada Figure 8, terlihat dari hasil optimalisasi. Indikator MFI optimized, indikator indikator W%R optimized dan Stochastic%D optimized masih bergerak naik. Daily support di 396 sementara itu daily resistance di 436 Cut loss level di 386.
Figure 8. Daily, MFI optimized , W%R optimized & Stochastic%D Optimized
Source: Mirae Asset Sekuritas Indonesia Research
Created with AmiBroker - adv anced charting and technical analy sis sof tware. http://www.amibroker.com
PWON.JK - MFI Smoothed = 94.76 94.7602
PWON.JK - Will%R Smoothed = -21.94 -21.9386
PWON.JK - Stochastic %D = 79.03, MA = 55.75
79.0323 55.7544
_____ 436.2 _____ 395.3
Tasrul Optimization Trading System - ©2010 Tasrul Optimization Trading System - ©2010
Pakuwon Jati Tbk [ PWON.JK ] - Daily - 4/15/2020 Open: 406 High: 420 Low: 388 Close: 414 Vol. 77,957,904 Prev. Avg. Price: 407.3
R-Squared: 0.8119 Period: 217 Std.Dev: 1.31 Volatility (+) : 0.0710 Volatility (-) : -0.0294 V-Ratio : 2.41 Chg.: 1.97%
414 368.608 414.139
2020 Feb Mar Apr
PWON.JK - Volume = 77,957,904.00, MA(Volume,217) = 40,776,464.00
77,957,904 40,776,464
16 April 2020
9 Embun Pagi
Mirae Asset Sekuritas Indonesia
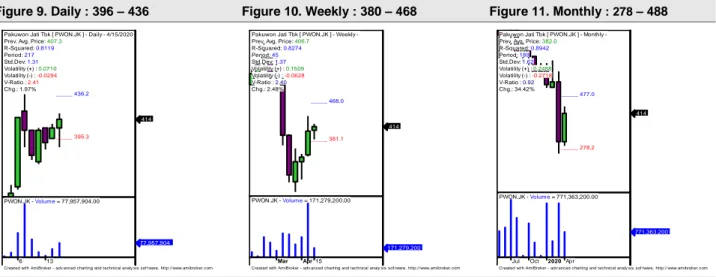
Harga akan coba naik dan bertahan diatas rata-rata pada masing-masing periode.
Pada pergerakan daily rata-rata kenaikkan normal sekitar +7.10% saat ini di +1.97%.
Sementara itu pada pergerakan weekly kenaikkan normal rata-rata sekitar +15.09%, sementara saat ini di level +2.48%. Pada pergerakan monthly saat ini di level +34.42%, normal kenaikkan di +24.88%. Dengan demikian diperkirakan potensi kenaikkan masih terlihat meskipun terbatas pada pergerakkan daily.Figure 9,10 dan 11 terlihat perkiraan normal trading range untuk masing-masing periode.
Figure 9. Daily : 396 – 436 Figure 10. Weekly : 380 – 468 Figure 11. Monthly : 278 – 488
x` x`x`
Source: Mirae Asset Sekuritas Indonesia Research Source: Mirae Asset Sekuritas Indonesia Research Source: Mirae Asset Sekuritas Indonesia Research
Created with AmiBroker - adv anced charting and technical analy sis sof tware. http://www.amibroker.com _____ 436.2
_____ 395.3 Pakuwon Jati Tbk [ PWON.JK ] - Daily - 4/15/2020 Prev. Avg. Price: 407.3
R-Squared: 0.8119 Period: 217 Std.Dev: 1.31 Volatility (+) : 0.0710 Volatility (-) : -0.0294 V-Ratio : 2.41 Chg.: 1.97%
414
6 13
PWON.JK - Volume = 77,957,904.00
77,957,904
Created with AmiBroker - adv anced charting and technical analy sis sof tware. http://www.amibroker.com _____ 468.0
_____ 381.1 Pakuwon Jati Tbk [ PWON.JK ] - Weekly - Prev. Avg. Price: 406.7 R-Squared: 0.8274 Period: 45 Std.Dev: 1.37 Volatility (+) : 0.1509 Volatility (-) : -0.0628 V-Ratio : 2.40 Chg.: 2.48%
414
Mar Apr 15 PWON.JK - Volume = 171,279,200.00
171,279,200
Created with AmiBroker - adv anced charting and technical analy sis sof tware. http://www.amibroker.com _____ 477.0
_____ 278.2 Pakuwon Jati Tbk [ PWON.JK ] - Monthly - Prev. Avg. Price: 382.0
R-Squared: 0.8942 Period: 189 Std.Dev: 1.62 Volatility (+) : 0.2488 Volatility (-) : -0.2718 V-Ratio : 0.92 Chg.: 34.42%
414
Jul Oct 2020 Apr PWON.JK - Volume = 771,363,200.00
771,363,200
16 April 2020
10 Embun Pagi
Mirae Asset Sekuritas Indonesia
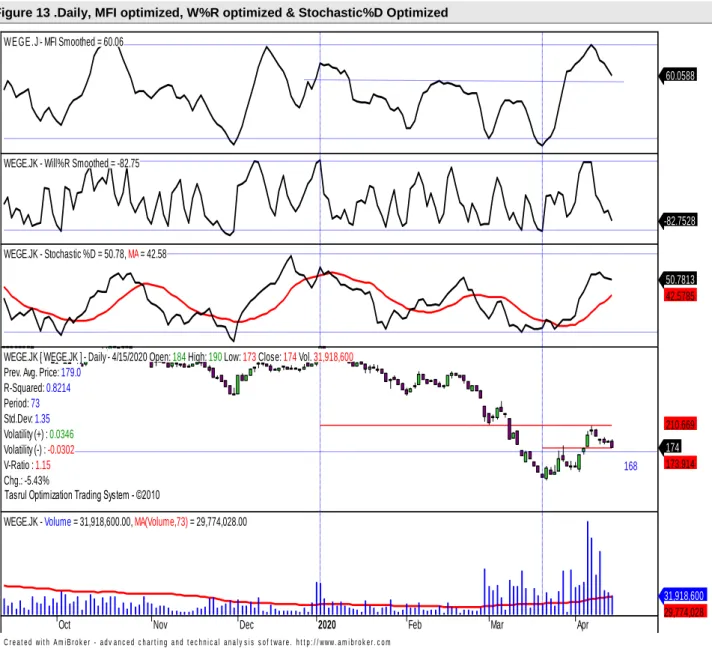
Wijaya Karya Bangunan Gedung (WEGE) –Daily ,Buy on Weakness
Harga akan coba naik dan tembus normal upper band pada down trend channel.
Secara umum harga saham ini berada dalam pola downtrend channel pada pergerakan daily dimana trend yang terbentuk saat ini masih relatif kuat (r-squared = 0.8214) selama 73 hari terakhir dan bergerak normal dalam rentang +/-1.35 std.deviasi dari center line. Harga keluar dari pergerakan normal sekitar 17.86% (sekitar 13 bar chart ). Rata-rata volatilitas normal pergerakan harga ini sejak harga bergerak naik dari 19 Maret 2020 antara +3.40%
/-3.05% atau +5.92 rupiah / -5.31 rupiah rata-rata pergerakan normal positif / negatif, selama periode analisis) sebagaimana sebagaimana terlihat pada Figure 12.
Summary
Item Data Item Data
Close (April 15, 2020) 174(-5.43%) Trading range 174 - 185 Relative Avg. Price performance to JCI (%) (14.74) Target
β (beta) 69 - Daily 185
Corelation 0.98 - Weekly 193
Period 73 - Monthly 197
r-squared 0.82146 Stop loss 162
Volatility (+/-, %) +3.40/-3.05 Volatility (+/-, Rp.) +5.92/ -5.31 Source: Mirae Asset Sekuritas Indonesia Research Figure 12. Daily – Downtrend x` x` x,
Source: Mirae Asset Sekuritas Indonesia Research
,,
Created with AmiBroker - adv anced charting and technical analy sis sof tware. http://www.amibroker.com
_____ 185.1 _____ 173.5
Tasrul Optimization Trading System - ©2010 Tasrul Optimization Trading System - ©2010 Tasrul Optimization Trading System - ©2010
168 1/3/2020
3/19/20 WEGE.JK [ WEGE.JK ] - Daily - 4/15/2020 Open: 184 High: 190 Low: 173 Close: 174 Vol. 31,918,600
Prev. Avg. Price: 179.0 R-Squared: 0.8214 Period: 73 Std.Dev: 1.35 Volatility (+) : 0.0340 Volatility (-) : -0.0305 V-Ratio : 1.12 Chg.: -5.43%
174 173.914 143.609
107.565 179.653 210.669
2020 Feb Mar Apr
WEGE.JK - Volume = 31,918,600.00, EMA(Volume,72) = 36,710,332.00, EMA1(Volume,17) = 57,591,108.00
31,918,600 36,710,332 57,591,108
16 April 2020
11 Embun Pagi
Mirae Asset Sekuritas Indonesia
Aliran dana masuk masih terlihat namun volatilitas harga turun sementara akan terbatas.
Pada Figure 13, terlihat dari hasil optimalisasi indikator MFI optimized , indikatorW%R optimized dan Stochastic%D optimized masih cenderung turun. Daily support di 174 sementara itu daily resistance di 186 Cut loss level di 162.
Figure 13 .Daily, MFI optimized, W%R optimized & Stochastic%D Optimized ,
Source: Mirae Asset Sekuritas Indonesia Research
C r e a t e d wi t h A m i B r o k e r - a d v a n c e d c h a r t i n g a n d t e c h n i c a l a n a l y s i s s o f t wa r e . h t t p : / / www. a m i b r o k e r . c o m
WEGE.JK - MFI Smoothed = 60.06
60.0588
WEGE.JK - Will%R Smoothed = -82.75
-82.7528
WEGE.JK - Stochastic %D = 50.78, MA = 42.58
50.7813 42.5785
Tasrul Optimization Trading System - ©2010 Tasrul Optimization Trading System - ©2010
168 WEGE.JK [ WEGE.JK ] - Daily - 4/15/2020 Open: 184 High: 190 Low: 173 Close: 174 Vol. 31,918,600
Prev. Avg. Price: 179.0 R-Squared: 0.8214 Period: 73 Std.Dev: 1.35 Volatility (+) : 0.0346 Volatility (-) : -0.0302 V-Ratio : 1.15 Chg.: -5.43%
174 173.914 210.669
Oct Nov Dec 2020 Feb Mar Apr
WEGE.JK - Volume = 31,918,600.00, MA(Volume,73) = 29,774,028.00
31,918,600 29,774,028
16 April 2020
12 Embun Pagi
Mirae Asset Sekuritas Indonesia
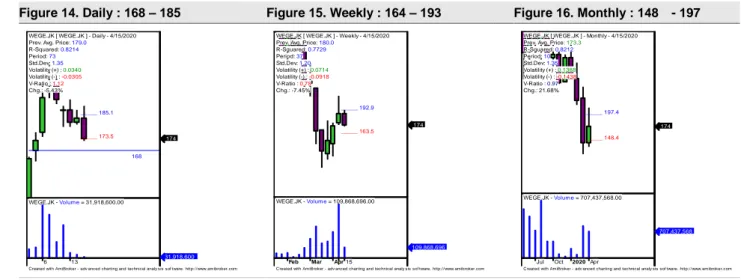
Harga saat ini akan coba naik dan bertahan diatas rata-rata pada masing- masing periode.
Untuk mampu naik lebih lanjut, harga saham saat ini harus mampu minimal bertahan diatas rata-rata masing-masing periode (positive area) . Lebih lanjut potensi koreksi normal harga pada pergerakan daily sekitar -3.05% saat ini di level -5.43%. Sementara itu pada pergerakkan weekly koreksi normal sekitar -9.18 saat ini harga di level -7.45%.
Pada pergerakan monthly kenaikkan normal +13.88 saat ini di +21.68 Dengan demikian diperkirakan potensi koreksi masih terlihat sementar dan mulai terbatas. Pada Figure 14,15 dan 16 terlihat perkiraan normal trading range untuk masing-masing periode.
Figure 14. Daily : 168 – 185 Figure 15. Weekly : 164 – 193 Figure 16. Monthly : 148 - 197
, x` x` x` x ,
Source: Mirae Asset Sekuritas Indonesia Research Source: Mirae Asset Sekuritas Indonesia Research Source: Mirae Asset Sekuritas Indonesia Research
Created with AmiBroker - adv anced charting and technical analy sis sof tware. http://www.amibroker.com _____ 185.1
_____ 173.5
168 WEGE.JK [ WEGE.JK ] - Daily - 4/15/2020 Prev. Avg. Price: 179.0 R-Squared: 0.8214 Period: 73 Std.Dev: 1.35 Volatility (+) : 0.0340 Volatility (-) : -0.0305 V-Ratio : 1.12 Chg.: -5.43%
174
6 13
WEGE.JK - Volume = 31,918,600.00
31,918,600
Created with AmiBroker - adv anced charting and technical analy sis sof tware. http://www.amibroker.com _____ 192.9
_____ 163.5 WEGE.JK [ WEGE.JK ] - Weekly - 4/15/2020 Prev. Avg. Price: 180.0
R-Squared: 0.7729 Period: 37 Std.Dev: 1.20 Volatility (+) : 0.0714 Volatility (-) : -0.0918 V-Ratio : 0.78 Chg.: -7.45%
174
Feb Mar Apr 15 WEGE.JK - Volume = 109,868,696.00
109,868,696
Created with AmiBroker - adv anced charting and technical analy sis sof tware. http://www.amibroker.com _____ 197.4
_____ 148.4 WEGE.JK [ WEGE.JK ] - Monthly - 4/15/2020 Prev. Avg. Price: 173.3
R-Squared: 0.8212 Period: 10 Std.Dev: 1.35 Volatility (+) : 0.1388 Volatility (-) : -0.1438 V-Ratio : 0.97 Chg.: 21.68%
174
Jul Oct 2020 Apr WEGE.JK - Volume = 707,437,568.00
707,437,568
16 April 2020
13 Embun Pagi
Mirae Asset Sekuritas Indonesia
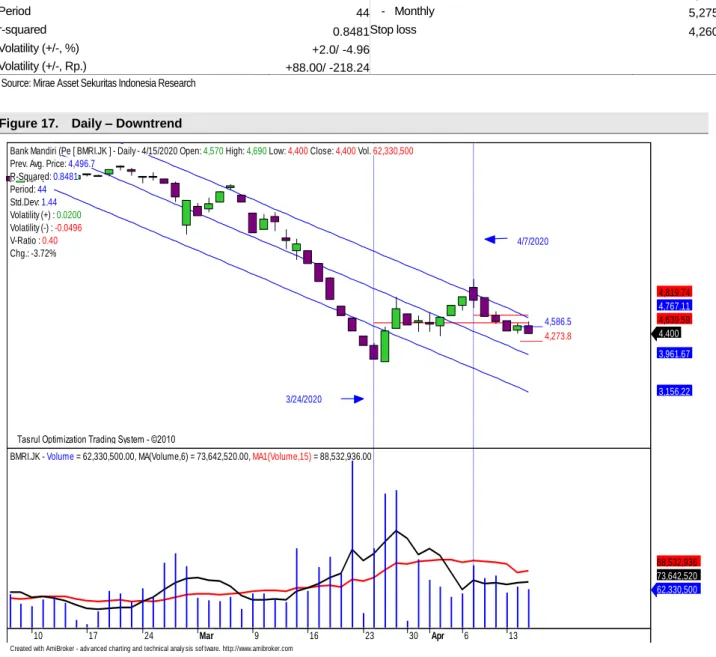
Bank Mandiri (BMRI) – Daily , Buy on Weakness
Harga akan coba bertahan diatas normal uperband pada downtrend channel.
Secara umum harga saham ini berada dalam pola down trend channel dimana trend yang terbentuk saat ini masih relatif kuat(r-squared = 0.8481) selama 44 hari terakhir dan bergerak normal dalam rentang +/- 1.44 std.deviasi dari centerline. Harga keluar dari pergerakan normalnya sekitar +15.19% (sekitar 7 bar chart ). Rata-rata volatilitas normal pergerakan harga saat in sejak harga bergerak naik dari 24 Maret 2020 antara +2.0% / -4.96% atau +88.00 rupiah / -218.24 rupiah (rata-rata pergerakan normal positif / negatif, selama periode analisis)sebagaimana terlihat pada Figure 17.
Summary
Item Data Item Data
Close (April 15, 2020) 4,400(-3.72%) Trading range 4,270 -4,590 Relative Avg. Price performance to JCI (%) (30.24) Target
β (beta) 1.47 - Daily 4,590
Corelation 0.95 - Weekly 4,730
Period 44 - Monthly 5,275
r-squared 0.8481 Stop loss 4,260
Volatility (+/-, %) +2.0/ -4.96
Volatility (+/-, Rp.) +88.00/ -218.24
Source: Mirae Asset Sekuritas Indonesia Research
Figure 17. Daily – Downtrend
Source: Mirae Asset Sekuritas Indonesia Research
,
Created with AmiBroker - adv anced charting and technical analy sis sof tware. http://www.amibroker.com
_____ 4,586.5 _____ 4,273.8
Tasrul Optimization Trading System - ©2010 Tasrul Optimization Trading System - ©2010 Tasrul Optimization Trading System - ©2010
3/24/2020
4/7/2020 Bank Mandiri (Pe [ BMRI.JK ] - Daily - 4/15/2020 Open: 4,570 High: 4,690 Low: 4,400 Close: 4,400 Vol. 62,330,500
Prev. Avg. Price: 4,496.7 R-Squared: 0.8481 Period: 44 Std.Dev: 1.44 Volatility (+) : 0.0200 Volatility (-) : -0.0496 V-Ratio : 0.40 Chg.: -3.72%
4,400 3,961.67
3,156.22 4,639.59 4,767.11 4,819.74
10 17 24 Mar 9 16 23 30 Apr 6 13
BMRI.JK - Volume = 62,330,500.00, MA(Volume,6) = 73,642,520.00, MA1(Volume,15) = 88,532,936.00
62,330,500 73,642,520 88,532,936
16 April 2020
14 Embun Pagi
Mirae Asset Sekuritas Indonesia
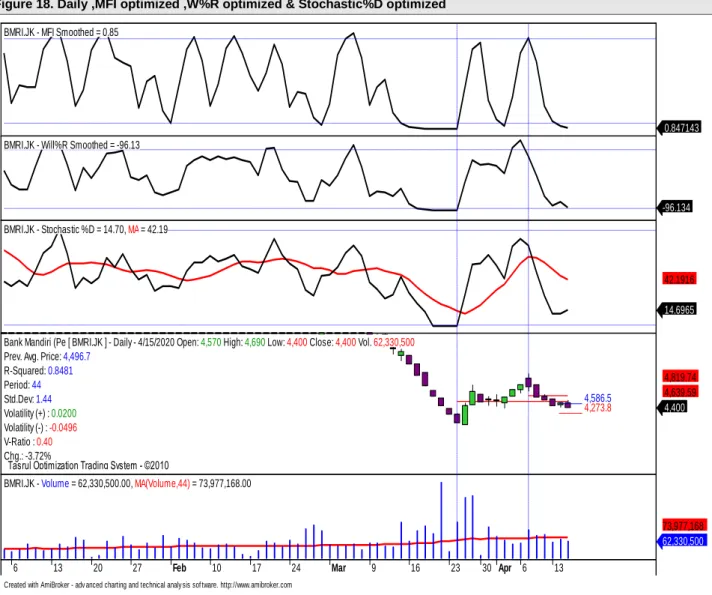
Aliran dana keluar dan volatilitas harga turun masih terlihat.
Pada Figure 18, terlihat dari hasil optimalisasi. Indikator MFI optimized ,indikator W%R optimized, dan indikator Stochastic %D optimized masih cenderung turun. Perkiraan daily support di 4,270 dan daily resistance di 4,590. Cut loss level di 4,260.
Figure 18. Daily ,MFI optimized ,W%R optimized & Stochastic%D optimized XXXXXXXXXXXXX XX,
Source: Mirae Asset Sekuritas Indonesia Research
Created with AmiBroker - adv anced charting and technical analy sis sof tware. http://www.amibroker.com
BMRI.JK - MFI Smoothed = 0.85
0.847143 BMRI.JK - Will%R Smoothed = -96.13
-96.134 BMRI.JK - Stochastic %D = 14.70, MA = 42.19
14.6965 42.1916
_____ 4,586.5 _____ 4,273.8
Tasrul Optimization Trading System - ©2010 Tasrul Optimization Trading System - ©2010
Bank Mandiri (Pe [ BMRI.JK ] - Daily - 4/15/2020 Open: 4,570 High: 4,690 Low: 4,400 Close: 4,400 Vol. 62,330,500 Prev. Avg. Price: 4,496.7
R-Squared: 0.8481 Period: 44 Std.Dev: 1.44 Volatility (+) : 0.0200 Volatility (-) : -0.0496 V-Ratio : 0.40 Chg.: -3.72%
4,400 4,639.59 4,819.74
6 13 20 27 Feb 10 17 24 Mar 9 16 23 30 Apr 6 13
BMRI.JK - Volume = 62,330,500.00, MA(Volume,44) = 73,977,168.00
62,330,500 73,977,168
16 April 2020
15 Embun Pagi
Mirae Asset Sekuritas Indonesia
Harga akan coba bertahan diatas rata-ratapada masing-masing periode.
Untuk mampu naik lebih lanjut, harga saham saat ini harus mampu minimal bertahan diatas rata-rata masing-masing periode (positive area) . Jika dilihat lebih lanjut potensi koreksi harga pada pergerakan daily sekitar -4.96 %, saat ini di level -3.72%. Pada pergerakkan weekly potensi koreksi normal sekitar -11.01%, saat ini di level -5.78%.
Sementara pergerakkan monthly saat ini level -5.98% sementara koreksi normal di - 17.19%. Dengan demikian diperkirakan potensi koreksi masih terlihat namun sementara akan tertahan. Pada Figure 19,20 dan 21 terlihat perkiraan normal trading range untuk masing-masing periode.
Figure 19. Daily : 4,270 – 4,590 Figure 20. Weekly : 4,000 – 4,730 Figure 21. Monthly : 3,960– 5,275
, x` x,
Source: Mirae Asset Sekuritas Indonesia Research Source: Mirae Asset Sekuritas Indonesia Research Source: Mirae Asset Sekuritas Indonesia Research
Relative Avg.Price Performance to JCI (%) : Persentase kenaikan harga saham dari rata-rata sejak IHSG memulai uptrend-nya β (beta) : Indikator sensitivitas harga saham terhadap IHSG, beta diatas 1 berarti harga makin sensitif terhadap pergerakan IHSG dan sebaliknya
Correlation : Ukuran kuat hubungan (korelasi) pergerakan harga saham dibanding dengan pergerakan IHSG selama periode analisis.
Period : Periode uptrend / downtrend yang valid dari pergerakan harga saham.
r-squared : Koefisien determinasi, menunjukkan persentase gerakan yang dapat dijelaskan dengan regresi linier.Nilai R2 terletak antara 0 – 1, dan kecocokan model dikatakan lebih baik kalau R2 semakin mendekati 1 (validitas uptrend atau downtrend makin valid)
Volatility (+/-%) : Besaran volatilitas normal positif/negatif dari pergerakan harga harian selama harga saham bergerak normal pada trend channel dalam persentase.
Volatility (+/- point or Rp) : Besaran volatilitas normal positifl/negatif dari pergerakan harga harian selama harga saham bergerak dalam periode analisis.
Created with AmiBroker - adv anced charting and technical analy sis sof tware. http://www.amibroker.com _____ 4,586.5
_____ 4,273.8 Bank Mandiri (Pe [ BMRI.JK ] - Daily - 4/15/2020 Prev. Avg. Price: 4,496.7
R-Squared: 0.8481 Period: 44 Std.Dev: 1.44 Volatility (+) : 0.0200 Volatility (-) : -0.0496 V-Ratio : 0.40 Chg.: -3.72%
4,400
6 13
BMRI.JK - Volume = 62,330,500.00
62,330,500
Created with AmiBroker - adv anced charting and technical analy sis sof tware. http://www.amibroker.com _____ 4,732.1
_____ 4,001.7 Bank Mandiri (Pe [ BMRI.JK ] - Weekly - 4/15/2020 Prev. Avg. Price: 4,496.7
R-Squared: 0.9302 Period: 824 Std.Dev: 1.82 Volatility (+) : 0.0524 Volatility (-) : -0.1101 V-Ratio : 0.48 Chg.: -5.78%
4,400
Feb Mar Apr BMRI.JK - Volume = 186,420,000.00
186,420,000
Created with AmiBroker - adv anced charting and technical analy sis sof tware. http://www.amibroker.com _____ 5,270.6
_____ 3,963.8 Bank Mandiri (Pe [ BMRI.JK ] - Monthly - 4/15/2020 Prev. Avg. Price: 4,786.7
R-Squared: 0.9247 Period: 200 Std.Dev: 1.78 Volatility (+) : 0.1011 Volatility (-) : -0.1719 V-Ratio : 0.59 Chg.: -5.98%
4,400
2020 Apr BMRI.JK - Volume = 693,754,240.00
693,754,240
16 April 2020
16 Embun Pagi
Mirae Asset Sekuritas Indonesia
Chart 22. JCI Vs. USD/IDR Chart 23. JCI performance (absolute vs. relative)
Source: Bloomberg, Mirae Asset Sekuritas Indonesia Note: Relative to MSCI EM Index
Source: Bloomberg, Mirae Asset Sekuritas Indonesia
Chart 24. Foreigner’s net purchase (EM) Chart 25. Energy price
V
Note: The latest figure for India is Apr 13th, 2020; Korea is Apr 14th, 2020 Source: Bloomberg, Mirae Asset Sekuritas Indonesia Source: Bloomberg, Mirae Asset Sekuritas Indonesia
Chart 26. Non-ferrous metal price Chart 27. Precious metal price
Source: Bloomberg, Mirae Asset Sekuritas Indonesia Source: Bloomberg, Mirae Asset Sekuritas Indonesia 13,500
14,000 14,500 15,000 15,500 16,000 16,500 17,000
3,500 4,000 4,500 5,000 5,500 6,000 6,500
1/15 2/12 3/11 4/8
(IDR)
(pt) JCI (L) USD/IDR (R)
-1.7
-3.2
-1.4
-28.6 -0.8
-3.3
-8.0
-9.8
-32 -28 -24 -20 -16 -12 -8 -4 0
1D 1W 1M 1Y
Absolute Relative (%, %p)
121
-128
-24 -102 -27
-139
-761
-129 -83
-332 -104
219
-1,000 -800 -600 -400 -200 0 200 400
Korea Taiwan Indonesia Thailand Philippines India
1 Day 5 Days
(USDmn) (USDmn)
80 90 100 110
6/27 7/25 8/22 9/19
CPO WTI Coal
(D-3M=100) (D-3M=100)
30 40 50 60 70 80 90 100 110
1/15 2/12 3/11 4/8
CPO WTI Coal
(D-3M=100)
70 80 90 100 110
01/20 02/20 03/20 04/20
(D-3M=100) Copper Nickel Tin
50 60 70 80 90 100 110 120
01/20 02/20 03/20 04/20
(D-3M=100) Silver Gold Platinum
16 April 2020
17 Embun Pagi
Mirae Asset Sekuritas Indonesia Table. Key valuation metrics
Company Name Ticker
Price Market Cap Price Performance (%) P/E(X)* P/B(X)* ROE(%)*
(IDR) (IDRbn) 1D 1W 1M 1Y FY20 FY21 FY20 FY21 FY20 FY21
Jakarta Composite Index JCI 4,626 5,378,923 -1.7 -3.2 -1.4 -28.6 11.9 10.5 1.5 1.4 16.0 16.9
FINANCIALS
Bank Central Asia BBCA 27,425 676,164 -0.5 -3.0 -0.4 -0.2 28.8 23.6 4.7 3.9 17.5 17.7
Bank Mandiri Persero BMRI 4,400 205,333 -3.7 -14.1 -25.7 -42.3 13.0 7.5 1.8 1.0 14.2 14.4
Bank Rakyat Indonesia Persero BBRI 2,760 340,434 -4.8 -8.9 -21.1 -36.4 15.6 9.8 2.6 1.7 17.7 18.1
Bank Negara Indonesia Persero BBNI 4,200 78,324 1.2 -2.6 -13.2 -56.7 9.5 5.0 1.2 0.7 13.3 13.8
Bank Tabungan Negara Persero BBTN 960 10,166 -3.0 -5.0 -22.9 -62.8 10.4 5.5 0.9 0.5 9.4 9.7
CONSUMER
HM Sampoerna HMSP 1,610 187,272 -4.7 -5.6 14.6 -56.8 17.8 13.1 6.8 5.2 38.6 39.8
Gudang Garam GGRM 47,600 91,587 -0.5 -1.0 21.5 -42.3 9.4 9.2 2.0 1.8 22.7 20.6
Indofood CBP Sukses Makmur ICBP 10,175 118,660 -1.7 1.0 -2.2 12.1 23.5 22.1 4.9 4.3 21.1 19.7
Indofood Sukses Makmur INDF 6,425 56,414 -0.4 -1.5 0.0 -0.4 14.2 12.0 1.8 1.6 13.7 13.3
Kalbe Farma KLBF 1,210 56,719 2.1 -1.6 21.0 -19.1 30.3 22.3 4.8 3.5 16.4 16.4
Unilever Indonesia UNVR 6,975 266,096 -2.4 -4.1 0.0 -29.4 43.3 35.7 60.7 43.8 116.7 103.3
AGRICULTURAL
Astra Agro Lestari AALI 6,700 12,895 0.0 1.5 12.6 -45.5 132.9 28.2 1.5 0.7 1.1 2.8
PP London Sumatera Indonesia LSIP 775 5,288 -5.5 -12.9 17.4 -33.5 40.1 33.3 1.2 0.6 3.0 1.8
Sawit Sumbermas Sarana SSMS 975 9,287 -1.5 -3.5 23.4 -7.1 21.7 14.6 2.3 2.1 10.8 16.3
INFRASTRUCTURE
XL Axiata EXCL 2,230 23,874 -1.8 -2.2 33.1 -19.2 47.0 36.4 1.8 1.3 3.8 3.4
Jasa Marga JSMR 2,980 21,628 -4.5 -6.9 -13.6 -51.1 10.6 13.1 1.2 1.1 11.2 7.8
Perusahaan Gas Negara PGAS 840 20,363 -6.7 -8.2 -8.2 -64.4 52.0 5.4 1.5 0.5 2.6 8.6
Tower Bersama Infrastructure TBIG 1,025 23,223 5.1 10.8 0.0 34.2 31.3 25.9 5.3 6.0 19.6 24.9
Telekomunikasi Indonesia TLKM 3,110 308,083 -4.0 -3.4 -1.6 -18.5 14.9 13.8 2.9 2.8 19.5 20.9
Soechi Lines SOCI 121 854 -6.9 5.2 51.3 -24.4 N/A N/A N/A N/A N/A N/A
Garuda Indonesia GIAA 199 5,151 -5.2 -8.7 -4.3 -62.1 10.1 N/A 1.2 1.1 13.1 -11.3
BASIC-INDUSTRIES
Semen Indonesia SMGR 7,125 42,262 -6.9 -12.0 1.1 -46.5 29.8 20.8 2.2 1.3 7.5 6.4
Charoen Pokphand Indonesia CPIN 4,450 72,971 -4.1 -8.8 -14.0 -27.9 20.9 19.2 3.4 3.0 16.7 17.1
Indocement Tunggal Prakarsa INTP 11,550 42,518 -0.6 -6.9 10.0 -46.3 38.2 25.5 3.0 1.8 7.9 7.1
Japfa Comfeed Indonesia JPFA 945 11,082 -6.4 -3.6 -12.5 -46.6 10.2 7.1 1.7 1.0 17.3 14.4
MINING
Indo Tambangraya Megah ITMG 7,900 8,926 -0.9 -4.2 6.0 -60.6 6.9 4.3 1.0 0.6 13.9 14.9
Adaro Energy ADRO 1,045 33,425 -3.2 -8.3 34.8 -19.9 8.8 4.8 1.0 0.5 11.0 11.1
Aneka Tambang ANTM 525 12,616 -5.4 -5.4 17.7 -41.3 13.1 11.2 0.6 0.6 4.6 4.4
Vale Indonesia INCO 2,460 24,443 -2.0 6.5 38.2 -25.0 45.1 31.6 1.3 0.8 3.0 2.7
Tambang Batubara Bukit Asam PTBA 1,960 22,580 -5.8 -6.7 6.8 -50.8 7.2 5.3 1.6 1.3 23.7 24.3
TRADE
United Tractors UNTR 17,725 66,117 -2.9 0.7 22.0 -32.9 7.1 6.0 1.4 1.1 20.2 18.7
AKR Corporindo AKRA 1,930 7,748 -6.3 -10.2 14.9 -58.1 22.0 9.4 1.9 0.9 8.5 9.9
Global Mediacom BMTR 240 3,680 6.2 3.4 9.1 -33.3 1.6 N/A 0.3 N/A 19.6 18.8
Matahari Department Store LPPF 1,355 3,801 -0.4 -4.2 -31.4 -62.3 8.6 2.6 6.4 1.7 76.7 72.7
Media Nusantara Citra MNCN 1,100 15,704 1.4 5.8 18.3 30.2 7.1 6.5 1.4 1.2 19.0 18.0
Matahari Putra Prima MPPA 118 888 0.9 31.1 42.2 -40.4 N/A N/A N/A N/A N/A N/A
Surya Citra Media SCMA 840 12,411 2.4 -1.2 10.5 -51.9 9.4 8.6 2.4 2.1 26.4 25.4
Siloam International Hospital SILO 5,100 8,291 -4.7 -5.6 -13.6 27.8 103.7 75.5 1.3 1.3 1.3 1.5
PROPERTY
Bumi Serpong Damai BSDE 845 16,263 0.6 -1.2 11.2 -40.1 8.5 6.6 0.8 0.6 10.1 9.1
Adhi Karya ADHI 630 2,243 -3.1 0.0 15.6 -64.4 6.3 3.2 0.6 0.3 10.1 10.5
Alam Sutera Relaty ASRI 118 2,319 -5.6 -5.6 -11.3 -65.7 3.7 2.6 0.2 0.2 6.3 8.4
Ciputra Development CTRA 595 11,043 -4.0 -1.7 -10.5 -48.7 16.8 11.9 1.3 0.7 7.8 6.4
Lippo Karawaci LPKR 148 10,493 -1.3 -2.6 -20.0 -41.4 8.7 11.2 0.3 0.4 0.3 3.0
Pembangunan Perumahan PTPP 740 4,588 -4.5 -2.6 1.4 -69.0 10.6 3.9 0.7 0.3 7.1 8.7
Pakuwon Jati PWON 414 19,938 2.0 2.5 12.5 -42.5 7.6 8.7 1.4 1.2 18.4 14.1
Summarecon Agung SMRA 505 7,286 -6.5 -2.9 -16.5 -56.8 28.2 14.9 2.0 1.1 7.2 6.5
Wijaya Karya WIKA 1,140 10,226 0.9 -6.6 3.6 -51.1 7.8 5.0 1.1 0.6 14.6 13.1
Waskita Karya WSKT 630 8,552 -4.5 -5.3 5.9 -70.1 21.5 3.5 1.1 0.4 5.2 11.5
MISCELLANEOUS
Astra International ASII 3,820 154,647 -3.5 -5.9 -16.8 -50.7 12.9 7.2 1.9 1.1 15.2 14.6
Source: Bloomberg, Mirae Asset Sekuritas Indonesia
*Note: Valuation metrics based on Bloomberg consensus estimates
16 April 2020
18 Embun Pagi
Mirae Asset Sekuritas Indonesia
Sector performance Top 10 market cap performance
Name Index Chg (%) Ticker Price Market Cap
(IDRbn) Chg (%)
Agricultural 1,009.0 0.1 STTP IJ 10900 14,279 19.78
Mining 1,242.2 -1.7 RMBA IJ 270 9,828 19.47
Basic-Industry 666.1 -1.8 MAPI IJ 605 10,043 14.2
Miscellaneous Industry 726.8 -2.6 ULTJ IJ 1500 17,330 8.70
Consumer Goods 1,721.9 -1.4 SMAR IJ 3110 8,933 6.87
Property & Construction 328.6 -2.0 CITA IJ 1750 6,931 6.06
Infrastructure 836.2 -2.4 TBIG IJ 1025 23,223 5.1
Finance 972.1 -1.8 ACES IJ 1275 21,866 4.51
Trade 603.0 -1.0 TGKA IJ 5450 5,006 2.83
Composite 4,625.9 -1.7 SCMA IJ 840 12,411 2.44
Source: Bloomberg
Top 5 leading movers Top 5 lagging movers
Name Chg (%) Close Name Chg (%) Close
STTP IJ 19.8 10,900 BBRI IJ -4.8 2,760
RMBA IJ 19.5 270 TLKM IJ -4.0 3,110
TCPI IJ 6.9 4,670 HMSP IJ -4.7 1,610
ULTJ IJ 8.7 1,500 BMRI IJ -3.7 4,400
MAPI IJ 14.2 605 UNVR IJ -2.5 6,975
Source: Bloomberg
Economic Calendar
Time Currency Detail Forecast Previous
1:00am USD Beige Book
3:00am USD TIC Long-Term Purchases 24.6B 21.8B
4:50am USD President Trump Speaks
6:01am GBP BRC Retail Sales Monitor y/y -5.5% -0.4%
8:00am AUD MI Inflation Expectations 4.0%
8:30am AUD Employment Change -33.0K 26.7K
8:30am AUD Unemployment Rate 5.4% 5.1%
1:00pm EUR German Final CPI m/m 0.1% 0.1%
1:00pm EUR German WPI m/m 0.2% -0.9%
1:30pm CHF PPI m/m -1.2% -0.9%
3:30pm GBP BOE Credit Conditions Survey
4:00pm EUR Industrial Production m/m -0.1% 2.3%
Tentative GBP 30-y Bond Auction 1.03|2.1
7:30pm CAD ADP Non-Farm Employment Change 7.2K
7:30pm CAD Manufacturing Sales m/m 0.0% -0.2%
7:30pm USD Unemployment Claims 5350K 6606K
7:30pm USD Building Permits 1.30M 1.45M
7:30pm USD Philly Fed Manufacturing Index -30.0 -12.7
7:30pm USD Housing Starts 1.31M 1.60M
8:30pm GBP MPC Member Tenreyro Speaks
Day 3 All IMF Meetings
9:30pm USD Natural Gas Storage 63B 38B
Note: Time is based on Indonesian local time Source: Forex Factory
16 April 2020
19 Embun Pagi
Mirae Asset Sekuritas Indonesia Disclaimers
This report is prepared strictly for private circulation only to clients of PT Mirae Asset Sekuritas Indonesia (MASI). It is purposed only to person having professional experience in matters relating to investments. The information contained in this report has been taken from sources which we deem reliable.
No warranty (express or implied) is made to the accuracy or completeness of the information. All opinions and estimates included in this report constitute our judgments as of this date, without regards to its fairness, and are subject to change without notice. However, none of MASI and/or its affiliated companies and/or their respective employees and/or agents makes any representation or warranty (express or implied) or accepts any responsibility or liability as to, or in relation to, the accuracy or completeness of the information and opinions contained in this report or as to any information contained in this report or any other such information or opinions remaining unchanged after the issue thereof. We expressly disclaim any responsibility or liability (express or implied) of MASI, its affiliated companies and their respective employees and agents whatsoever and howsoever arising (including, without limitation for any claims, proceedings, action, suits, losses, expenses, damages or costs) which may be brought against or suffered by any person as a results of acting in reliance upon the whole or any part of the contents of this report and neither MASI, its affiliated companies or their respective employees or agents accepts liability for any errors, omissions or misstatements, negligent or otherwise, in the report and any liability in respect of the report or any inaccuracy therein or omission there from which might otherwise arise is hereby expresses disclaimed.
This document is not an offer to sell or a solicitation to buy any securities. This firms and its affiliates and their officers and employees may have a position, make markets, act as principal or engage in transaction in securities or related investments of any company mentioned herein, may perform services for or solicit business from any company mentioned herein, and may have acted upon or used any of the recommendations herein before they have been provided to you. © PT Mirae Asset Sekuritas Indonesia 2016.