Franky Rivan +62-21-515-1140 [email protected] To subscribe to our Daily Focus, please contact us at [email protected]
Mirae Asset Sekuritas Indonesia
PWON’s 17F P/E range
Source: Mirae Asset Sekuritas Research Indonesia
April 3, 2017
PWON 4Q16 Review: One step back, two steps forward
Pendapatan, laba kotor, dan laba bersih PWON di 4Q16 masing-masing naik 13,5%, 13,5%, dan 12,3% YoY. Laba bersih FY16 PWON sejalan dengan proyeksi kami dengan mencapai 102,2% estimasi setahun penuh kami. Namun, pendapatan PWON meleset dengan mencapai 78,5% terhadap estimasi kami.
Weighed down by property-selling; Recognition to improve going forward Kami lihat penjualan properti dan pengakuan pendapatan PWON yang melambat menjadi alasan utama kinerjanya yang turun di FY16. Pendapatan dari penjualan properti PWON sebesar IDR2.2tr di FY16. Cash conversion cycle PWON cukup buruk, sebesar 516 hari di FY16 (vs. 430 hari di FY15), bukti pengakuan pendapatan yang melambat. Karena kami lihat tingkat suku bunga yang rendah akan memiliki efek penuh dalam meningkatkan kemampuan membayar pembeli properti tahun ini, kami kira cash conversion cycle PWON akan pulih ke 464 hari di 2017F. Karenanya, kami tetap optimis bahwa pendapatan dari penjualan properti PWON akan turn- around tahun ini di IDR2.6tr (naik 15,9% dari tahun 2016). Kami suka PWON karena penyewaan propertinya terus solid di 2016, sebesar IDR2.5tr (naik 10,2% YoY, vs.
IDR2.3tr pada FY15). Kami percaya kekuatan penyewaan properti perusahaan terletak di occupancy rate yang tinggi, diversifikasi lease expiration yang baik, dan harga sewa properti yang tetap kuat.
Maintain Buy with lower TP of IDR740/share
Kami mempertahankan rekomendasi Buy kami di PWON, karena 1) pandangan positif kami pada peningkatan pengakuan pendapatan perusahaan ke depannya 2) prospek penyewaan properti PWON yang tetap kuat. Namun kami memotong target price kami ke IDR740/lembar, karena kami mengubah asumsi risk-free rate ke 7,5% (dari 7%) dan beta perusahaan ke 1.4x (dari 1.3x) untuk mencerminkan kondisi pasar saat ini yang lebih akurat. Target price berbasis DCF kami mencerminkan 17.7x 17F P/E dengan perpetual growth rate 5%, market risk premium 5.0%, dan 12% WACC.
Market Index
Last Trade Chg (%) MoM YoY
JCI 5,568.1 -0.4 3.7 15.5
MSCI Indonesia 25.8 -0.5 5.1 9.1
MSCI EM 958.4 -1.1 4.1 17.3
HANG SENG 24,111.6 -0.8 3.2 18.5
KOSPI 2,160.2 0.1 3.9 9.5
FTSE 7,322.9 -0.6 -0.1 19.9
DJIA 20,663.2 -0.3 -1.3 16.5
NASDAQ 5,911.7 0.0 0.7 20.3
Valuation
2017F P/E (x) P/B (x) ROE (%)
JCI 16.0 2.3 18.1
Key Rates
Last Trade Chg (bps) MoM YoY
BI 7-Day RR 4.75 0 0 -50*
3yr 6.75 -4 -45 -78
10yr 7.04 -5 -50 -63
*since introduced in Aug 2016
FX
Last Trade Chg (%) MoM YoY
USD/IDR 13,322.00 0.0 -0.2 0.6
USD/KRW 1,118.40 0.1 -3.3 -2.4
USD/JPY 111.39 -0.5 -2.3 0.0
USD/CNY 6.89 0.0 0.3 6.8
Commodities
Last Trade Chg (%) MoM YoY
WTI 50.6 0.5 -5.9 18.3
Gold 1,249.2 0.5 1.2 2.8
Coal 84.2 4.0 0.8 64.7
Palm Oil 705.0 0.0 5.0 21.3
Rubber 176.5 0.0 -8.0 51.5
Nickel 10,025.0 -1.1 -8.8 20.5
Copper 5,837.5 -2.0 -1.3 20.7
Tin 20,175.0 0.1 4.8 20.6
JCI Index VS MSCI Emerging Markets
650 800 950 1,100
3,500 4,500 5,500
03/13 03/14 03/15 03/16 03/17
(pt) JCI MSCI EM (pt)
800 950 1,100
4,500 5,500
(pt) JCI MSCI EM (pt)
Mirae Asset Sekuritas Indonesia cartoon
Local flashes
ASRI: Laba Alam Sutra tergerus 15%. Tekanan terhadap bisnis properti sepanjang tahun lalu turut berimbas pada kinerja emiten properti PT Alam Sutera Realty Tbk.
yang mesti puas dengan penurunan laba bersih sebesar 15%, dari Rp 595,5 miliar di tahun 2015 menjadi Rp508,8 miliar. Dalam keterangan resmi perseroan, ASRI membukukan total pendapatan 2016 senilai Rp2,7 triliun. Pendapatan dari penjualan rumah dan ruko mengalami pertumbuhan yang pesat sebesar 208% menjadi Rp1 triliun di tahun 2016 dibandingkan dengan Rp325,1 miliar pada tahun 2015. (Bisnis Indonesia)
SIPD: Penjualan Sierad Produce naik jadi Rp2,42 triliun. PT Sierad Produce Tbk (SIPD) meraih penjualan bersih Rp2,42 triliun hingga periode 31 Desember 2016 naik dibandingkan penjualan bersih Rp2,11 triliun di periode sama tahun sebelumnya.
Laporan keuangan perseroan menyebutkan beban pokok naik jadi Rp1,98 triliun dari beban pokok Rp1,92 triliun dan laba kotor naik jadi Rp441,90 miliar dari laba kotor Rp184,20 miliar tahun sebelumnya. Laba tahun berjalan yang dapat didistribusikan kepada pemilik entitas induk diraih Rp13,04 miliar usai menderita rugi Rp352,33 miliar tahun sebelumnya. (Iqplus)
SSIA: Pendapatan dan laba Surya Semesta turun di 2016. Lemahnya permintaan konstruksi properti serta lahan industri tahun lalu menyebabkan penurunan pendapatan yang cukup signifkan bagi PT Surya Semesta Internusa Tbk., yakni sebesar 22%. Berdasarkan laporan keuangan perseroan, tahun lalu perseroan mencatatkan pendapatan senilai Rp3,79 triliun, turun dari realisasi 2015 yang mencapai Rp4,86 triliun. Penurunan ini tidak terlepas dari capaian marketing sales lahan industri emiten dengan kode saham SSIA ini yang hanya mencapai 10,4 hektar, jauh dari targetnya 30 hektar. Selama sembilan bulan awal 2016, perseroan hanya berhasil menjual satu hektar lahan. (Bisnis Indonesia)
SMGR: Semen Indonesia bayar dividen Rp 304,92 per saham. PT Semen Indonesia Tbk (SMGR) menebar dividen dengan porsi yang sama seperti tahun lalu. Pay out ratio dividen SMGR tahun buku 2016 sebesar 40% dari laba bersih 2016 yang mencapai Rp 4,25 triliun. Jadi, total dividen yang akan dibagikan mencapai Rp 1,81 triliun atau setara Rp 304,92 per saham. Pembagian dividen itu telah memperoleh persetujuan Rapat Umum Pemegang Saham (RUPS) SMGR, Jumat (31/3). (Kontan)
KIJA: Bisnis properti lesu, pendapatan Jababeka turun 7%. PT Kawasan Industri Jababeka Tbk (KIJA) membukukan pendapatan sebesar Rp 2,9 triliun pada tahun lalu.
Kinerja tersebut turun 7% dibandingkan pendapatan tahun sebelumnya yang mencapai Rp 3,1 triliun. Penurunan penjualan KIJA disebabkan pendapatan real estate & property yang turun 6% year on year (yoy) menjadi Rp 1,1 triliun. Penurunan ini disebabkan melambatnya kontribusi penjualan lahan industri dan bangunan dan rumah toko.
(Kontan)
DMAS: 2016, Laba Puradelta Lestari merosot 44,6%. PT Puradelta Lestari Tbk (DMAS) mengalami perlambatan kinerja sepanjang tahun 2016. Laba bersih perusahaan melorot 44,6% dibandingkan tahun sebelumnya lantaran menurunya penjualan lahan industri serta adanya rugi kursa yang ditanggung perusahaan. Puradelta hanya berhasil mengantongi laba bersih Rp 757,2 miliar. Sementara pada tahun 2015 perusahaan kawasan industri ini masih mencetak laba bersih hingga Rp 1,36 triliun. (Kontan)
MEGA: Bank Mega bagikan dividen Rp 578,9 miliar. PT Bank Mega Tbk membagikan dividen sebanyak 50% dari laba bersih atau sebesar Rp 578,9 miliar. Pembagian dividen disepakati dalam rapat umum pemegang saham tahunan (RUPST), Jumat (31/3).
"Pembagian dividen tersebut akan dilakukan sesuai dengan ketentuan tata cara dan jadwal yang akan ditetapkan kemudian," ujar Kostaman Thayib, Direktur Utama Bank Mega. Sampai akhir 2016, bank berkode emiten MEGA ini mencatatkan laba bersih sebesar Rp 1,16 triliun atau naik 10% secara tahunan atau year on year (yoy). (Kontan)
Technical analysis
Tasrul +62-21-515-1140 [email protected] Jakarta Composite Index (JCI) – Limited Upside
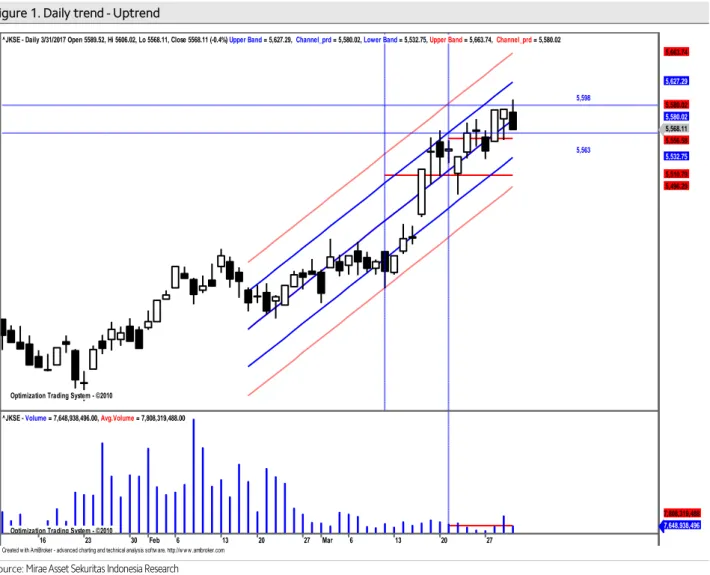
IHSG akan coba bertahan sekitar center line pada uptrend channel.
IHSG saat masih dalam pola uptrend jangka pendek relatif valid yang dimulai sejak selama 30 hari terakhir dengan r-squared = 0.8744 dan bergerak normal dalam rentang +/-1.54 std.deviasi dari centerline. Peluang IHSG bergerak di luar pergerakan normal sekitar 12.56% atau sekitar 4 bar chart. Volatilitas normal pergerakan IHSG saat ini sebesar +/-0.40% atau sekitar +/- 22.2 point. sebagaimana terlihat pada Figure 1.
Summary
Item Data Item Data
Close (March 31, 2017) 5,568.11(-0.4%) Normal trading range 5,563-5,598 Average index performance (%) 2.56 Target
Period 30 - Daily 5,598
r-squared 0.8744 - Weekly 5,650
Volatility (+/-, %) 0.40 - Monthly 5,777 Volatility (+/-, point) 22.2 Stop loss 5,510 Source: Mirae Asset Sekuritas Indonesia Research
Figure 1. Daily trend - Uptrend
Source: Mirae Asset Sekuritas Indonesia Research
Created w ith AmiBroker - advanced charting and technical analysis softw are. http://w w w .amibroker.com Optimization Trading System - ©2010
Optimization Trading System - ©2010 Optimization Trading System - ©2010 Optimization Trading System - ©2010
5,598
5,563
^JKSE - Daily 3/31/2017 Open 5589.52, Hi 5606.02, Lo 5568.11, Close 5568.11 (-0.4%) Upper Band = 5,627.29, Channel_prd = 5,580.02, Lower Band = 5,532.75, Upper Band = 5,663.74, Channel_prd = 5,580.02
5,568.11 5,556.58 5,532.75
5,510.79 5,496.29 5,580.02 5,580.02 5,627.29 5,663.74
16 23 30 Feb 6 13 20 27 Mar 6 13 20 27
Optimization Trading System - ©2010
^JKSE - Volume = 7,648,938,496.00, Avg.Volume = 7,808,319,488.00
7,648,938,496 7,808,319,488
Aliran dana masuk masih terlihat dan volatilitas indeks turun relatif terbatas.
Pada Figure 2, terlihat dari hasil optimalisasi terakhir, indikator MFI optimized naik lebih lanjut dan indikator W%R optimized akan menguji support trendline dengan volume sekitar rata-rata, dengan demikian potensi koreksi relative terbatas, demikian juga halnya jika terjadi kenaikkan lebih lanjut. Daily resistance di 5,598dan daily support di 5,563. Stop loss level di 5,510.
Figure 2. Daily MFI optimized & W%R optimized
Source: Mirae Asset Sekuritas Indonesia Research
Created w ith AmiBroker - advanced charting and technical analysis softw are. http://w w w .amibroker.com
^JKSE - MFI Smoothed = 90.51 90.5108
^JKSE - Will%R Smoothed = -22.15
-22.1527
Optimization Trading System - ©2010 Optimization Trading System - ©2010
5,598
5,563
^JKSE - Daily 3/31/2017 Open 5589.52, Hi 5606.02, Lo 5568.11, Close 5568.11 (-0.4%) VWAP = 5,556.58, VWAP = 5,510.79
5,568.11 5,556.58 5,510.79
Oct Nov Dec 2017 Feb Mar
Optimization Trading System - ©2010
^JKSE - Volume = 7,648,938,496.00, Avg.Volume = 7,808,319,488.00
7,648,938,496 7,808,319,488
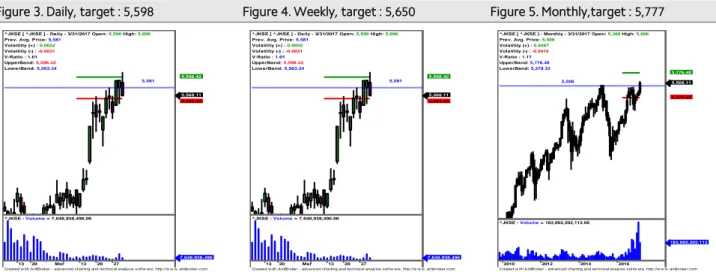
IHSG akan coba bertahan sekitar rata-rata masing-masing periode.
Untuk mampu naik lebih lanjut IHSG saat ini harus mampu bertahan diatas rata-rata masing-masing periode ( positive area) sebagaimana terlihat pada Figure 3,4 dan 5.
Figure 3. Daily, target : 5,598 Figure 4. Weekly, target : 5,650 Figure 5. Monthly,target : 5,777
x
Source: Mirae Asset Sekuritas Indonesia Research Source: Mirae Asset Sekuritas Indonesia Research Source: Mirae Asset Sekuritas Indonesia Research
Created w ith AmiBroker - advanced charting and technical analysis sof tw are. http://w w w .amibroker.com 5,581
^JKSE [ ^JKSE ] - Daily - 3/31/2017 Open: 5,590 High: 5,606 Prev. Avg. Price: 5,581
Volatility (+) : 0.0032 Volatility (-) : -0.0031 V-Ratio : 1.01 UpperBand: 5,598.42 LowerBand: 5,563.24
5,568.11 5,563.24 5,598.42
13 20 27 Mar 13 20 27
^JKSE - Volume = 7,648,938,496.00
7,648,938,496
Created w ith AmiBroker - advanced charting and technical analysis sof tw are. http://w w w .amibroker.com 5,508
^JKSE [ ^JKSE ] - Monthly - 3/31/2017 Open: 5,389 High: 5,606 Prev. Avg. Price: 5,508
Volatility (+) : 0.0487 Volatility (-) : -0.0416 V-Ratio : 1.17 UpperBand: 5,776.48 LowerBand: 5,279.33
5,568.11 5,279.33 5,776.48
2010 2012 2014 2016
^JKSE - Volume = 183,002,202,112.00
183,002,202,112
Stocks on our focus list
Bank Negara Indonesia (BBNI) – Trading Buy
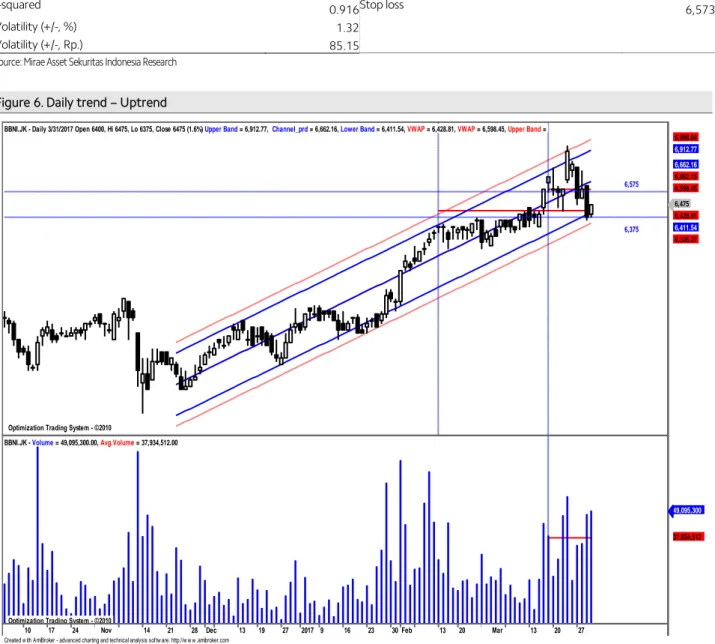
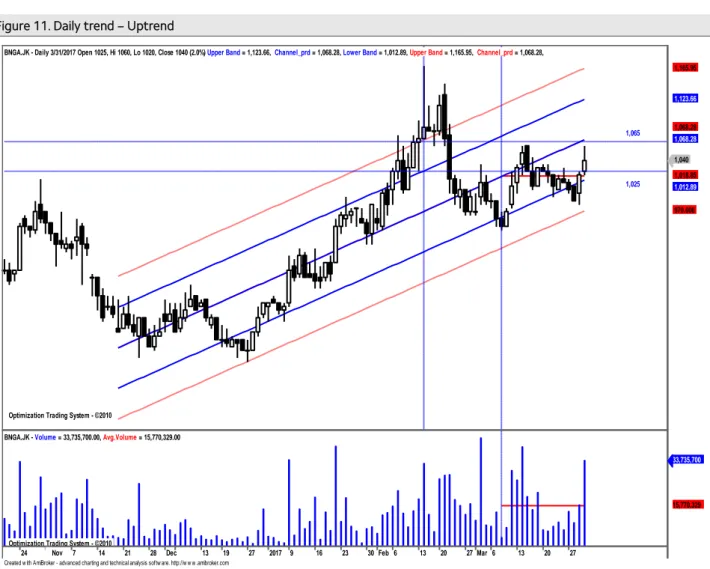
Harga akan coba bertahan diatas normal lower band pada uptrend channel.
Secara umum harga saham ini masih bergerak pada uptrend channel yang masih relatif valid (r-squared = 0.916) selama 88 hari terakhir yang bergerak normal dalam rentang +/- 1.73 std.deviasi dari center line. Peluang harga keluar dari pergerakan normal sekitar 8.38 % (sekitar 7 bar chart ). Volatilitas normal pergerakkan harga saham ini sepanjang uptrend channel sebesar +/- 1.32 % atau sekitar +/- 85.15 (potensi naik dan turun secara normal maksimum/minimum sebesar 75-100 rupiah) dari level penutupan terakhir sebagaimana terlihat pada Figure 6.
Summary
Item Data Item Data
Close (March 31, 2017) 6,475(+1.6%) Normal trading range 6,375-6,575
Relative Avg. Price performance to JCI (%) 0.34 Target
β (beta) 1.61 - Daily 6,575
Corelation 0.83 - Weekly 6,750
Period 88 - Monthly 7,150
r-squared 0.916 Stop loss 6,573
Volatility (+/-, %) 1.32
Volatility (+/-, Rp.) 85.15
Source: Mirae Asset Sekuritas Indonesia Research
Figure 6. Daily trend – Uptrend
Source: Mirae Asset Sekuritas Indonesia Research
Created w ith AmiBroker - advanced charting and technical analysis softw are. http://w w w .amibroker.com Optimization Trading System - ©2010
Optimization Trading System - ©2010 Optimization Trading System - ©2010 Optimization Trading System - ©2010
6,575
6,375 BBNI.JK - Daily 3/31/2017 Open 6400, Hi 6475, Lo 6375, Close 6475 (1.6%) Upper Band = 6,912.77, Channel_prd = 6,662.16, Lower Band = 6,411.54, VWAP = 6,428.81, VWAP = 6,598.45, Upper Band =
6,475 6,428.81 6,411.54 6,326.27 6,598.45 6,662.16 6,662.16 6,912.77 6,998.04
10 17 24 31Nov 14 21 28 Dec 13 19 27 2017 9 16 23 30 Feb 13 20 27 Mar 13 20 27
Optimization Trading System - ©2010
BBNI.JK - Volume = 49,095,300.00, Avg.Volume = 37,934,512.00
49,095,300
37,934,512
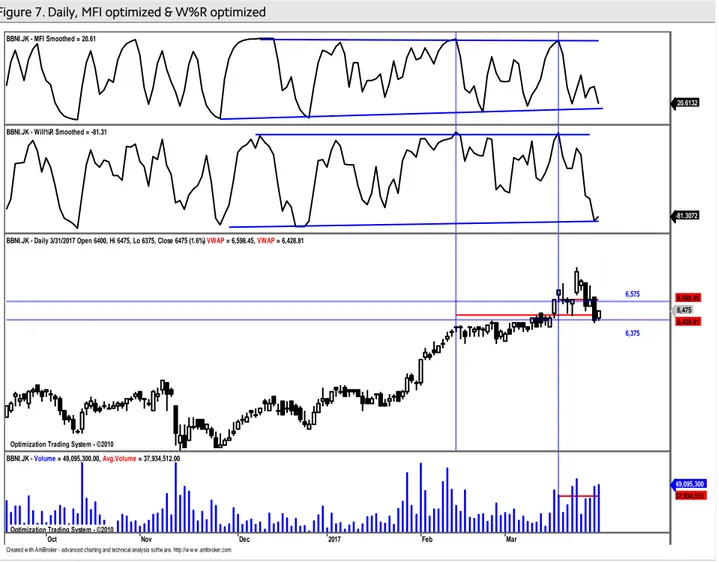
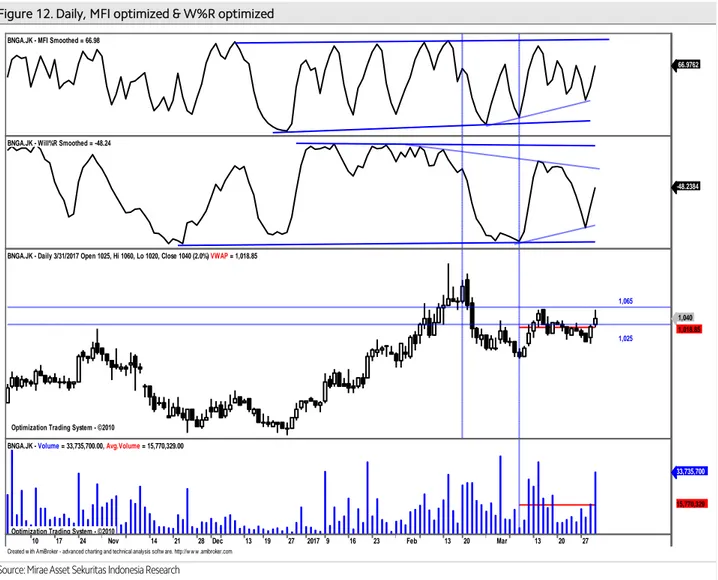
Aliran dana keluar relative terbatas dan volatilitas harga naik mulai terlihat.
Pada Figure 7, terlihat dari hasil optimalisasi terakhir, indikator MFI Optimized akan menguji support trendline dan indikator W%R Optimized masih cenderung naik dengan volume tembus rata-rata. Hal ini mengindikasikan potensi koreksi sudah terbatas dengan kecenderungan menguat.Daily resistance terdekat di 6,575 Daily support terdekat di 6,375 yang sekaligus sebagai stop loss level.
Figure 7. Daily, MFI optimized & W%R optimized
Source: Mirae Asset Sekuritas Indonesia Research
Created w ith AmiBroker - advanced charting and technical analysis softw are. http://w w w .amibroker.com BBNI.JK - MFI Smoothed = 20.61
20.6132
BBNI.JK - Will%R Smoothed = -81.31
-81.3072
Optimization Trading System - ©2010 Optimization Trading System - ©2010
6,375 6,575 BBNI.JK - Daily 3/31/2017 Open 6400, Hi 6475, Lo 6375, Close 6475 (1.6%) VWAP = 6,598.45, VWAP = 6,428.81
6,475 6,428.81 6,598.45
Oct Nov Dec 2017 Feb Mar
Optimization Trading System - ©2010
BBNI.JK - Volume = 49,095,300.00, Avg.Volume = 37,934,512.00
49,095,300 37,934,512
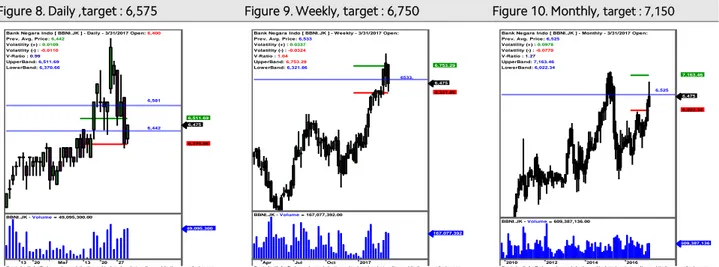
Harga akan coba bertahan diatas rata-rata (positive area) pada masing-masing periode.
Untuk naik lebih lanjut harga harus mampu bertahan minimal sekitarrata-rata dengan target kenaikkan terdekat ke resistance masing-masing periode sebagaimana terlihat pada Figure 8,9 dan 10.
Figure 8. Daily ,target : 6,575 Figure 9. Weekly, target : 6,750 Figure 10. Monthly, target : 7,150
Source: Mirae Asset Sekuritas Indonesia Research Source: Mirae Asset Sekuritas Indonesia Research Source: Mirae Asset Sekuritas Indonesia Research
Created w ith AmiBroker - advanced charting and technical analysis sof tw are. http://w w w .amibroker.com 6,625
6,475 6,442
6,581 Bank Negara Indo [ BBNI.JK ] - Daily - 3/31/2017 Open: 6,400 Prev. Avg. Price: 6,442
Volatility (+) : 0.0109 Volatility (-) : -0.0110 V-Ratio : 0.99 UpperBand: 6,511.69 LowerBand: 6,370.66
6,475
6,370.66 6,511.69
13 20 27 Mar 13 20 27
BBNI.JK - Volume = 49,095,300.00
49,095,300
Created w ith AmiBroker - advanced charting and technical analysis sof tw are. http://w w w .amibroker.com 6533, Bank Negara Indo [ BBNI.JK ] - Weekly - 3/31/2017 Open:
Prev. Avg. Price: 6,533 Volatility (+) : 0.0337 Volatility (-) : -0.0324 V-Ratio : 1.04 UpperBand: 6,753.29 LowerBand: 6,321.86
6,475 6,321.86 6,753.29
Apr Jul Oct 2017
BBNI.JK - Volume = 167,077,392.00
167,077,392
Created w ith AmiBroker - advanced charting and technical analysis sof tw are. http://w w w .amibroker.com 6,525 Bank Negara Indo [ BBNI.JK ] - Monthly - 3/31/2017 Open:
Prev. Avg. Price: 6,525 Volatility (+) : 0.0978 Volatility (-) : -0.0770 V-Ratio : 1.27 UpperBand: 7,163.46 LowerBand: 6,022.34
6,475 6,022.34 7,163.46
2010 2012 2014 2016
BBNI.JK - Volume = 609,387,136.00
609,387,136
Bank CIMB Niaga (BNGA) – Trading Buy
Harga akan coba tembus center line pada uptrend channel .
Secara umum harga saham ini juga masih bergerak dalam pola uptrend channel yang masih relatif valid (r-squared = 0,756) selama 91 hari terakhir dan bergerak normal dalam rentang +/- 1.16 std.deviasi dari center line. Peluang harga keluar dari pergerakan normal sekitar 24.41 % (sekitar 22 bar chart ). Volatilitas normal pergerakan harga saham ini sepanjang uptrend channel sebesar +/ 2.45 % atau sekitar +/- 25.53 (potensi naik dan turun secara normal maksimum/minimum sebesar 25 rupiah) dari level penutupan terakhir sebagaimana terlihat pada Figure 11.
Summary
Item Data Item Data
Close (March 31, 2017) 1,040(+2.0%) Normal trading range 1,025-1,065 Relative Avg. Price performance to JCI (%) 1.72 Target
β (beta) 0.68 - Daily 1,065
Corelation (0.01) - Weekly 1,065
Period 91 - Monthly 1,100
r-squared 0.756 Stop loss 1,010
Volatility (+/-, %) 2.45
Volatility (+/-, Rp.) 25.53
Source: Mirae Asset Sekuritas Indonesia Research
Figure 11. Daily trend – Uptrend
Source: Mirae Asset Sekuritas Indonesia Research
Created w ith AmiBroker - advanced charting and technical analysis softw are. http://w w w .amibroker.com Optimization Trading System - ©2010
Optimization Trading System - ©2010 Optimization Trading System - ©2010
1,025 1,065 BNGA.JK - Daily 3/31/2017 Open 1025, Hi 1060, Lo 1020, Close 1040 (2.0%) Upper Band = 1,123.66, Channel_prd = 1,068.28, Lower Band = 1,012.89, Upper Band = 1,165.95, Channel_prd = 1,068.28,
1,040 1,018.85 1,012.89 970.606 1,068.28 1,068.28 1,123.66 1,165.95
24 31Nov 7 14 21 28 Dec 13 19 27 2017 9 16 23 30 Feb 6 13 20 27 Mar 6 13 20 27
Optimization Trading System - ©2010
BNGA.JK - Volume = 33,735,700.00, Avg.Volume = 15,770,329.00
33,735,700
15,770,329
Aliran dana masuk dan volatilitas harga naik masih terlihat.
Pada Figure 12, terlihat dari hasil optimalisasi indikator MFI optimized dan indikator W%R optimized saat ini masih cenderung naik dengan volume tembus rata-rata Hal ini mengindikasikan potensi kenaikkan masih terlihat. Daily resistance berikutnya di 1,065 Dailysupport saat ini di 1,025. Stop loss level di 1,010.
Figure 12. Daily, MFI optimized & W%R optimized
Source: Mirae Asset Sekuritas Indonesia Research
Created w ith AmiBroker - advanced charting and technical analysis softw are. http://w w w .amibroker.com BNGA.JK - MFI Smoothed = 66.98
66.9762
BNGA.JK - Will%R Smoothed = -48.24
-48.2384
Optimization Trading System - ©2010
1,025 1,065 BNGA.JK - Daily 3/31/2017 Open 1025, Hi 1060, Lo 1020, Close 1040 (2.0%) VWAP = 1,018.85
1,040 1,018.85
10 17 24 31Nov 14 21 28 Dec 13 19 27 2017 9 16 23 30 Feb 13 20 27 Mar 13 20 27
Optimization Trading System - ©2010
BNGA.JK - Volume = 33,735,700.00, Avg.Volume = 15,770,329.00
33,735,700
15,770,329
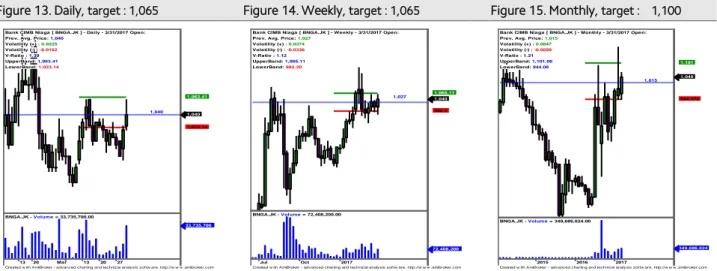
Harga saat ini akan coba bertahan sekitar rata-rata (positive area) pada masing- masing periode.
Untuk naik lebih lanjut harga harus mampu bertahan minimal sekitarrata-rata dengan target kenaikkan terdekat ke resistance masing-masing periode sebagaimana sebagaimana terlihat pada Figure 14,15 dan 16.
Figure 13. Daily, target : 1,065 Figure 14. Weekly, target : 1,065 Figure 15. Monthly, target : 1,100 x
Source: Mirae Asset Sekuritas Indonesia Research Source: Mirae Asset Sekuritas Indonesia Research Source: Mirae Asset Sekuritas Indonesia Research
Created w ith AmiBroker - advanced charting and technical analysis sof tw are. http://w w w .amibroker.com 1,040
Bank CIMB Niaga [ BNGA.JK ] - Daily - 3/31/2017 Open:
Prev. Avg. Price: 1,040 Volatility (+) : 0.0225 Volatility (-) : -0.0162 V-Ratio : 1.39 UpperBand: 1,063.41 LowerBand: 1,023.14
1,040 1,023.14 1,063.41
13 20 27 Mar 13 20 27
BNGA.JK - Volume = 33,735,700.00
33,735,700
Created w ith AmiBroker - advanced charting and technical analysis sof tw are. http://w w w .amibroker.com 1,027
Bank CIMB Niaga [ BNGA.JK ] - Weekly - 3/31/2017 Open:
Prev. Avg. Price: 1,027 Volatility (+) : 0.0374 Volatility (-) : -0.0336 V-Ratio : 1.12 UpperBand: 1,065.11 LowerBand: 992.20
1,040 992.2 1,065.11
Jul Oct 2017
BNGA.JK - Volume = 72,408,200.00
72,408,200
Created w ith AmiBroker - advanced charting and technical analysis sof tw are. http://w w w .amibroker.com 1,015
Bank CIMB Niaga [ BNGA.JK ] - Monthly - 3/31/2017 Open:
Prev. Avg. Price: 1,015 Volatility (+) : 0.0847 Volatility (-) : -0.0699 V-Ratio : 1.21 UpperBand: 1,101.00 LowerBand: 944.08
1,040
944.078 1,101
2015 2016 2017
BNGA.JK - Volume = 349,686,624.00
349,686,624
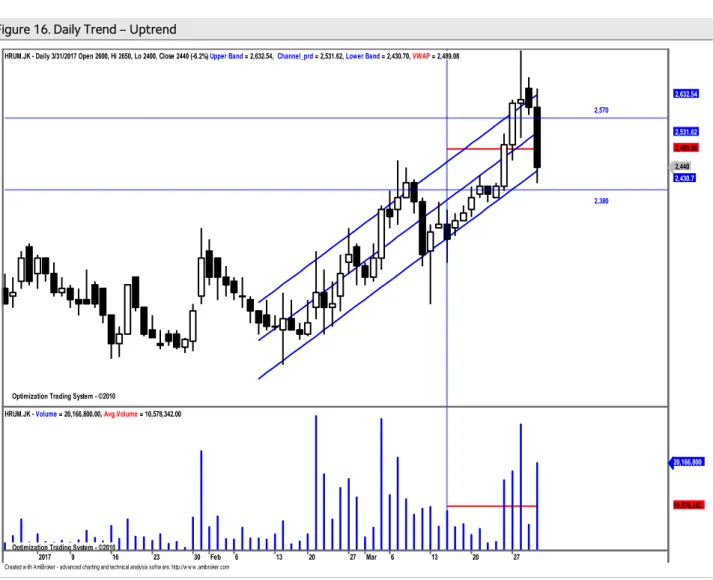
Harum Energy (HRUM) – Buy on Weakness
Harga akan coba naik mendekati center line pada uptrend channel.
Secara umum harga saham ini akan coba naik mendekati center line band pada uptrend channel yang masih relatif valid dengan r-squared = 0.856 selama 35 hari terakhir dan bergerak normal dalam rentang +/-1.46 std.deviasi dari centerline. Peluang harga keluar dari pergerakan normalnya sekitar 14.44 % (sekitar 5 bar chart ). Volatilitas normal pergerakan harga saham ini sepanjang uptrend channel sebesar +/-3.31 % atau sekitar +/- 80.6 (potensi naik dan turun secara normal maksimum/minimum sebesar 80 rupiah) dari level penutupan terakhir sebagaimana terlihat pada Figure 16.
Summary
Item Data Item Data
Close (March 31, 2017) 2,440(-6.2%) Normal trading range 2,380-2,570 Relative Avg. Price performance to JCI (%) 5.31 Target
β (beta) 0.79 - Daily 2,570
Corelation 0.83 - Weekly 2,740
Period 35 - Monthly 2,710
r-squared 0.856 Stop loss 2,380
Volatility (+/-, %) 3.31
Volatility (+/-, Rp.) 80.67
Source: Mirae Asset Sekuritas Indonesia Research
Figure 16. Daily Trend – Uptrend
Source: Mirae Asset Sekuritas Indonesia Research
Created w ith AmiBroker - advanced charting and technical analysis softw are. http://w w w .amibroker.com Optimization Trading System - ©2010
Optimization Trading System - ©2010
2,380 2,570 HRUM.JK - Daily 3/31/2017 Open 2600, Hi 2650, Lo 2400, Close 2440 (-6.2%) Upper Band = 2,632.54, Channel_prd = 2,531.62, Lower Band = 2,430.70, VWAP = 2,489.08
2,440 2,430.7 2,489.08 2,531.62 2,632.54
2017 9 16 23 30 Feb 6 13 20 27 Mar 6 13 20 27
Optimization Trading System - ©2010
HRUM.JK - Volume = 20,166,800.00, Avg.Volume = 10,578,342.00
20,166,800
10,578,342
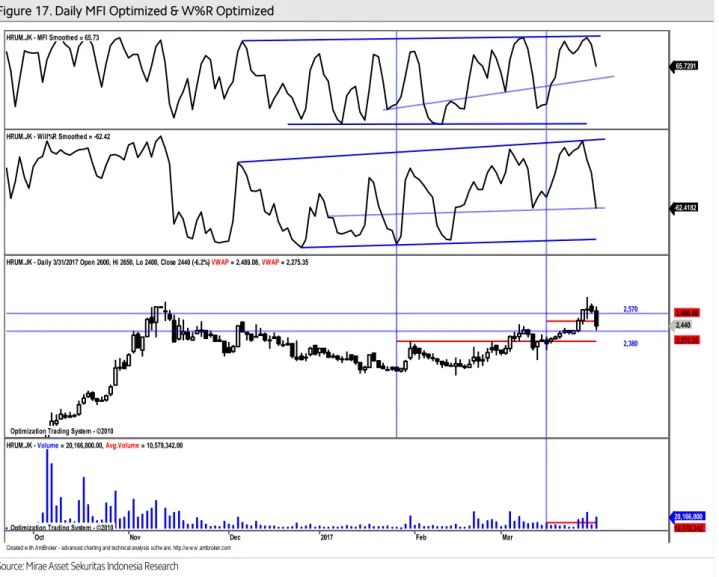
Aliran dana keluar dan volatilitas harga turun mulai terbatas.
Pada Figure 17, terlihat dari hasil optimalisasi, indikator MFI Optimized dan indikator W%R Optimized akan menguji support trend line dengan volume tembus rata-rata.
Dengan demikian diperkirakan potensi koreksi mulai terbatas. Perkiraan daily resistance terdekat ke 2,570. Dailysupport terdekat di 2,380 yang sekaligus sebagai cut loss level.
Figure 17. Daily MFI Optimized & W%R Optimized
Source: Mirae Asset Sekuritas Indonesia Research
Created w ith AmiBroker - advanced charting and technical analysis softw are. http://w w w .amibroker.com HRUM.JK - MFI Smoothed = 65.73
65.7291
HRUM.JK - Will%R Smoothed = -62.42
-62.4182
Optimization Trading System - ©2010 Optimization Trading System - ©2010
2,570
2,380 HRUM.JK - Daily 3/31/2017 Open 2600, Hi 2650, Lo 2400, Close 2440 (-6.2%) VWAP = 2,489.08, VWAP = 2,275.35
2,440 2,275.35 2,489.08
Oct Nov Dec 2017 Feb Mar
Optimization Trading System - ©2010
HRUM.JK - Volume = 20,166,800.00, Avg.Volume = 10,578,342.00
20,166,800 10,578,342
Harga akan coba naik mendekati rata-ratapada masing-masing periode.
Untuk naik lebih lanjut harga harus mampu bertahan minimal sekitarrata-rata dengan target kenaikkan terdekat ke resistance masing-masing periode sebagaimana terlihat pada Figure 18,19 dan 20.
Figure 18. Daily, target : 2,570 Figure 19. Weekly, target : 2,740 Figure 20. Monthly, target : 2,710
Source: Mirae Asset Sekuritas Indonesia Research Source: Mirae Asset Sekuritas Indonesia Research Source: Mirae Asset Sekuritas Indonesia Research
analyzed by : Tasrul, [email protected], +62-21- 5151140
Relative Avg.Price Performance to JCI (%) : Persentase kenaikan harga saham dari rata-rata sejak IHSG memulai uptrend-nya β (beta) : Indikator sensitivitas harga saham terhadap IHSG, beta diatas 1 berarti harga makin sensitif terhadap pergerakan IHSG dan sebaliknya
Correlation : Ukuran kuat hubungan (korelasi) pergerakan harga saham dibanding dengan pergerakan IHSG
Period : Periode uptrend / downtrend yang valid dari pergerakan harga saham
r-squared : Koefisien determinasi, menunjukkan persentase gerakan yang dapat dijelaskan dengan regresi linier.Nilai R2 terletak antara 0 – 1, dan kecocokan model dikatakan lebih baik kalau R2 semakin mendekati 1 (validitas uptrend atau downtrend makin valid) Volatility (+/-%) : Besaran volatilitas normal maksimal/minimal dari pergerakan harga harian selama harga saham bergerak normal pada trend channel dalam persentase.
Volatility (+/- point or Rp) : Besaran volatilitas normal maksimal/minimal dari pergerakan harga harian selama Harga saham bergerak
Buy : Beli, harga sudah menyentuh atau jatuh di bawah support dan indikator teknikal berada di oversold area.
Sell : Jual, harga sudah menyentuh atau tembus resistance normal dan indikator berada di overbought area.
BoW : Buy on Weakness, beli ketika harga sudah melemah, dimana volume tekanan jual mulai berkurang dan harga mendekatisupport, serta indikator teknikal sudah berada di oversold area.
SoS : Sell on Strength, jual ketika kenaikan harga sudah mulai terbatas dimana volume beli mulai berkurang dan harga mendekati resistance, serta indikator teknikal sudah berada di overbought area.
Trading Buy : Beli dan jual kembali secepatnya jika harga sudah mencapai level resistance terdekat, karena kenaikan harga relatif tidak stabil atau hanya sementara.
Trading Sell : Jual dan beli kembali secepatnya jika harga sudah mencapai level support terdekat karena koreksi harga relative tidak stabil atau hanya sementara.
Created w ith AmiBroker - advanced charting and technical analysis sof tw are. http://w w w .amibroker.com 2,497
2,383 Harum Energy Tbk [ HRUM.JK ] - Daily - 3/31/2017 Open:
Prev. Avg. Price: 2,497 Volatility (+) : 0.0284 Volatility (-) : -0.0224 V-Ratio : 1.27 UpperBand: 2,567.65 LowerBand: 2,440.67
2,440 2,440.67 2,567.65
13 20 27 Mar 13 20 27
HRUM.JK - Volume = 20,166,800.00
20,166,800
Created w ith AmiBroker - advanced charting and technical analysis sof tw are. http://w w w .amibroker.com 2,530
Harum Energy Tbk [ HRUM.JK ] - Weekly - 3/31/2017 Open:
Prev. Avg. Price: 2,530 Volatility (+) : 0.0822 Volatility (-) : -0.0383 V-Ratio : 2.14 UpperBand: 2,737.99 LowerBand: 2,433.01
2,440 2,433.01 2,737.99
Jul Oct 2017
HRUM.JK - Volume = 73,662,496.00
73,662,496
Created w ith AmiBroker - advanced charting and technical analysis sof tw are. http://w w w .amibroker.com 2,423
Harum Energy Tbk [ HRUM.JK ] - Monthly - 3/31/2017 Open:
Prev. Avg. Price: 2,423 Volatility (+) : 0.1190 Volatility (-) : -0.0859 V-Ratio : 1.39 UpperBand: 2,711.67 LowerBand: 2,215.18
2,440
2,215.18 2,711.67
2015 2016 2017
HRUM.JK - Volume = 248,346,512.00
248,346,512
Chart 21. JCI Vs. USD/IDR Chart 22. JCI performance (absolute vs. relative)
Source: Bloomberg, Mirae Asset Sekuritas Indonesia Note: Relative to MSCI EM Index
Source: Bloomberg, Mirae Asset Sekuritas Indonesia
Chart 23. Foreigner’s net purchase (EM) Chart 24. Energy price
Note: The latest figure for India are March 30th, 2017
Source: Bloomberg, Mirae Asset Sekuritas Indonesia Source: Bloomberg, Mirae Asset Sekuritas Indonesia
Chart 25. Non-ferrous metal price Chart 26. Precious metal price
Source: Bloomberg, Mirae Asset Sekuritas Indonesia Source: Bloomberg, Mirae Asset Sekuritas Indonesia 13,000
13,200 13,400 13,600 13,800
4,700 4,900 5,100 5,300 5,500 5,700
1/3 1/31 2/28 3/28
(IDR)
(pt) JCI (L) USD/IDR (R)
-0.4
0.1
3.3
15.0
0.7 0.8 0.3
-1.0 -4
0 4 8 12 16
1D 1W 1M 1Y
Absolute Relative (%, %p)
0
-41 -20 -8
0 68
113
910
170
403
-132
1,559
-400 -200 0 200 400 600 800 1,000 1,200 1,400 1,600 1,800
Korea Taiwan Indonesia Thailand Philippines India
1 Day 5 Days
(USDmn) (USDmn) (USDmn) (USDmn)
80 85 90 95 100 105
1/3 1/31 2/28 3/28
CPO WTI Coal
(D-3M=100)
80 85 90 95 100 105 110 115
1/3 1/31 2/28 3/28
(D-3M=100) Copper Nickel Tin
90 95 100 105 110 115
1/3 1/31 2/28 3/28
Silver Gold Platinum
(D-3M=100)
Table. Key valuation metrics
Company Name Ticker
Price Market Cap Price Performance (%) P/E(X)* P/B(X)* ROE(%)*
(IDR) (IDRbn) 1D 1W 1M 1Y FY16 FY17 FY16 FY17 FY16 FY17
Jakarta Composite Index JCI 5,568 6,099,032 -0.4 0.1 3.4 14.9 16.1 14.2 2.3 2.1 18.1 18.6
FINANCIALS
Bank Central Asia BBCA 16,550 408,040 -1.6 -0.3 7.1 24.4 18.5 17.9 3.4 3.2 20.4 18.9
Bank Mandiri Persero BMRI 11,700 273,000 -0.6 -1.7 3.5 13.6 19.6 13.7 1.8 1.7 10.3 12.7
Bank Rakyat Indonesia Persero BBRI 12,975 320,082 0.2 -1.3 8.6 13.6 10.9 11.4 1.9 2.0 20.2 18.2
Bank Negara Indonesia Persero BBNI 6,475 120,750 1.6 -6.2 3.6 24.5 9.1 9.1 1.2 1.3 13.9 14.6
Bank Tabungan Negara Persero BBTN 2,270 24,039 -0.4 -2.2 6.1 30.1 13.3 11.8 1.0 1.1 7.6 10.1
CONSUMER
HM Sampoerna HMSP 3,900 453,640 -2.5 -1.5 0.8 -0.9 34.8 33.5 13.0 12.6 38.6 37.9
Gudang Garam GGRM 65,525 126,076 -1.8 0.1 -0.5 0.3 18.4 16.6 3.1 2.8 17.3 17.8
Indofood CBP Sukses Makmur ICBP 8,150 95,045 -1.2 -7.1 -2.1 7.2 27.8 24.3 5.7 4.9 21.8 21.3
Indofood Sukses Makmur INDF 8,000 70,243 0.0 -0.9 -1.5 10.7 18.3 15.7 2.4 2.2 14.7 14.0
Kalbe Farma KLBF 1,540 72,188 -0.6 3.4 0.7 6.6 30.9 28.5 5.9 5.4 20.2 20.2
Unilever Indonesia UNVR 43,325 330,570 -0.9 1.9 2.7 0.9 46.3 46.0 62.9 59.7 134.1 137.2
AGRICULTURAL
Astra Agro Lestari AALI 14,900 28,678 -1.7 -1.3 -0.3 -14.1 14.8 15.2 1.9 1.6 14.1 10.9
PP London Sumatera Indonesia LSIP 1,465 9,995 0.0 -1.7 -0.7 -19.5 20.0 13.1 1.6 1.2 7.9 9.6
Sawit Sumbermas Sarana SSMS 1,655 15,764 0.6 6.4 8.5 -14.0 22.5 18.0 3.9 3.4 17.5 18.8
INFRASTRUCTURE
XL Axiata EXCL 3,060 32,705 -5.0 -6.7 2.3 -22.4 60.8 71.6 1.2 1.5 2.1 1.7
Jasa Marga JSMR 4,620 33,531 -0.2 -0.9 -3.3 -14.2 15.6 17.7 2.3 2.2 15.7 12.7
Perusahaan Gas Negara PGAS 2,530 61,331 -0.8 1.6 -10.6 -3.3 15.3 11.2 1.5 1.3 9.8 11.9
Tower Bersama Infrastructure TBIG 5,450 24,696 -5.2 -4.4 9.0 -6.4 17.4 19.3 14.3 7.7 83.6 45.7
Telekomunikasi Indonesia TLKM 4,130 416,304 -0.2 1.0 7.3 24.8 20.3 18.1 4.7 4.2 24.3 23.7
Soechi Lines SOCI 384 2,711 17.8 20.0 43.3 -22.9 8.2 4.8 0.9 N/A 15.9 11.3
Garuda Indonesia GIAA 342 8,853 -0.6 -0.6 0.0 -22.3 31.7 20.5 2.6 2.5 8.6 13.2
BASIC-INDUSTRIES
Semen Indonesia SMGR 9,000 53,384 1.7 -0.8 -6.5 -11.5 12.0 13.7 1.9 1.7 16.3 12.9
Charoen Pokphand Indonesia CPIN 3,200 52,474 -3.0 -3.0 3.2 -10.9 22.9 15.4 3.4 3.1 15.6 21.2
Indocement Tunggal Prakarsa INTP 16,600 61,108 -0.3 1.1 9.6 -15.8 14.6 17.1 2.2 2.2 15.5 12.9
Japfa Comfeed Indonesia JPFA 1,545 17,629 0.7 -1.9 -10.4 93.1 7.7 8.9 1.9 1.7 28.6 20.5
MINING
Indo Tambangraya Megah ITMG 20,200 22,824 1.4 5.2 14.8 204.9 10.4 9.0 1.5 1.8 15.0 18.4
Adaro Energy ADRO 1,750 55,975 -3.8 0.6 3.2 171.3 12.0 10.9 1.3 1.2 11.1 10.7
Aneka Tambang ANTM 730 17,542 0.7 -2.0 -2.0 57.3 298.3 268.9 1.2 1.0 0.4 2.5
Vale Indonesia INCO 2,390 23,748 3.9 1.7 -6.3 36.6 N/A 35.9 1.1 0.9 0.1 2.4
Tambang Batubara Bukit Asam PTBA 13,200 30,415 2.1 13.5 18.1 110.4 13.1 10.7 2.5 2.4 20.5 22.2
TRADE
United Tractors UNTR 26,500 98,849 -4.8 -4.0 7.5 73.2 15.8 15.4 1.9 2.2 12.7 14.6
AKR Corporindo AKRA 6,250 24,949 -0.8 -5.3 -1.6 -10.1 23.5 20.0 3.5 3.2 15.7 16.6
Global Mediacom BMTR 520 7,383 0.0 2.0 -3.7 -56.8 N/A N/A N/A N/A N/A N/A
Matahari Department Store LPPF 13,175 38,444 0.4 -7.5 -3.5 -28.2 21.9 16.9 23.8 14.1 136.4 92.3
Media Nusantara Citra MNCN 1,850 26,411 2.2 5.1 11.4 -15.1 14.5 12.7 2.4 2.1 16.9 17.5
Matahari Putra Prima MPPA 1,105 5,943 0.0 -3.9 -8.3 -31.8 211.4 35.4 3.3 2.3 1.6 4.7
Surya Citra Media SCMA 2,700 39,478 0.0 -0.7 -8.5 -14.0 27.2 21.7 11.9 9.5 45.7 46.5
Siloam International Hospital SILO 14,000 18,209 0.2 -0.4 6.1 94.9 150.3 120.2 4.5 6.1 3.5 4.7
PROPERTY
Bumi Serpong Damai BSDE 1,885 36,280 1.3 2.2 3.0 2.7 18.8 15.0 1.6 1.6 9.1 10.6
Adhi Karya ADHI 2,370 8,439 0.4 -1.7 11.3 -11.9 23.6 14.2 1.4 1.4 5.9 10.0
Alam Sutera Realty ASRI 362 7,113 -0.5 -1.1 -2.7 -2.7 8.4 6.2 0.9 0.8 11.4 11.8
Ciputra Development CTRA 1,230 22,829 1.2 -3.1 -10.2 -5.2 23.8 15.7 2.7 1.7 16.0 12.0
Lippo Karawaci LPKR 725 16,731 -0.7 -2.7 -1.4 -30.6 18.6 14.9 0.9 0.8 5.0 6.1
Pembangunan Perumahan PTPP 3,310 20,522 0.0 -3.8 -4.9 -9.8 23.1 14.3 2.4 1.9 14.4 15.6
Pakuwon Jati PWON 615 29,618 3.4 2.5 4.2 27.1 16.3 14.6 3.1 2.8 21.0 19.9
Summarecon Agung SMRA 1,340 19,332 0.4 -2.2 -2.2 -15.5 61.3 42.9 3.1 3.0 5.1 7.3
Wijaya Karya WIKA 2,410 21,618 -0.8 -3.2 -3.6 -0.3 14.4 17.8 1.8 1.8 12.9 10.3
Waskita Karya WSKT 2,370 32,170 -1.7 -4.0 -4.4 18.2 17.3 13.9 3.1 2.0 16.6 16.6
MISCELLANEOUS
Astra International ASII 8,625 349,171 -0.6 2.1 5.2 19.0 22.1 17.8 3.0 2.9 14.2 16.3
Source: Bloomberg, Mirae Asset Sekuritas Indonesia
*Note: Valuation metrics based on Bloomberg consensus estimates
Sector performance Top 10 market cap performance
Name Index Chg (%) Ticker Price Market Cap (IDRbn) Chg (%)
Agricultural 1,882.3 0.5 SMRU IJ 500 6,250 21.36
Mining 1,524.4 0.0 IIKP IJ 2950 9,912 16.14
Basic-Industry 589.1 0.2 VIVA IJ 340 5,598 10.39
Miscellaneous Industry 1,464.1 -0.5 PNBN IJ 905 21,799 7.74
Consumer Goods 2,404.7 -1.3 BWPT IJ 338 10,656 7.0
Property & Construction 510.4 0.6 BJTM IJ 690 10,313 5.34
Infrastructure 1,101.9 -0.4 MAPI IJ 5975 9,919 5.29
Finance 872.2 -0.3 SMBR IJ 3480 34,235 4.50
Trade 888.1 -0.6 AUTO IJ 2800 13,495 4.5
Composite 5,568.1 -0.4 MYRX IJ 142 11,178 4.41
Source: Bloomberg
Top 5 leading movers Top 5 lagging movers
Name Chg (%) Close Name Chg (%) Close
BBNI IJ 1.6 6,475 HMSP IJ -2.5 3,900
PNBN IJ 7.7 905 BBCA IJ -1.6 16,550
SMBR IJ 4.5 3,480 UNTR IJ -4.9 26,500
IIKP IJ 16.1 2,950 UNVR IJ -0.9 43,325
JGLE IJ 24.0 310 GGRM IJ -1.8 65,525
Source: Bloomberg
Economic Calendar
Time Currency Detail Forecast Previous
6:30am AUD AIG Manufacturing Index 59.3
6:30am JPY Final Manufacturing PMI 52.6
6:50am JPY Tankan Manufacturing Index 10
6:50am JPY Tankan Non-Manufacturing Index 18
All Day CNY Bank Holiday
8:00am AUD MI Inflation Gauge m/m -0.3%
8:30am AUD Retail Sales m/m 0.4%
8:30am AUD Building Approvals m/m 1.8%
8:30am AUD ANZ Job Advertisements m/m -0.7%
8:45am CNY Caixin Manufacturing PMI 51.7
12:00pm JPY BOJ Core CPI y/y 0.2%
1:30pm AUD Commodity Prices y/y 56.0%
2:15pm CHF Retail Sales y/y -1.4%
2:15pm EUR Spanish Manufacturing PMI 54.8
2:30pm CHF Manufacturing PMI 57.8
2:45pm EUR Italian Manufacturing PMI 55.0
2:50pm EUR French Final Manufacturing PMI 53.4
2:55pm EUR German Final Manufacturing PMI 58.3
3:00pm EUR Final Manufacturing PMI 56.2
3:00pm EUR Italian Monthly Unemployment Rate 11.9%
3:30pm GBP Manufacturing PMI 54.6
4:00pm EUR PPI m/m 0.7%
4:00pm EUR Unemployment Rate 9.6%
8:30pm CAD RBC Manufacturing PMI 54.7
8:45pm USD Final Manufacturing PMI 53.4
9:00pm USD ISM Manufacturing PMI 57.7
9:00pm USD Construction Spending m/m -1.0%
9:00pm USD ISM Manufacturing Prices 68.0
9:30pm CAD BOC Business Outlook Survey
9:30pm USD FOMC Member Dudley Speaks
All Day USD Total Vehicle Sales 17.6M
Note: Time is based on Indonesian local time Source: Forex Factory
Disclaimers
This report is prepared strictly for private circulation only to clients of PT Mirae Asset Sekuritas Indonesia (MASI). It is purposed only to person having professional experience in matters relating to investments. The information contained in this report has been taken from sources which we deem reliable. No warranty (express or implied) is made to the accuracy or completeness of the information. All opinions and estimates included in this report constitute our judgments as of this date, without regards to its fairness, and are subject to change without notice. However, none of MASI and/or its affiliated companies and/or their respective employees and/or agents makes any representation or warranty (express or implied) or accepts any responsibility or liability as to, or in relation to, the accuracy or completeness of the information and opinions contained in this report or as to any information contained in this report or any other such information or opinions remaining unchanged after the issue thereof. We expressly disclaim any responsibility or liability (express or implied) of MASI, its affiliated companies and their respective employees and agents whatsoever and howsoever arising (including, without limitation for any claims, proceedings, action, suits, losses, expenses, damages or costs) which may be brought against or suffered by any person as a results of acting in reliance upon the whole or any part of the contents of this report and neither MASI, its affiliated companies or their respective employees or agents accepts liability for any errors, omissions or misstatements, negligent or otherwise, in the report and any liability in respect of the report or any inaccuracy therein or omission there from which might otherwise arise is hereby expresses disclaimed.
This document is not an offer to sell or a solicitation to buy any securities. This firms and its affiliates and their officers and employees may have a position, make markets, act as principal or engage in transaction in securities or related investments of any company mentioned herein, may perform services for or solicit business from any company mentioned herein, and may have acted upon or used any of the recommendations herein before they have been provided to you. © PT Mirae Asset Sekuritas Indonesia 2016.