Taye Shim +62-21-515-3281 [email protected] To subscribe to our Daily Focus, please contact us at [email protected]
Mirae Asset Sekuritas Indonesia
GDP forecast revised
Source: Mirae Asset Sekuritas Indonesia Research
Embun Pagi
August 11, 2017
Enduring the pain
- Saatnya untuk meredakan kegembiraan: Sejak awal tahun ini, pasar tetap bullish.
Investor asing mendukung pendorong Indeks Harga Saham Gabungan (IHSG) ke rekor tertinggi dengan pembelian aktif. Namun, kita sekarang menyaksikan kegembiraan yang mereda karena investor mulai menilai kembali kembali fundamental pertumbuhan konsumsi Indonesia, 2) janji pembangunan infrastruktur pemerintah, 3) prospek pasar komoditas, dan 4) meningkatnya risiko politik.
- Meninjau kembali cerita konsumsi: Masalah dalam pertumbuhan konsumsi yang lamban adalah "inflasi". Kami berpendapat bahwa inflasi adalah argumen yang meyakinkan bagi perusahaan konsumen untuk meningkatkan ASP produk mereka.
Tekanan inflasi cenderung membuat investor khawatir terhadap pertumbuhan pendapatan perusahaan konsumer.
- Cukupkah pengeluaran dari pemerintah untuk infrastruktur? Kami percaya ada kemacetan struktural terhadap anggaran pemerintah. Kami mengharapkan tantangan untuk bertahan dalam menjaga janji pembangunan infrastrukturnya.
- Dinamika penawaran dan permintaan komoditas belum mencapai ekuilibrium.
Kami meperkirakan kekhawatiran dalam supply pada minyak mentah dan permintaan terkait pembangunan minyak sawit mentah (UE) dan batubara (China).
- Perhatian utama yang kita hadapi pada pemilihan Presiden mendatang (17 April 2019) adalah potensi spillover terhadap ekonomi riil.
Berbalik konservatif: Kami percaya inilah saatnya mengelola risiko daripada menjadi bersemangat. Kami merekomendasikan investor untuk mengambil pendekatan konservatif dalam keputusan investasi mereka. Key calls kami adalah BBCA, KLBF, TLKM, BRPT, dan WSBP.
Market Index
Last Trade Chg (%) MoM YoY
JCI 5,825.9 0.0 0.9 7.5
MSCI Indonesia 26.5 -1.2 0.0 0.7
MSCI EM 1,056.2 -1.2 5.0 17.8
HANG SENG 27,444.0 -1.1 7.3 22.9
KOSPI 2,359.5 -1.2 -1.5 15.2
FTSE 7,389.9 -1.5 2.3 8.4
DJIA 21,844.0 -0.9 3.0 18.5
NASDAQ 6,216.9 -2.1 2.6 21.5
Valuation
2017F P/E (x) P/B (x) ROE (%)
JCI 16.8 2.6 18.9
Key Rates
Last Trade Chg (bps) MoM YoY
BI 7-Day RR 4.75 0 0 -50
3yr 6.62 -3 -28 5
10yr 6.88 1 -27 11
FX
Last Trade Chg (%) MoM YoY
USD/IDR 13,333.00 0.0 -0.5 1.7
USD/KRW 1,141.75 0.6 -0.8 3.8
USD/JPY 109.20 -0.8 -4.2 7.1
USD/CNY 6.65 -0.5 -1.9 0.6
Commodities
Last Trade Chg (%) MoM YoY
WTI 48.6 -2.0 7.4 -0.8
Gold 1,286.5 0.7 5.7 -3.9
Coal 95.9 1.4 16.4 44.6
Palm Oil 2,663.0 -1.6 -4.6 -1.9
Rubber 136.5 0.0 7.5 4.1
Nickel 10,985.0 2.1 20.3 2.3
Copper 6,423.0 -0.5 9.3 32.5
Tin 20,325.0 0.6 1.6 8.9
JCI Index VS MSCI Emerging Markets
650 800 950 1,100
3,500 4,500 5,500
07/13 07/14 07/15 07/16 07/17
JCI MSCI EM (pt)
(pt)
800 950 1,100
4,500 5,500
(pt) JCI MSCI EM (pt)
Mirae Asset Sekuritas Indonesia cartoon
Local flashes
ERAA: Erajaya sambut upaya pemberantasan ponsel ilegal. Kementrian Perindustrian dan Qualcomm incorporated meneken perjanjian kerjasama terkait dengan proses validasi data base International Mobile Equipment (IMEI). Program tersebut rencananya akan berjalan dalam enam bulan ke depan. Aksi pemerintah ini oleh distributor ponsel disambut dengan sangat baik, salah satunya PT Erajaya Swasembada Tbk (ERAA) yang menyatakan bahwa hal tersebut tak hanya merugikan distributor resmi namun juga merugikan pemerintah dengan potensi pajak yang berkurang.
(Kontan)
ISAT: Laba Indosat melompat 83% berkah efisiensi. PT Indosat Tbk (ISAT) mampu mencatat laba bersih yang lebih baik. Berdasarkan laporan keuangan perusahaan, kenaikan laba bersih ISAT mencapai 83% year on year (yoy) menjadi Rp 784,21 miliar dari yang sebelumnya Rp 428,07 miliar. Kenaikan laba bersih itu tak lepas dari kenaikan pendapatan ISAT sebesar 8% jadi Rp 15,11 triliun dari sebelumnya Rp 13,94 triliun.
Pada saat yang bersamaan, ISAT mampu memotong biaya pemasaran. Hal ini terlihat dari turunnya beban pemasaran sebesar 11% menjadi Rp 593,37 miliar. (Kontan)
ASII: Astra tertarik beli tol Trans Jawa milik Waskita. PT Waskita Karya (Persero) Tbk (WSKT) akan mendivestasi 9 ruas tol miliknya. Dari rencana tersebut, sepertinya Tol Trans Jawa bakal laku keras. PT Astra International Tbk (ASII) sudah menyatakan minatnya untuk ambil bagian dalam rencana penjualan ruas tol milik Waskita. (Kontan)
JSMR: Jasa Marga kaji akuisisi ruas tol Trans Jawa. PT Jasa Marga (Persero) Tbk (JSMR) juga meminati ruas tol yang bakal dilepas PT Waskita Karya (Persero) Tbk (WSKT).
Agus Setiawan, Sekretaris Perusahaan JSMR mengatakan, pihaknya akan fokus pada ruas tol Trans Jawa ketika ambil bagian dalam proses jual beli tersebut. (Kontan)
CSAP: Catur Sentosa siap tambah 2 toko Mitra10. PT Catur Sentosa Adiprana Tbk (CSAP) akan menambah dua toko Mitra10 lagi tahun ini. Penambahan tersebut, akan menggenapi rencana CSAP yang akan menambah empat toko baru untuk tahun ini.
Dimana dua toko sebelumnya sudah terealisasi pada semester 1-2017. Sebelumnya, CSAP telah membangun dua toko Mitra10. Lokasinya berada di Pantai Indah Kapuk (PIK) dengan luas 300 m2 dan Qbig, BSD dengan luas 7.000 m2. (Kontan)
PLIN: September, PLIN rilis global bond US$ 300 juta. PT Plaza Indonesia Realty Tbk (PLIN) berencana mencari pendanaan melalui instrumen surat utang. Pemilik pusat perbelanjaan Grand Indonesia itu berencana menerbitkan global bond senilai US$ 300 juta atau setara sekitar Rp 4 triliun. Transaksi direncanakan akan dilaksanakaan pada September 2017," ujar Lucy Suyanto, Direktur PLIN. Rencana tersebut mempertimbangkan waktu RUPSLB terkait aksi korporasi ini yang baru akan dilaksanakan pada 15 Agustus mendatang. Global Bond tersebut rencananya akan dicatatkan di Bursa Efek Singapura. (Kontan)
Technical analysis
Tasrul +62-21-515-1140 [email protected]
Jakarta Composite Index (JCI) – Consolidation
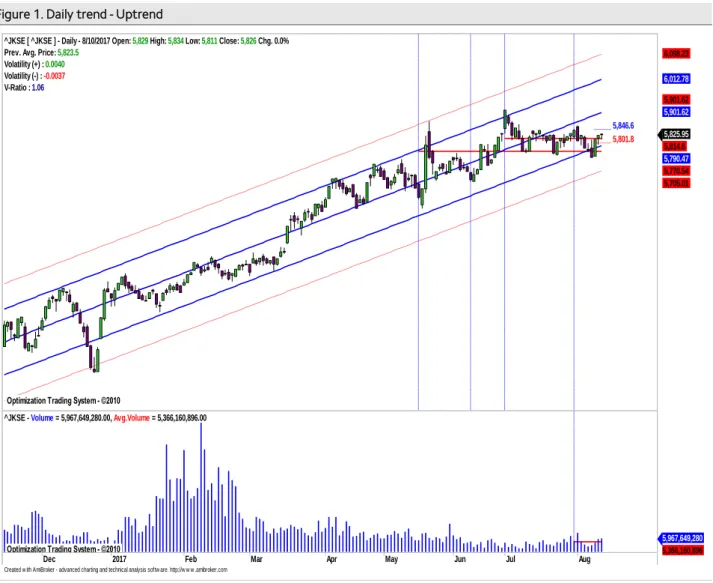
IHSG akan coba naik dan bertahan diatas normal lower band pada uptrend channel
IHSG saat masih dalam pola uptrend jangka pendek relatif valid yang dimulai sejak 176 hari terakhir dengan r-squared = 0.9348 dan bergerak normal dalam rentang +/-1.84 std.deviasi dari centerline. Peluang IHSG bergerak di luar pergerakan normal sekitar 6.52%
atau sekitar 11 bar chart. Rata-rata volatilitas normal pergerakan IHSG saat ini sebesar antara +0.40 % / - 0.37 % atau +23.29 point / -21.55 point (rata-rata pergerakan normal positif / negatif selama periode analisis) sebagaimana terlihat pada Figure 1.
Summary
Item Data Item Data
Close (Aug 10, 2017) 5,825.95(+0.0%) Trading range 5,804 – 5,849 Average index performance (%) 6.86 Target
Period 176 - Daily 5,847
r-squared 0.9348 - Weekly 5,865
Volatility (+/-, %) +0.40 / -0.37 - Monthly 5,929
Volatility (+/-, point) +23.29 / -21.55 Stop loss 5,791
Source: Mirae Asset Sekuritas Indonesia Research
Figure 1. Daily trend - Uptrend
Source: Mirae Asset Sekuritas Indonesia Research
Created w ith AmiBroker - advanced charting and technical analysis softw are. http://w w w .amibroker.com
_____ 5,846.6 _____ 5,801.8
Optimization Trading System - ©2010 Optimization Trading System - ©2010 Optimization Trading System - ©2010 Optimization Trading System - ©2010
^JKSE [ ^JKSE ] - Daily - 8/10/2017 Open: 5,829 High: 5,834 Low: 5,811 Close: 5,826 Chg. 0.0%
Prev. Avg. Price: 5,823.5 Volatility (+) : 0.0040 Volatility (-) : -0.0037 V-Ratio : 1.06
5,825.95 5,814.6 5,790.47 5,770.54 5,705.01 5,901.62 5,901.62 6,012.78 6,098.23
Dec 2017 Feb Mar Apr May Jun Jul Aug
Optimization Trading System - ©2010
^JKSE - Volume = 5,967,649,280.00, Avg.Volume = 5,366,160,896.00
5,967,649,280 5,366,160,896
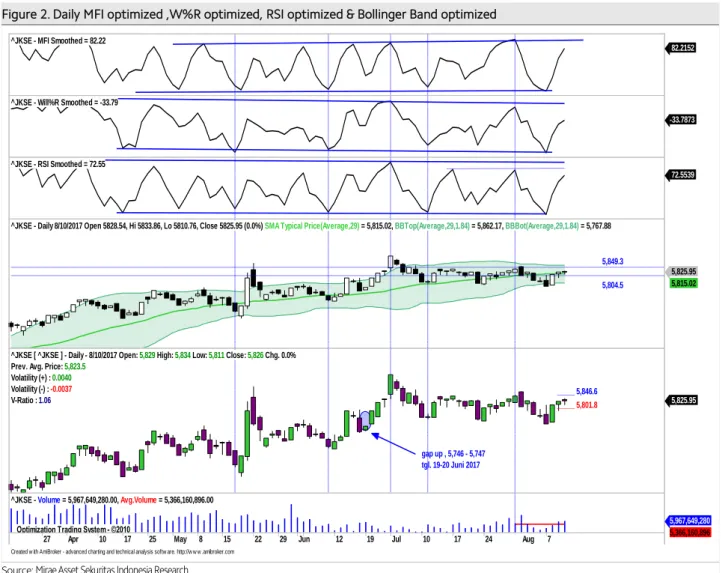
Aliran dana masuk dan volatilitaspergerakkan indeks naik masih terlihat.
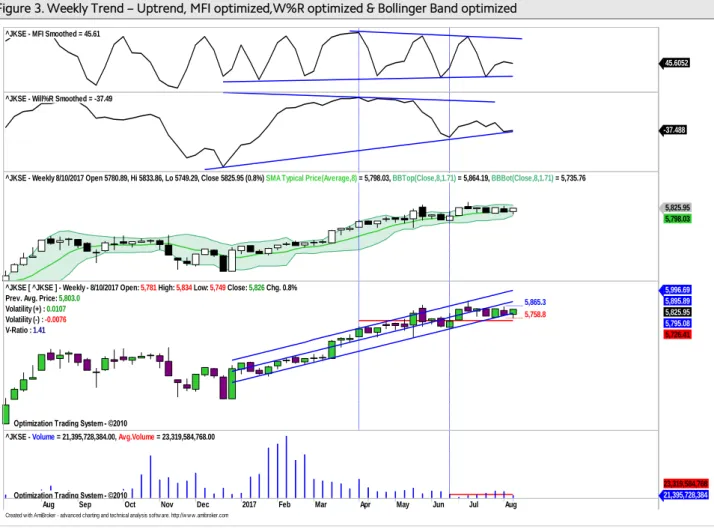
Pada Figure 2, terlihat dari hasil optimalisasi terakhir pada periode daily terlihat indikator MFI optimized , indikator W%R optimized dan indikator RSI optimized , menguji masih cenderung naik. Hal ini juga terlihat pada Bollinger Band optimized, dimana masih terlihat ruang gerak untuk naik. Sementara itu pada Figure 3 pada periode weekly pergerakkan indikator MFI Optimized relative flat dan indikator W%R optimized masih cenderung naik. Daily resistance di 5,847 dan daily support di 5,802. Cut loss level di 5,791.
Figure 2. Daily MFI optimized ,W%R optimized, RSI optimized & Bollinger Band optimized
Source: Mirae Asset Sekuritas Indonesia Research
Created w ith AmiBroker - advanced charting and technical analysis softw are. http://w w w .amibroker.com
^JKSE - MFI Smoothed = 82.22
82.2152
^JKSE - Will%R Smoothed = -33.79
-33.7873
^JKSE - RSI Smoothed = 72.55
72.5539
5,849.3 5,804.5
^JKSE - Daily 8/10/2017 Open 5828.54, Hi 5833.86, Lo 5810.76, Close 5825.95 (0.0%) SMA Typical Price(Average,29) = 5,815.02, BBTop(Average,29,1.84) = 5,862.17, BBBot(Average,29,1.84) = 5,767.88
5,825.95 5,815.02
_____ 5,846.6 _____ 5,801.8
gap up , 5,746 - 5,747 tgl. 19-20 Juni 2017
^JKSE [ ^JKSE ] - Daily - 8/10/2017 Open: 5,829 High: 5,834 Low: 5,811 Close: 5,826 Chg. 0.0%
Prev. Avg. Price: 5,823.5 Volatility (+) : 0.0040 Volatility (-) : -0.0037
V-Ratio : 1.06 5,825.95
27 Apr 10 17 25 May 8 15 22 29 Jun 12 19 Jul 10 17 24 31Aug 7
Optimization Trading System - ©2010
^JKSE - Volume = 5,967,649,280.00, Avg.Volume = 5,366,160,896.00
5,967,649,280 5,366,160,896
Figure 3. Weekly Trend – Uptrend, MFI optimized,W%R optimized & Bollinger Band optimized
Source: Mirae Asset Sekuritas Indonesia Research
IHSG untuk mampu naik lebih lanjut, harus mampu bertahan diatas level 5,823.
Untuk mampu kembali bergerak naik, indeks ini harus mampu dipertahankan pada level 5,823. Terlihat pada pergerakkan daily, rata-rata kenaikkan normal selama periode analisis adalah sekitar +0.4%, sementara saat masih di level +0.0%. Sementara itu pada pergerakkan weekly potensi kenaikkan normal rata-rata sekitar +1.07%, saat ini sekitar +0.8%. Dengan demikian potensi kenaikkanmasih terlihat. Pada Figure 4,5 dan 6 terlihat perkiraan normal trading range untuk masing-masing periode.
Figure 4. Daily : 5,802 – 5,847 Figure 5. Weekly : 5,759– 5,865 Figure 6. Monthly : 5,693– 5,929
x
Source: Mirae Asset Sekuritas Indonesia Research Source: Mirae Asset Sekuritas Indonesia Research Source: Mirae Asset Sekuritas Indonesia Research
Created w ith AmiBroker - advanced charting and technical analysis softw are. http://w w w .amibroker.com
^JKSE - MFI Smoothed = 45.61
45.6052
^JKSE - Will%R Smoothed = -37.49
-37.488
^JKSE - Weekly 8/10/2017 Open 5780.89, Hi 5833.86, Lo 5749.29, Close 5825.95 (0.8%) SMA Typical Price(Average,8) = 5,798.03, BBTop(Close,8,1.71) = 5,864.19, BBBot(Close,8,1.71) = 5,735.76
5,825.95 5,798.03
Optimization Trading System - ©2010
_____ 5,865.3 _____ 5,758.8
Optimization Trading System - ©2010
^JKSE [ ^JKSE ] - Weekly - 8/10/2017 Open: 5,781 High: 5,834 Low: 5,749 Close: 5,826 Chg. 0.8%
Prev. Avg. Price: 5,803.0 Volatility (+) : 0.0107 Volatility (-) : -0.0076 V-Ratio : 1.41
5,996.69 5,895.89 5,825.95 5,795.08 5,726.41
Aug Sep Oct Nov Dec 2017 Feb Mar Apr May Jun 22 Jul Aug
Optimization Trading System - ©2010
^JKSE - Volume = 21,395,728,384.00, Avg.Volume = 23,319,584,768.00
21,395,728,384 23,319,584,768
Created w ith AmiBroker - advanced charting and technical analysis sof tw are. http://w w w .amibroker.com _____ 5,846.6
_____ 5,801.8 5,823.5
^JKSE [ ^JKSE ] - Daily - 8/10/2017 Open: 5,829 High: 5,834 Prev. Avg. Price: 5,823.5
Volatility (+) : 0.0040 Volatility (-) : -0.0037 V-Ratio : 1.06
5,825.95
24 31Aug 7
^JKSE - Volume = 5,967,649,280.00
5,967,649,280
Created w ith AmiBroker - advanced charting and technical analysis sof tw are. http://w w w .amibroker.com _____ 5,865.3
_____ 5,758.8 5,803.0
^JKSE [ ^JKSE ] - Weekly - 8/10/2017 Open: 5,781 High: 5,834 Prev. Avg. Price: 5,803.0
Volatility (+) : 0.0107 Volatility (-) : -0.0076 V-Ratio : 1.41
5,825.95
13 May Jun22Jul Aug
^JKSE - Volume = 21,395,728,384.00
21,395,728,384
Created w ith AmiBroker - advanced charting and technical analysis sof tw are. http://w w w .amibroker.com _____ 6,046.9
_____ 5,574.1 5,811.4 5,929.2
5,692.8
^JKSE [ ^JKSE ] - Monthly - 8/10/2017 Open: 5,854 High:
Prev. Avg. Price: 5,811.4 Volatility (+) : 0.0405 Volatility (-) : -0.0408 V-Ratio : 0.99
5,825.95
2016 2017
^JKSE - Volume = 42,819,543,040.00
42,819,543,040
Stocks on our focus list
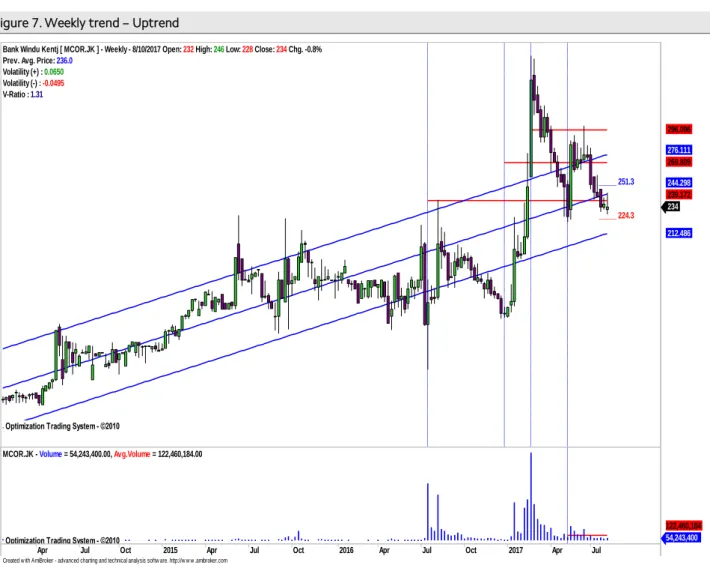
Bank China Construction Bank Indonesia (MCOR)-Weekly,Buy on weakness Harga akan coba naik mendekati center line pada uptrend channel.
Secara umum harga saham ini masih bergerak pada uptrend channel yang masih relatif valid (r-squared = 0.756) selama192 minggu terakhir yang bergerak normal dalam rentang +/- 1.17 std.deviasi dari center line. Peluang harga keluar dari pergerakan normal sekitar 24.38 % (sekitar 46 bar chart ). Rata-rata volatilitas normal pergerakan harga saat ini sebesar antara +6.7% / - 5.28 % atau +15.81rupiah / -12.46 rupiah (rata-rata pergerakan normal positif / negatif, selama periode analisis) sebagaimana terlihat pada Figure 7.
Summary
Item Data Item Data
Close (Aug 10, 2017) 234(-0.8%) Trading range 224 - 250 Relative Avg. Price performance to JCI (%) (13.27) Target
β (beta) 0.22 - Daily 238
Corelation 0.35 - Weekly 250
Period 192 - Monthly 274
r-squared 0.756 Stop loss 224
Volatility (+/-, %) +6.7 / -5.28
Volatility (+/-, Rp.) +15.81 / -12.46
Source: Mirae Asset Sekuritas Indonesia Research
Figure 7. Weekly trend – Uptrend
Source: Mirae Asset Sekuritas Indonesia Research
Created w ith AmiBroker - advanced charting and technical analysis softw are. http://w w w .amibroker.com
_____ 251.3
_____ 224.3
Optimization Trading System - ©2010 Optimization Trading System - ©2010 Optimization Trading System - ©2010 Optimization Trading System - ©2010
Bank Windu Kentj [ MCOR.JK ] - Weekly - 8/10/2017 Open: 232 High: 246 Low: 228 Close: 234 Chg. -0.8%
Prev. Avg. Price: 236.0 Volatility (+) : 0.0650 Volatility (-) : -0.0495 V-Ratio : 1.31
234 212.486 239.172 244.298 269.809 276.111 296.096
Apr Jul Oct 2015 Apr Jul Oct 2016 Apr Jul Oct 2017 Apr Jul
Optimization Trading System - ©2010
MCOR.JK - Volume = 54,243,400.00, Avg.Volume = 122,460,184.00
54,243,400 122,460,184
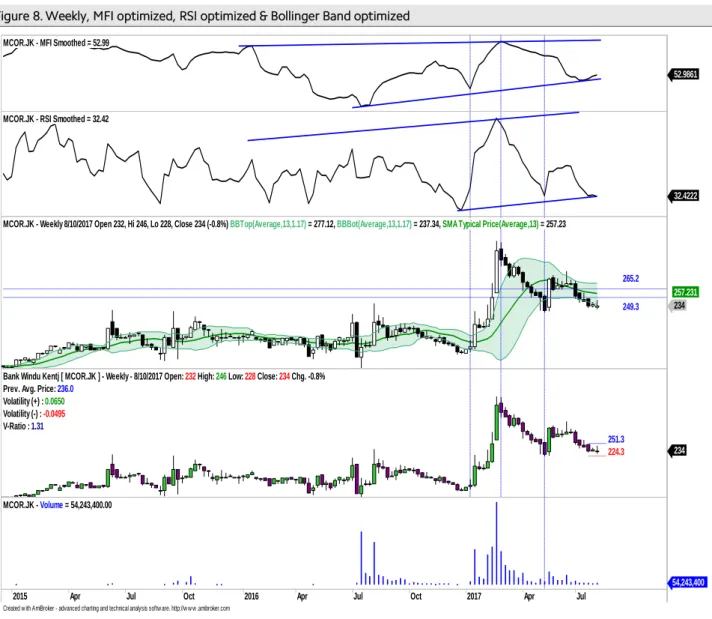
Aliran dana keluar mulai terbatas dan volatilitas harga naik mulai terlihat.
Pada Figure 8, terlihat dari hasil optimalisasi terakhir, indikator MFI optimized akan menguji support trend line dan RSI optimized cenderung naik. Daily resistance terdekat di 238 sebelum ke weekly resistance di 250. Dailysupport di 228 dan weeklysupport di 224.Cut loss level di 224.
Figure 8. Weekly, MFI optimized, RSI optimized & Bollinger Band optimized
Source: Mirae Asset Sekuritas Indonesia Research
Created w ith AmiBroker - advanced charting and technical analysis softw are. http://w w w .amibroker.com MCOR.JK - MFI Smoothed = 52.99
52.9861
MCOR.JK - RSI Smoothed = 32.42
32.4222
265.2 249.3 MCOR.JK - Weekly 8/10/2017 Open 232, Hi 246, Lo 228, Close 234 (-0.8%) BBTop(Average,13,1.17) = 277.12, BBBot(Average,13,1.17) = 237.34, SMA Typical Price(Average,13) = 257.23
234 257.231
_____ 251.3 _____ 224.3 Bank Windu Kentj [ MCOR.JK ] - Weekly - 8/10/2017 Open: 232 High: 246 Low: 228 Close: 234 Chg. -0.8%
Prev. Avg. Price: 236.0 Volatility (+) : 0.0650 Volatility (-) : -0.0495 V-Ratio : 1.31
234
2015 Apr Jul Oct 2016 Apr Jul Oct 2017 Apr Jul
MCOR.JK - Volume = 54,243,400.00
54,243,400
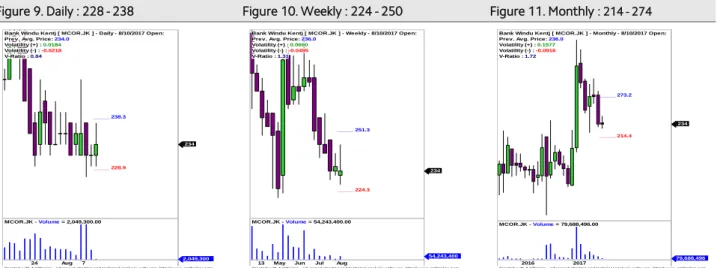
Harga akan coba naik dan bertahan diatas rata-rata pada masing-masing periode.
Untuk mampu naik lebih lanjut, harga saham saat ini harus mampu minimal bertahan diatas rata-rata masing-masing periode (positive area) .Pada pergerakkan daily harga telah terkoreksi -2.1 % sementara itu koreksi normal rata-rata di level -1.41%.
Sementara itu pada pergerakkan weekly harga sudah naik +1.8%. Normal kenaikkan sekitar +3.93% Dengan demikian potensi koreksi masih terlihat. Pada Figure 9,10 dan 11 terlihat perkiraan normal trading range untuk masing-masing periode.
Figure 9. Daily : 228 - 238 Figure 10. Weekly : 224 - 250 Figure 11. Monthly : 214 - 274
Source: Mirae Asset Sekuritas Indonesia Research Source: Mirae Asset Sekuritas Indonesia Research Source: Mirae Asset Sekuritas Indonesia Research
Created w ith AmiBroker - advanced charting and technical analysis sof tw are. http://w w w .amibroker.com _____ 238.3
_____ 228.9 Bank Windu Kentj [ MCOR.JK ] - Daily - 8/10/2017 Open:
Prev. Avg. Price: 234.0 Volatility (+) : 0.0184 Volatility (-) : -0.0218 V-Ratio : 0.84
234
24 31Aug 7
MCOR.JK - Volume = 2,049,300.00
2,049,300
Created w ith AmiBroker - advanced charting and technical analysis sof tw are. http://w w w .amibroker.com _____ 251.3
_____ 224.3 Bank Windu Kentj [ MCOR.JK ] - Weekly - 8/10/2017 Open:
Prev. Avg. Price: 236.0 Volatility (+) : 0.0650 Volatility (-) : -0.0495 V-Ratio : 1.31
234
13 May Jun22Jul Aug
MCOR.JK - Volume = 54,243,400.00
54,243,400
Created w ith AmiBroker - advanced charting and technical analysis sof tw are. http://w w w .amibroker.com _____ 273.2
_____ 214.4 Bank Windu Kentj [ MCOR.JK ] - Monthly - 8/10/2017 Open:
Prev. Avg. Price: 236.0 Volatility (+) : 0.1577 Volatility (-) : -0.0916 V-Ratio : 1.72
234
2016 2017
MCOR.JK - Volume = 79,688,496.00
79,688,496
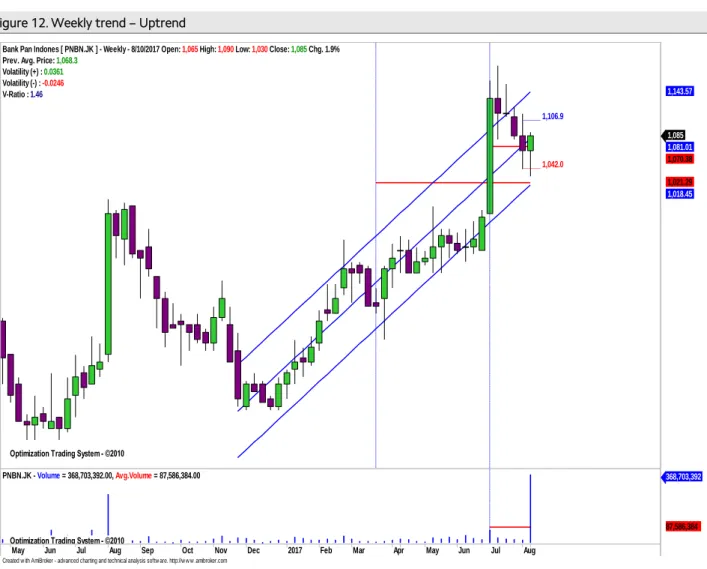
Bank Pan Indonesia (PNBN)-Weekly, Buy on weakness Harga akan coba naik dan tembus center line pada uptrend channel.
Secara umum harga saham ini juga masih bergerak dalam pola uptrend channel yang masih relatif valid (r-squared = 0.893) selama 37 minggu terakhir dan bergerak normal dalam rentang +/- 1.61 std.deviasi dari center line. Peluang harga keluar dari pergerakan normal sekitar 10.74 % (sekitar 4 bar chart ). Rata-rata volatilitas normal pergerakan harga saat ini sebesar antara +3.61 % / - 2.46 % atau +38.57 rupiah / - 26.28 rupiah (rata-rata pergerakan normal positif / negatif, selama periode analisis) sebagaimana sebagaimana terlihat pada Figure 12.
Summary
Item Data Item Data
Close (Aug 10, 2017) 1,085 (+1.9%) Trading range 1,060–1,120 Relative Avg. Price performance to JCI (%) 10.92 Target
β (beta) 0.03 - Daily 1,100
Corelation 0.85 - Weekly 1,110
Period 37 - Monthly 1,200
r-squared 0.893 Stop loss 1,020
Volatility (+/-, %) +3.61/ -2.46
Volatility (+/-, Rp.) +38.57 / -26.28
Source: Mirae Asset Sekuritas Indonesia Research
Figure 12. Weekly trend – Uptrend
Source: Mirae Asset Sekuritas Indonesia Research
Created w ith AmiBroker - advanced charting and technical analysis softw are. http://w w w .amibroker.com
_____ 1,106.9
_____ 1,042.0
Optimization Trading System - ©2010 Optimization Trading System - ©2010 Optimization Trading System - ©2010
Bank Pan Indones [ PNBN.JK ] - Weekly - 8/10/2017 Open: 1,065 High: 1,090 Low: 1,030 Close: 1,085 Chg. 1.9%
Prev. Avg. Price: 1,068.3 Volatility (+) : 0.0361 Volatility (-) : -0.0246 V-Ratio : 1.46
1,085 1,081.01 1,070.38
1,021.29 1,018.45 1,143.57
May Jun Jul Aug Sep Oct Nov Dec 2017 Feb Mar Apr May Jun 22Jul Aug
Optimization Trading System - ©2010
PNBN.JK - Volume = 368,703,392.00, Avg.Volume = 87,586,384.00 368,703,392
87,586,384
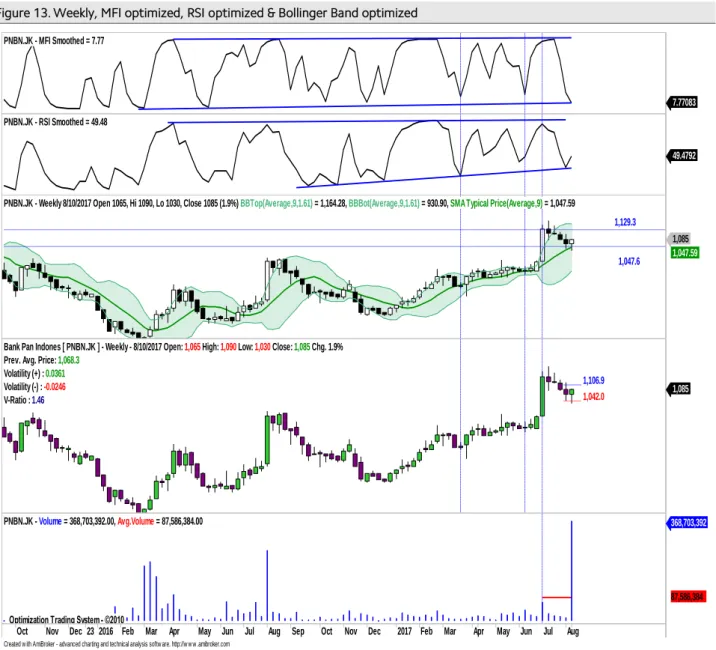
Aliran dana keluar mulai tertahan dan volatilitas harga naik mulai terlihat.
Pada Figure 13, terlihat dari hasil optimalisasi indikator MFI optimized akan menguji support trend line dan W%R optimized masih cenderung naik.Weekly resistance di 1,110 dengan catatan daily resistance dapat ditembus di 1,100. Sementara itu weekly support di 1,040 dengan catatan daily support di 1,070 juga dapat ditembus.Cut loss level di 1,020.
Figure 13. Weekly, MFI optimized, RSI optimized & Bollinger Band optimized
Source: Mirae Asset Sekuritas Indonesia Research
Created w ith AmiBroker - advanced charting and technical analysis softw are. http://w w w .amibroker.com
PNBN.JK - MFI Smoothed = 7.77
7.77083 PNBN.JK - RSI Smoothed = 49.48
49.4792
1,047.6 1,129.3 PNBN.JK - Weekly 8/10/2017 Open 1065, Hi 1090, Lo 1030, Close 1085 (1.9%) BBTop(Average,9,1.61) = 1,164.28, BBBot(Average,9,1.61) = 930.90, SMA Typical Price(Average,9) = 1,047.59
1,085 1,047.59
_____ 1,106.9 _____ 1,042.0 Bank Pan Indones [ PNBN.JK ] - Weekly - 8/10/2017 Open: 1,065 High: 1,090 Low: 1,030 Close: 1,085 Chg. 1.9%
Prev. Avg. Price: 1,068.3 Volatility (+) : 0.0361 Volatility (-) : -0.0246 V-Ratio : 1.46
1,085
Oct Nov Dec 23 2016 Feb Mar 24Apr May Jun Jul Aug Sep Oct Nov Dec 2017 Feb Mar Apr May Jun 22Jul Aug
Optimization Trading System - ©2010
PNBN.JK - Volume = 368,703,392.00, Avg.Volume = 87,586,384.00 368,703,392
87,586,384
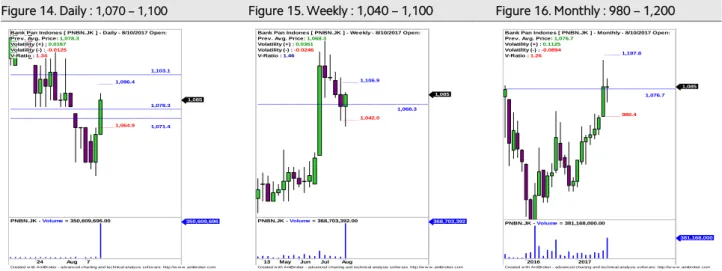
Harga saat ini akan coba naik dan bertahan diatas rata-ratapada masing-masing periode.
Untuk mampu naik lebih lanjut, harga saham saat ini harus mampu minimal bertahan diatas rata-rata masing-masing periode (positive area) . Jika dilihat lebih lanjut kenaikkan normal pada pergerakkan daily sekitar +1.67%, saat ini di level +2.4%. Sementara itu pada pergerakkan weekly kenaikkan normal sekitar +3.61 %, saat ini sekitar +1.9 %.
Dengan demikian potensi kenaikkan masih terlihat. Pada Figure 14,15 dan 16 terlihat perkiraan normal trading range untuk masing-masing periode.
Figure 14. Daily : 1,070 – 1,100 Figure 15. Weekly : 1,040 – 1,100 Figure 16. Monthly : 980 – 1,200 x
Source: Mirae Asset Sekuritas Indonesia Research Source: Mirae Asset Sekuritas Indonesia Research Source: Mirae Asset Sekuritas Indonesia Research
Created w ith AmiBroker - advanced charting and technical analysis sof tw are. http://w w w .amibroker.com _____ 1,096.4
_____ 1,064.9 1,078.3 1,103.1
1,071.4 Bank Pan Indones [ PNBN.JK ] - Daily - 8/10/2017 Open:
Prev. Avg. Price: 1,078.3 Volatility (+) : 0.0167 Volatility (-) : -0.0125 V-Ratio : 1.34
1,085
24 31Aug 7
PNBN.JK - Volume = 350,609,696.00 350,609,696
Created w ith AmiBroker - advanced charting and technical analysis sof tw are. http://w w w .amibroker.com _____ 1,106.9
_____ 1,042.0 1,068.3 Bank Pan Indones [ PNBN.JK ] - Weekly - 8/10/2017 Open:
Prev. Avg. Price: 1,068.3 Volatility (+) : 0.0361 Volatility (-) : -0.0246 V-Ratio : 1.46
1,085
13 May Jun22Jul Aug
PNBN.JK - Volume = 368,703,392.00 368,703,392
Created w ith AmiBroker - advanced charting and technical analysis sof tw are. http://w w w .amibroker.com _____ 1,197.8
_____ 980.4 1,076.7 Bank Pan Indones [ PNBN.JK ] - Monthly - 8/10/2017 Open:
Prev. Avg. Price: 1,076.7 Volatility (+) : 0.1125 Volatility (-) : -0.0894 V-Ratio : 1.26
1,085
2016 2017
PNBN.JK - Volume = 381,168,000.00
381,168,000
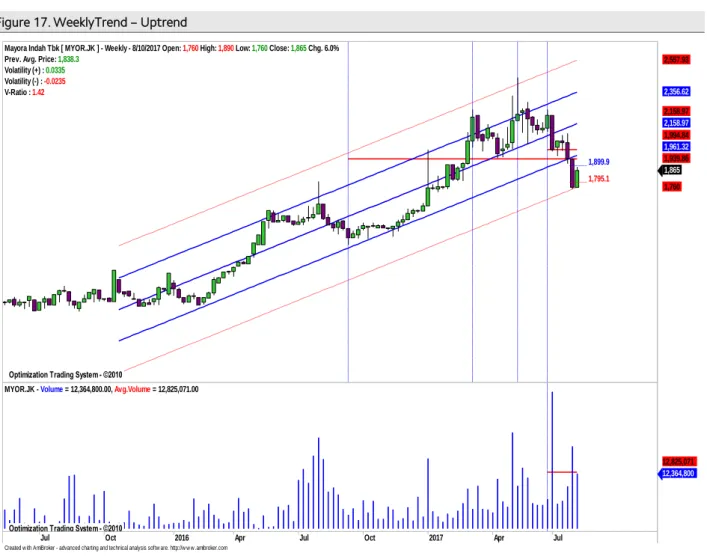
Mayora Indah (MYOR) - Weekly, Buy on weakness
Harga akan coba naik dan tembus normal lower band pada uptrend channel.
Secara umum harga saham ini akan coba naik mendekati normal lower band pada uptrend channel yang masih relatif valid dengan r-squared = 0.880 selama 93 minggu terakhir dan bergerak normal dalam rentang +/-1.56 std.deviasi dari centerline. Peluang harga keluar dari pergerakan normalnya sekitar 11.96 % (sekitar 11 bar chart ). Rata- rata volatilitas normal pergerakan harga saat ini sebesar antara +3.35 % / - 2.35 % atau + 61.58 rupiah / -43.20 rupiah (rata-rata pergerakan normal positif / negatif, selama periode analisis)sebagaimana terlihat pada Figure 17.
Summary
Item Data Item Data
Close (Aug 10, 2017)
1,865(+6.0%) Normal trading range 1,820 – 1,930
Relative Avg. Price performance to JCI (%) (8.20) Target
β (beta) 0.45 - Daily 1,890
Corelation 0.57 - Weekly 1,910
Period 93 - Monthly 1,980
r-squared 0.880 Stop loss 1,760
Volatility (+/-, %) +3.35 / -2.35
Volatility (+/-, Rp.) +61.58 / - 43.20
Source: Mirae Asset Sekuritas Indonesia Research
Figure 17. WeeklyTrend – Uptrend
Source: Mirae Asset Sekuritas Indonesia Research
Aliran dana masuk dan volatilitas harga naik masih terlihat.
Created w ith AmiBroker - advanced charting and technical analysis softw are. http://w w w .amibroker.com
_____ 1,899.9 _____ 1,795.1
Optimization Trading System - ©2010 Optimization Trading System - ©2010 Optimization Trading System - ©2010 Optimization Trading System - ©2010
Mayora Indah Tbk [ MYOR.JK ] - Weekly - 8/10/2017 Open: 1,760 High: 1,890 Low: 1,760 Close: 1,865 Chg. 6.0%
Prev. Avg. Price: 1,838.3 Volatility (+) : 0.0335 Volatility (-) : -0.0235 V-Ratio : 1.42
1,865 1,760 1,939.86 1,961.32 1,994.84 2,158.97 2,158.97 2,356.62 2,557.93
Jul Oct 2016 Apr Jul Oct 2017 Apr Jul
Optimization Trading System - ©2010
MYOR.JK - Volume = 12,364,800.00, Avg.Volume = 12,825,071.00
12,364,800 12,825,071
Pada Figure 18, terlihat dari hasil optimalisasi, indikator MFI Optimized dan indikator RSI Optimized cenderung naik. Dengan demikian diperkirakan potensi kenaikkan masih terlihat. Perkiraan daily resistance di 1,890 sebelum ke weekly resistance di 1,910 Daily support di 1,830 dan weekly support di 1,790.Cut loss level di 1,760.
Figure 18. Weekly MFI optimized , W%R optimized, RSI optimized & Bollinger Band optimized
Source: Mirae Asset Sekuritas Indonesia Research
Created w ith AmiBroker - advanced charting and technical analysis softw are. http://w w w .amibroker.com MYOR.JK - MFI Smoothed = 32.39
32.389
MYOR.JK - RSI Smoothed = 30.83
30.8256
2,079.1 MYOR.JK - Weekly 8/10/2017 Open 1760, Hi 1890, Lo 1760, Close 1865 (6.0%) BBTop(Average,13,1.56) = 2,286.38, BBBot(Average,13,1.56) = 1,871.82, SMA Typical Price(Average,13) = 2,079.10
1,865 2,079.1
_____ 1,899.9 _____ 1,795.1
Optimization Trading System - ©2010
Mayora Indah Tbk [ MYOR.JK ] - Weekly - 8/10/2017 Open: 1,760 High: 1,890 Low: 1,760 Close: 1,865 Chg. 6.0%
Prev. Avg. Price: 1,838.3 Volatility (+) : 0.0335 Volatility (-) : -0.0235 V-Ratio : 1.42
1,865 1,939.86
Jul Oct 2016 Apr Jul Oct 2017 Apr Jul
Optimization Trading System - ©2010
MYOR.JK - Volume = 12,364,800.00, Avg.Volume = 12,825,071.00
12,364,800 12,825,071
Relative Avg.Price Performance to JCI (%) : Persentase kenaikan harga saham dari rata-rata sejak IHSG memulai uptrend-nya β (beta) : Indikator sensitivitas harga saham terhadap IHSG, beta diatas 1 berarti harga makin sensitif terhadap pergerakan IHSG dan sebaliknya
Correlation : Ukuran kuat hubungan (korelasi) pergerakan harga saham dibanding dengan pergerakan IHSG selama periode analisis.
Period : Periode uptrend / downtrend yang valid dari pergerakan harga saham.
r-squared : Koefisien determinasi, menunjukkan persentase gerakan yang dapat dijelaskan dengan regresi linier.Nilai R2 terletak antara 0 – 1, dan kecocokan model dikatakan lebih baik kalau R2 semakin mendekati 1 (validitas uptrend atau downtrend makin valid) Volatility (+/-%) : Besaran volatilitas normal maksimal/minimal dari pergerakan harga harian selama harga saham bergerak normal pada trend channel dalam persentase.
Volatility (+/- point or Rp) : Besaran volatilitas normal maksimal/minimal dari pergerakan harga harian selama harga saham bergerak dalam periode analisis.
Harga akan coba naik dan bertahan diatas rata-ratapada masing-masing periode.
Untuk mampu naik lebih lanjut, harga saham saat ini harus mampu minimal bertahan diatas rata-rata masing-masing periode (positive area) . Jika dilihat lebih lanjut kenaikkan normal pada pergerakkan daily sekitar +1.17%, saat ini di level +0.3 %.Sementara itu pada pergerakkan weekly kenaikkan normal sekitar +4.11saat ini di level +6.0%.Dengan demikan potensi koreksi harga masih terlihat namun untuk sementara cenderung konsolidasi terlebih dahulu . Pada Figure 19,20 dan 21 terlihat perkiraan normal trading range untuk masing-masing periode.
Figure 19. Daily : 1,830 – 1,890 Figure 20. Weekly : 1,790 – 1,910 Figure 21. Monthly : 1,740 – 1,980
Source: Mirae Asset Sekuritas Indonesia Research Source: Mirae Asset Sekuritas Indonesia Research Source: Mirae Asset Sekuritas Indonesia Research
Buy: : Beli, harga sudah menyentuh atau jatuh di bawah support dan indikator teknikal berada di oversold area.
Sell: : Jual, harga sudah menyentuh atau tembus resistance normal dan indikator berada di overbought area.
BoW: : Buy on Weakness, beli ketika harga sudah melemah, dimana volume tekanan jual mulai berkurang dan harga mendekati support, serta indikator teknikal sudah berada di oversold area.
SoS: : Sell on Strength, jual ketika kenaikan harga sudah mulai terbatas dimana volume beli mulai berkurang dan harga mendekati resistance, serta indikator teknikal sudah berada di overbought area.
Trading Buy: : Beli dan jual kembali secepatnya jika harga sudah mencapai level resistance terdekat, karena kenaikan harga relatif tidak stabil atau hanya sementara.
Trading Sell : Jual dan beli kembali secepatnya jika harga sudah mencapai level support terdekat karena koreksi harga relatif tidak stabil atau hanya sementara.
Created w ith AmiBroker - advanced charting and technical analysis sof tw are. http://w w w .amibroker.com _____ 1,885.1
_____ 1,833.7 1,863.3 Mayora Indah Tbk [ MYOR.JK ] - Daily - 8/10/2017 Open:
Prev. Avg. Price: 1,863.3 Volatility (+) : 0.0117 Volatility (-) : -0.0159 V-Ratio : 0.74
1,865
24 31Aug 7
MYOR.JK - Volume = 447,600.00
447,600
Created w ith AmiBroker - advanced charting and technical analysis sof tw are. http://w w w .amibroker.com _____ 1,913.9
_____ 1,786.6 1,838.3 Mayora Indah Tbk [ MYOR.JK ] - Weekly - 8/10/2017 Open:
Prev. Avg. Price: 1,838.3 Volatility (+) : 0.0411 Volatility (-) : -0.0281 V-Ratio : 1.46
1,865
13 May Jun22Jul Aug
MYOR.JK - Volume = 12,364,800.00
12,364,800
Created w ith AmiBroker - advanced charting and technical analysis sof tw are. http://w w w .amibroker.com _____ 1,984.7
_____ 1,742.4
1,835.0 1,835
Mayora Indah Tbk [ MYOR.JK ] - Monthly - 8/10/2017 Open:
Prev. Avg. Price: 1,835.0 Volatility (+) : 0.0816 Volatility (-) : -0.0505 V-Ratio : 1.62
1,865
2016 2017
MYOR.JK - Volume = 23,388,500.00
23,388,500
Chart 22. JCI Vs. USD/IDR Chart 23. JCI performance (absolute vs. relative)
Source: Bloomberg, Mirae Asset Sekuritas Indonesia Note: Relative to MSCI EM Index
Source: Bloomberg, Mirae Asset Sekuritas Indonesia
Chart 24. Foreigner’s net purchase (EM) Chart 25. Energy price
Note: The latest figure for India are August 9th, 2017
Source: Bloomberg, Mirae Asset Sekuritas Indonesia Source: Bloomberg, Mirae Asset Sekuritas Indonesia
Chart 26. Non-ferrous metal price Chart 27. Precious metal price
Source: Bloomberg, Mirae Asset Sekuritas Indonesia Source: Bloomberg, Mirae Asset Sekuritas Indonesia 13,200
13,300 13,400 13,500 13,600 13,700 13,800
5,400 5,500 5,600 5,700 5,800 5,900 6,000
5/11 6/8 7/6 8/3
(IDR)
(pt) JCI (L) USD/IDR (R)
0.0 0.8 0.9
7.5
1.2 1.8
-2.8
-8.9 -12
-8 -4 0 4 8 12
1D 1W 1M 1Y
Absolute Relative (%, %p)
(%, %p) (%, %p)
0
62
-5
20 3
-67
-289
-320 -53
-30 19
77
-350 -300 -250 -200 -150 -100 -50 0 50 100
Korea Taiwan Indonesia Thailand Philippines India
1 Day 5 Days
(USDmn) (USDmn) (USDmn) (USDmn)
75 85 95 105 115 125 135
5/11 6/8 7/6 8/3
CPO WTI Coal
(D-3M=100) (D-3M=100)
90 95 100 105 110 115 120
5/11 6/8 7/6 8/3
(D-3M=100) Copper Nickel Tin
90 97 104 111
5/11 6/8 7/6 8/3
Silver Gold Platinum
(D-3M=100)
Table. Key valuation metrics
Company Name Ticker
Price Market Cap Price Performance (%) P/E(X)* P/B(X)* ROE(%)*
(IDR) (IDRbn) 1D 1W 1M 1Y FY16 FY17 FY16 FY17 FY16 FY17
Jakarta Composite Index JCI 5,826 6,405,489 0.0 0.8 0.9 7.4 16.7 14.6 2.6 0.0 18.9 9.3
FINANCIALS
Bank Central Asia BBCA 18,825 464,131 -0.8 0.4 2.9 25.9 18.5 20.2 3.4 3.6 20.4 18.9
Bank Mandiri Persero BMRI 13,325 310,917 -0.6 1.5 1.7 15.4 19.6 15.7 1.8 1.9 10.3 12.4
Bank Rakyat Indonesia Persero BBRI 15,000 370,037 -0.2 1.0 1.9 25.0 10.9 13.2 1.9 2.3 20.2 18.1
Bank Negara Indonesia Persero BBNI 7,275 135,669 0.0 1.4 6.2 27.6 9.1 10.3 1.2 1.4 13.9 14.4
Bank Tabungan Negara Persero BBTN 2,740 29,017 -0.4 5.0 14.6 40.9 13.3 13.4 1.0 1.4 7.6 10.5
CONSUMER
HM Sampoerna HMSP 3,420 397,808 0.0 -2.6 -9.8 -9.8 34.8 29.9 13.0 11.1 38.6 38.0
Gudang Garam GGRM 66,900 128,721 0.9 -5.9 -12.5 1.0 18.4 17.6 3.1 3.0 17.3 17.5
Indofood CBP Sukses Makmur ICBP 8,300 96,794 -0.6 0.0 -2.4 -5.1 27.8 24.9 5.7 4.9 21.8 21.0
Indofood Sukses Makmur INDF 8,450 74,195 0.6 2.4 -1.7 4.3 18.3 16.7 2.4 2.3 14.7 14.6
Kalbe Farma KLBF 1,740 81,563 0.0 0.3 9.8 3.0 30.9 32.4 6.0 6.1 20.6 19.7
Unilever Indonesia UNVR 48,025 366,431 -0.2 0.7 2.8 5.4 46.3 50.2 62.9 66.9 134.1 142.2
AGRICULTURAL
Astra Agro Lestari AALI 15,150 29,159 -0.7 -0.2 0.3 -3.7 14.8 13.6 1.9 1.6 14.1 11.7
PP London Sumatera Indonesia LSIP 1,395 9,518 -1.1 -1.8 -3.1 -7.6 20.0 12.3 1.6 1.2 7.9 9.8
Sawit Sumbermas Sarana SSMS 1,390 13,240 -0.7 -2.1 -10.3 -13.4 22.5 20.9 3.9 3.4 18.3 16.2
INFRASTRUCTURE
XL Axiata EXCL 3,450 36,873 0.9 -3.4 10.2 -6.3 60.8 124.6 1.2 1.7 2.1 1.2
Jasa Marga JSMR 5,575 40,463 -0.4 0.5 7.2 -0.2 15.6 19.7 2.3 2.6 15.7 13.5
Perusahaan Gas Negara PGAS 2,210 53,574 2.3 1.8 -6.0 -30.5 15.3 11.0 1.5 1.3 9.8 11.7
Tower Bersama Infrastructure TBIG 6,900 31,267 -2.8 3.8 -6.8 16.5 17.4 25.0 14.3 13.4 83.6 62.5
Telekomunikasi Indonesia TLKM 4,710 474,768 0.0 0.2 3.1 9.5 20.3 20.2 4.7 5.0 24.3 25.8
Soechi Lines SOCI 288 2,033 0.7 -0.7 0.7 -33.0 8.2 4.3 0.6 N/A 7.4 10.1
Garuda Indonesia GIAA 344 8,905 0.0 0.6 0.0 -27.7 31.7 19.2 2.6 2.5 8.6 12.3
BASIC-INDUSTRIES
Semen Indonesia SMGR 10,900 64,654 0.0 4.1 9.0 -4.4 12.0 18.8 1.9 2.1 16.3 11.0
Charoen Pokphand Indonesia CPIN 2,810 46,078 -1.4 1.4 -13.0 -27.0 22.6 16.7 3.6 2.9 16.5 18.5
Indocement Tunggal Prakarsa INTP 18,875 69,483 -1.7 1.8 7.2 -2.6 14.6 23.3 2.2 2.6 15.5 10.6
Japfa Comfeed Indonesia JPFA 1,140 13,008 2.7 -3.8 -20.0 -21.4 7.7 8.1 1.9 1.4 28.6 17.0
MINING
Indo Tambangraya Megah ITMG 20,150 22,768 -0.4 -1.2 10.6 62.5 10.4 7.9 1.5 1.7 15.0 21.4
Adaro Energy ADRO 1,850 59,174 2.5 0.3 16.0 60.2 12.0 10.7 1.3 1.3 11.1 12.0
Aneka Tambang ANTM 700 16,822 0.7 2.9 -0.7 -11.9 298.3 61.7 1.2 1.0 0.4 0.8
Vale Indonesia INCO 2,610 25,934 -1.1 7.4 39.9 1.6 N/A 195.5 1.1 1.0 0.1 0.6
Tambang Batubara Bukit Asam PTBA 13,475 31,048 2.9 1.1 11.6 32.8 13.1 9.1 2.5 2.3 20.5 27.8
TRADE
United Tractors UNTR 30,425 113,489 2.0 4.2 10.1 70.0 15.8 16.4 1.9 2.5 12.7 15.9
AKR Corporindo AKRA 6,600 26,401 0.4 0.4 4.8 -6.0 23.5 22.8 3.5 3.4 15.7 15.6
Global Mediacom BMTR 505 7,170 -1.9 -1.0 -14.4 -52.6 41.8 N/A 0.9 N/A 2.0 N/A
Matahari Department Store LPPF 10,850 31,659 -4.0 -0.9 -12.1 -48.6 21.9 15.0 23.8 11.5 136.4 86.5
Media Nusantara Citra MNCN 1,515 21,628 -3.5 -3.5 -12.2 -30.2 17.7 13.2 2.7 2.1 15.4 16.2
Matahari Putra Prima MPPA 565 3,039 1.8 -4.2 -9.6 -69.1 211.4 44.9 3.3 1.3 1.6 1.2
Surya Citra Media SCMA 2,450 35,823 2.5 2.5 4.3 -22.5 27.2 20.9 11.9 9.0 45.7 45.3
Siloam International Hospital SILO 9,850 12,811 5.9 5.3 -9.2 0.3 150.3 97.7 4.5 3.9 3.5 4.2
PROPERTY
Bumi Serpong Damai BSDE 1,850 35,606 1.6 2.5 2.5 -18.5 18.8 13.7 1.6 1.5 9.1 11.4
Adhi Karya ADHI 2,090 7,442 -1.4 -1.4 -3.7 -25.1 23.6 12.4 1.4 1.2 5.9 9.7
Alam Sutera Realty ASRI 356 6,995 -1.1 1.7 12.7 -35.3 13.6 8.2 1.0 0.9 7.5 11.3
Ciputra Development CTRA 1,160 21,530 -2.5 8.4 -2.1 -28.2 19.9 18.2 2.2 1.6 9.8 10.0
Lippo Karawaci LPKR 780 18,001 1.3 9.1 9.9 -33.3 18.6 16.4 0.9 0.9 5.0 5.6
Pembangunan Perumahan PTPP 3,000 18,600 0.7 -2.0 -6.3 -30.9 23.1 13.6 2.4 1.7 14.4 12.7
Pakuwon Jati PWON 680 32,749 -1.4 -1.4 8.8 3.8 16.3 17.2 3.1 3.1 21.0 18.8
Summarecon Agung SMRA 1,095 15,797 -2.2 10.1 -9.5 -39.2 61.3 46.4 3.1 2.3 5.1 5.7
Wijaya Karya WIKA 2,060 18,478 -0.5 2.5 -6.4 -31.8 14.4 14.7 1.8 1.5 12.9 10.1
Waskita Karya WSKT 2,310 31,356 -0.9 0.9 2.7 -18.1 17.3 12.6 3.1 2.1 16.6 18.0
MISCELLANEOUS
Astra International ASII 7,925 320,832 -0.9 1.9 -9.7 -2.5 22.1 16.3 3.0 2.6 14.2 16.1
Source: Bloomberg, Mirae Asset Sekuritas Indonesia
*Note: Valuation metrics based on Bloomberg consensus estimates
Sector performance Top 10 market cap performance
Name Index Chg (%) Ticker Price Market Cap (IDRbn) Chg (%)
Agricultural 1,735.4 0.0 BSSR IJ 2200 5,756 15.79
Mining 1,495.1 0.7 IBST IJ 4300 5,809 10.26
Basic-Industry 618.4 -0.4 HERO IJ 1200 5,020 8.11
Miscellaneous Industry 1,357.1 -1.2 MEDC IJ 2820 9,398 6.82
Consumer Goods 2,391.6 0.1 BTEK IJ 1170 6,770 6.4
Property & Construction 507.6 -0.1 INAF IJ 2640 8,182 6.02
Infrastructure 1,232.5 0.5 SILO IJ 9850 12,811 5.91
Finance 981.8 -0.1 KAEF IJ 3280 18,217 5.81
Trade 923.2 0.6 BJBR IJ 2840 27,537 4.4
Composite 5,825.9 0.0 TOWR IJ 4450 45,403 3.73
Source: Bloomberg
Top 5 leading movers Top 5 lagging movers
Name Chg (%) Close Name Chg (%) Close
UNTR IJ 2.0 30,425 BBCA IJ -0.8 18,825
BNGA IJ 5.7 1,385 ASII IJ -0.9 7,925
TOWR IJ 3.7 4,450 BMRI IJ -0.6 13,325
ADRO IJ 2.5 1,850 BRAM IJ -19.9 14,500
MABA IJ 11.7 2,000 RMBA IJ -8.9 410
Source: Bloomberg
Economic Calendar
Time Currency Detail Forecast Previous
12:01am USD 30-y Bond Auction 2.94|2.3
1:00am USD Federal Budget Balance -60.9B -90.2B
5:30am NZD Business NZ Manufacturing Index 56.2
5:45am NZD FPI m/m 0.2%
6:30am AUD RBA Gov Lowe Speaks
All Day JPY Bank Holiday
1:00pm EUR German Final CPI m/m 0.4% 0.4%
1:00pm EUR German WPI m/m 0.3% 0.0%
1:45pm EUR French Final CPI m/m -0.3% -0.3%
1:45pm EUR French Prelim Non-Farm Payrolls q/q 0.4% 0.4%
11th-16th CNY M2 Money Supply y/y 9.5% 9.4%
11th-16th CNY New Loans 810B 1540B
7:30pm USD CPI m/m 0.2% 0.0%
7:30pm USD Core CPI m/m 0.2% 0.1%
8:40pm USD FOMC Member Kaplan Speaks
10:30pm USD FOMC Member Kashkari Speaks
Note: Time is based on Indonesian local time Source: Forex Factory
Disclaimers
This report is prepared strictly for private circulation only to clients of PT Mirae Asset Sekuritas Indonesia (MASI). It is purposed only to person having professional experience in matters relating to investments. The information contained in this report has been taken from sources which we deem reliable. No warranty (express or implied) is made to the accuracy or completeness of the information. All opinions and estimates included in this report constitute our judgments as of this date, without regards to its fairness, and are subject to change without notice. However, none of MASI and/or its affiliated companies and/or their respective employees and/or agents makes any representation or warranty (express or implied) or accepts any responsibility or liability as to, or in relation to, the accuracy or completeness of the information and opinions contained in this report or as to any information contained in this report or any other such information or opinions remaining unchanged after the issue thereof. We expressly disclaim any responsibility or liability (express or implied) of MASI, its affiliated companies and their respective employees and agents whatsoever and howsoever arising (including, without limitation for any claims, proceedings, action, suits, losses, expenses, damages or costs) which may be brought against or suffered by any person as a results of acting in reliance upon the whole or any part of the contents of this report and neither MASI, its affiliated companies or their respective employees or agents accepts liability for any errors, omissions or misstatements, negligent or otherwise, in the report and any liability in respect of the report or any inaccuracy therein or omission there from which might otherwise arise is hereby expresses disclaimed.
This document is not an offer to sell or a solicitation to buy any securities. This firms and its affiliates and their officers and employees may have a position, make markets, act as principal or engage in transaction in securities or related investments of any company mentioned herein, may perform services for or solicit business from any company mentioned herein, and may have acted upon or used any of the recommendations herein before they have been provided to you. © PT Mirae Asset Sekuritas Indonesia 2016.