Nur Marini +62-21-515-1140 [email protected] To subscribe to our Daily Focus, please contact us at [email protected]
Mirae Asset Sekuritas Indonesia
Summary of import regulation
Source: Government, Mirae Asset Sekuritas Indonesia
November 13, 2017
[Trend Focus] Introducing Indonesia’s newest import regulations Pada 28 Januari 2017, Direktur Jenderal Bea dan Cukai telah menerbitkan Peraturan Direktur Jenderal Bea dan Cukai no. PER-2/BC/2017 (peraturan ini adalah turunan dari Peraturan Menteri Keuangan no. 182/PMK.04/2016), aturan baru ini berisikan tentang ketentuan impor barang kiriman. Dalam peraturan tersebut, menyebutkan bahwa pengangkut barang dan sarana pengangkut barang yang datang dari luar wilayah Indonesia, wajib menyerahkan pemberitahuan berupa inward manifest yang merupakan daftar muatan barang yang diangkut.
Pemeriksaan fisik barang yang dimaksud, adalah: 1) pemeriksaan fisik dengan menggunakan alat pemindai elektronik atau dilakukan oleh pejabat yang bertugas, 2) berdasarkan hasil pemeriksaan elektronik atau informasi lainnya, terdapat kecurigaan bahwa jumlah atau jenis barang tidak sesuai dengan uraian yang tercantum dalam dokumen Consignment Note (CN).
Bagian-bagian penting dari Peraturan No. PER-2 / BC / 2017 dirangkum di bawah ini.
1. Barang kiriman (impor) saat ini diberikan pembebasan bea masuk untuk barang dengan nilai kiriman sampai dengan Free on Board/FOB USD100 (sebelumnya pembebasan bea masuk berlaku untuk nilai barang sampai dengan FOB USD50), 2. Seluruh nilai barang kiriman akan dikenakan bea masuk dan pajak impor, jika melebihi FOB USD100,
3. Penerima barang diberi keleluasaan untuk memilih apabila nilai barang kiriman diantara FOB USD100 sampai dengan USD1,500; apakah akan menggunakan dokumen pengiriman barang (Consignment Note/CN) dengan dikenakan tarif 7.5% + PPN 10% + PPH 10% atau menggunakan dokumen Pemberitahuan Impor Barang Khusus (PIBK) untuk non-badan usaha, dan Pemberitahuan Impor Barang (PIB) untuk badan usaha dengan dikenakan tarif sesuai dengan jenis barang, 4. Untuk barang kiriman dengan nilai barang kiriman diatas FOB USD1,500, penerima barang harus menggunakan dokumen PIBK atau PIB.
Peraturan impor, yang bertujuan untuk meningkatkan efisiensi, kecepatan, dan kemudahan perhitungan tarif, merupakan bagian dari paket kebijakan ekonomi ke-14 pemerintah, yang dimaksudkan untuk mendukung pertumbuhan e- commerce. Namun kenyataannya, kita melihat peraturan ini justru menyulitkan bisnis dalam negeri.
Market Index
Last Trade Chg (%) MoM YoY
JCI 6,021.8 -0.3 2.0 15.5
MSCI Indonesia 26.8 -0.7 1.1 15.5
MSCI EM 1,128.5 -0.5 0.7 33.5
HANG SENG 29,120.9 -0.1 2.3 29.3
KOSPI 2,543.0 0.2 2.8 28.1
FTSE 7,433.0 -0.7 -0.7 11.2
DJIA 23,422.2 -0.2 2.6 24.5
NASDAQ 6,750.9 0.0 2.2 28.9
Valuation
2017F P/E (x) P/B (x) ROE (%)
JCI 17.8 2.6 18.4
Key Rates
Last Trade Chg (bps) MoM YoY
BI 7-Day RR 4.25 0 0 -100
3yr 6.17 -2 3 -82
10yr 6.64 -1 6 -84
FX
Last Trade Chg (%) MoM YoY
USD/IDR 13,543.00 0.2 0.0 2.9
USD/KRW 1,117.05 0.1 -1.1 -4.7
USD/JPY 113.53 0.1 1.5 4.7
USD/CNY 6.64 0.2 1.0 -2.4
Commodities
Last Trade Chg (%) MoM YoY
WTI 56.7 -0.8 9.7 16.0
Gold 1,275.1 -0.8 -2.2 4.4
Coal 97.7 -0.1 2.4 -12.3
Palm Oil 2,740.0 -0.5 1.8 -4.6
Rubber 123.0 0.0 -6.0 -11.5
Nickel 12,110.0 -1.5 3.3 8.0
Copper 6,786.0 -0.3 -1.4 22.3
Tin 19,425.0 0.0 -6.3 -9.7
JCI Index VS MSCI Emerging Markets
800 950 1,100 1,250
4,500 5,000 5,500 6,000 6,500
10/16 01/17 04/17 07/17 10/17
JCI MSCI EM (pt)
(pt)
800 950 1,100
4,500 5,500
(pt) JCI MSCI EM (pt)
Mirae Asset Sekuritas Indonesia cartoon
Local flashes
TPIA: Chandra Asri bakal rilis surat utang Rp 500 miliar. Pencarian dana PT Chandra Asri Petrochemical Tbk (TPIA) belum usai. Sukses menerbitkan global bond senilai US$ 300 juta, TPIA kembali mencari pendanaan dari pasar lokal. TPIA akan menerbitkan penawaran umum berkelanjutan (PUB) dengan perolehan dana maksimal Rp 1 triliun.
"Sekitar Desember akan kami terbitkan Rp 500 miliar," ujar Direktur TPIA Suryandi belum lama ini. (Kontan)
PGAS: PGAS memperluas penetrasi jargas ke Kalimantan. PT Perusahaan Gas Negara Tbk (PGAS) bakal memperluas jaringan gas (jargas) segmen pasar ritelnya. Wilayah Tarakan, Kalimantan Utara bakal menjadi sasaran baru pendistribusian gas rumah tangga emiten pelat merah tersebut. Direktur Infrastruktur dan Teknologi PT Perusahaan Gas Negara Tbk (PGN), Dilo Seno Widagdo mengatakan, perusahaan memperoleh mandat dari pemerintah untuk menghadirkan gas bumi kepada konsumen rumah tangga. (Kontan)
MCAS: M Cash genjot ekspansi usai IPO. Perusahaan rintisan (startup) kini mulai melirik pasar modal sebagai jalur mencari dana segar. Salah satunya, PT M Cash Integrasi Tbk (MCAS) yang belum lama ini melantai di Bursa Efek Indonesia (BEI), dengan raihan dana IPO Rp 300 miliar. Sebagian besar dana itu akan digunakan untuk modal kerja tahun depan, pembelian mesin, perangkat lunak, dan infrastruktur teknologi. MCAS bergerak dalam bidang usaha distribusi produk digital dan e- commerce melalui kios digital (kiosk). Melalui kiosk, pelanggan bisa bertransaksi produk digital, seperti pulsa, tiket konser, token listrik, juga pembayaran tagihan. (Kontan)
INTA: Restrukturisasi anak usaha menekan laba Intraco. Meski pendapatannya tumbuh, bottom line PT Intraco Penta Tbk (INTA) masih terbebani bisnis jasa keuangan.
Pada kuartal III 2017, kerugian INTA melonjak 577,26% year-on-year (yoy) menjadi Rp 155,78 miliar. Proses restrukturisasi yang dijalani anak usaha INTA, PT Intan Baruprana Finance Tbk (IBFN) disebut sebagai salah satu faktor yang memperparah kerugian tersebut. (Kontan)
AALI: Genjot bisnis sapi, Astra Agro siapkan Rp 100 M. PT Astra Agro Lestari Tbk (AALI) berupaya meningkatkan pendapatan dari lini bisnis penjualan sapi. Lewat anak usaha, PT Agro Menara Rachmat yang berlokasi di Kalimantan Tengah, AALI akan mendatangkan ribuan sapi dari Australia. Emiten Grup Astra ini sudah menyiapkan pendanaan hingga Rp 100 miliar. Sapi-sapi yang didatangkan tersebut ditujukan untuk pembibitan. Manajemen berharap, bisnis penjualan sapi akan mendorong program kedaulan pangan di masa mendatang. (Kontan)
RIMO: RIMO perkirakan penjualan 2017 Rp 260 miliar. Emiten properti PT Rimo International Lestari Tbk (RIMO) memprediksi perolehan penjualan di akhir tahun ini tidak akan terlalu jauh dari perolehan penjualan di kuartal ketiga 2017. Penjualan properti yang cenderung stagnan jadi penyebab perusahaan tak terlalu optimistis pendapatan bisa tumbuh tinggi di penghujung tahun ini. Direktur Keuangan RIMO Herman Susanto memperkirakan, perolehan penjualan hanya akan bertambah sekitar Rp 5 miliar hingga Rp 6 miliar hingga akhir tahun nanti. "Jadi, mungkin jumlah penjualan yang bisa kami peroleh di tahun ini berkisar antara Rp 250 miliar sampai Rp 260 miliar," ujarnya di Jakarta, Jumat (10/11). (Kontan)
Technical analysis
Tasrul +62-21-515-1140 [email protected]
Jakarta Composite Index (JCI) – Limited Downside IHSG akan menguji level support di 6,010.
IHSG saat masih dalam pola uptrend jangka pendek relatif valid yang dimulai sejak 155 hari terakhir dengan r-squared = 0.8973 dan bergerak normal dalam rentang +/-1.63 std.deviasi dari centerline. Peluang IHSG bergerak di luar pergerakan normal sekitar 10.27% atau sekitar 16 bar chart. Rata-rata volatilitas normal pergerakan IHSG saat ini sebesar antara +0.36% / - 0.35 % atau +21.15 point / -20.54 point (rata-rata pergerakan normal positif / negatif selama periode analisis) sebagaimana terlihat pada Figure 1.
Summary
Item Data Item Data
Close (Nov 10, 2017) 6,021.83(-0.3%) Trading range 6,010 - 6,042
Average index performance (%) 4.10 Target
Period 155 - Daily 6,042
r-squared 0.8973 - Weekly 6,088
Volatility (+/-, %) +0.35 / -0.36 - Monthly 6,112
Volatility (+/-, point) +21.08 / -21.68 Stop loss 6,007
Source: Mirae Asset Sekuritas Indonesia Research
Figure 1. Daily trend – Uptrend
Source: Mirae Asset Sekuritas Indonesia Research
Created w ith AmiBroker - advanced charting and technical analysis softw are. http://w w w .amibroker.com Optimization Trading System - ©2010
Optimization Trading System - ©2010 Optimization Trading System - ©2010
_____ 6,053.4 _____ 6,010.4
^JKSE [ ^JKSE ] - Daily - 11/10/2017 Open: 6,044 High: 6,055 Low: 6,020 Close: 6,022 Vol. 5,406,066,176 Prev. Avg. Price: 6,032.3
R-Squared: 0.8973 Period: 155 Std.Dev: 1.64 Volatility (+) : 0.0035 Volatility (-) : -0.0036 V-Ratio : 0.97 Chg.: -0.3%
6,075.42
6,021.83 6,007.12 6,007.12 6,004.5 5,938.82
5,830.85 6,183.38
Apr May Jun Jul Aug Sep Oct Nov
^JKSE - Volume = 5,406,066,176.00, EMA(Volume,17) = 6,032,012,288.00
5,406,066,176 6,032,012,288
Aliran dana keluar dan volatilitas pergerakkan indeks turun masih terlihat namun mulai terbatas.
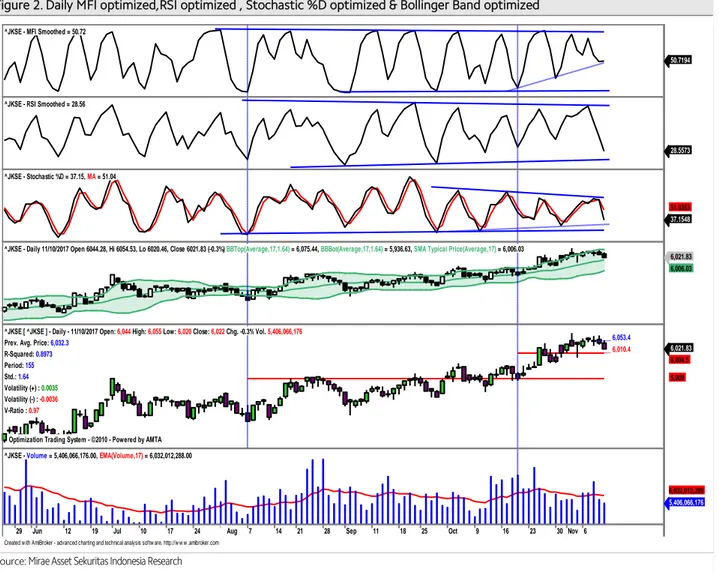
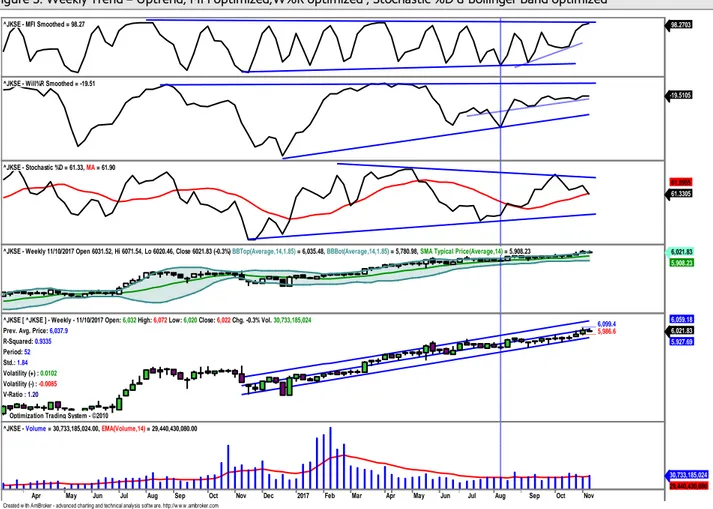
Pada Figure 2, terlihat dari hasil optimalisasi terakhir pada periode daily, potensi koreksi masih terlihat. Indikator MFI optimized dan indikator RSI optimized dan indikator Stochastic %D optimized cenderung akan menguji support trend line. Pada Bollinger Band optimized harga akan menguji center line.. Sementara itu pada Figure 3 pada periode weekly indikator MFI optimized dan indikator W%R optimized naik terbatas, bahkan indikator stochastic %D optimized mulai bergerak turun. Daily resistance di 6,042 dan daily support di 6,010.. Cut loss level di 6,007..
Figure 2. Daily MFI optimized,RSI optimized , Stochastic %D optimized & Bollinger Band optimized
Source: Mirae Asset Sekuritas Indonesia Research
Created w ith AmiBroker - advanced charting and technical analysis softw are. http://w w w .amibroker.com
^JKSE - MFI Smoothed = 50.72
50.7194
^JKSE - RSI Smoothed = 28.56
28.5573
^JKSE - Stochastic %D = 37.15, MA = 51.04
37.1548 51.0353
^JKSE - Daily 11/10/2017 Open 6044.28, Hi 6054.53, Lo 6020.46, Close 6021.83 (-0.3%) BBTop(Average,17,1.64) = 6,075.44, BBBot(Average,17,1.64) = 5,936.63, SMA Typical Price(Average,17) = 6,006.03
6,021.83 6,006.03
_____ 6,053.4 _____ 6,010.4
Optimization Trading System - ©2010 - Powered by AMTA Optimization Trading System - ©2010 - Powered by AMTA
^JKSE [ ^JKSE ] - Daily - 11/10/2017 Open: 6,044 High: 6,055 Low: 6,020 Close: 6,022 Chg. -0.3% Vol. 5,406,066,176 Prev. Avg. Price: 6,032.3
R-Squared: 0.8973 Period: 155 Std.: 1.64 Volatility (+) : 0.0035 Volatility (-) : -0.0036 V-Ratio : 0.97
6,021.83 6,004.5 5,909
29 Jun 12 19 Jul 10 17 24 31Aug 7 14 21 28 Sep 11 18 25 Oct 9 16 23 30 Nov 6
^JKSE - Volume = 5,406,066,176.00, EMA(Volume,17) = 6,032,012,288.00
5,406,066,176 6,032,012,288
Figure 3. Weekly Trend – Uptrend, MFI optimized,W%R optimized , Stochastic %D & Bollinger Band optimized
Source: Mirae Asset Sekuritas Indonesia Research
IHSG akan coba nai dan bertahan di 6,032.3
Terlihat pada pergerakkan daily, rata-rata koreksi normal selama periode analisis adalah sekitar -0.36%, sementara saat ini di level -0.3%. Sementara itu pada pergerakkan weekly potensi koreksi normal rata-rata sekitar -0.85%, sementara saat ini terkoreksi ke level 0.3%. Dengan potensi koreksi masih berlanjut namun juga relatif terbatas. Pada Figure 4,5 dan 6 terlihat perkiraan normal trading range untuk masing-masing periode.
Figure 4. Daily : 6,010– 6,042 Figure 5. Weekly : 5,987– 6,088 Figure 6. Monthly : 5,956– 6,112
x x
Source: Mirae Asset Sekuritas Indonesia Research Source: Mirae Asset Sekuritas Indonesia Research Source: Mirae Asset Sekuritas Indonesia Research
Created w ith AmiBroker - advanced charting and technical analysis softw are. http://w w w .amibroker.com
^JKSE - MFI Smoothed = 98.27 98.2703
^JKSE - Will%R Smoothed = -19.51
-19.5105
^JKSE - Stochastic %D = 61.33, MA = 61.90
61.3305 61.8955
^JKSE - Weekly 11/10/2017 Open 6031.52, Hi 6071.54, Lo 6020.46, Close 6021.83 (-0.3%) BBTop(Average,14,1.85) = 6,035.48, BBBot(Average,14,1.85) = 5,780.98, SMA Typical Price(Average,14) = 5,908.23 6,021.83 5,908.23
_____ 6,099.4 _____ 5,986.6
Optimization Trading System - ©2010
^JKSE [ ^JKSE ] - Weekly - 11/10/2017 Open: 6,032 High: 6,072 Low: 6,020 Close: 6,022 Chg. -0.3% Vol. 30,733,185,024 Prev. Avg. Price: 6,037.9
R-Squared: 0.9335 Period: 52 Std.: 1.84 Volatility (+) : 0.0102 Volatility (-) : -0.0085 V-Ratio : 1.20
6,021.83 5,927.69 6,059.18
24 Apr May Jun Jul Aug Sep Oct Nov Dec 2017 Feb Mar Apr May Jun 22 Jul Aug 31 Sep Oct Nov
^JKSE - Volume = 30,733,185,024.00, EMA(Volume,14) = 29,440,430,080.00
30,733,185,024 29,440,430,080
Created w ith AmiBroker - advanced charting and technical analysis sof tw are. http://w w w .amibroker.com _____ 6,053.4
_____ 6,010.4
6,000.2 6,042.9
6,032.3
^JKSE [ ^JKSE ] - Daily - 11/10/2017 Open: 6,044 High: 6,055 Prev. Avg. Price: 6,032.3
R-Squared: 0.8973 Period: 155 Std.Dev: 1.64 Volatility (+) : 0.0035 Volatility (-) : -0.0036 V-Ratio : 0.97 Chg.: -0.3%
6,021.83
31 Nov 3 67 89 10
^JKSE - Volume = 5,406,066,176.00
5,406,066,176
Created w ith AmiBroker - advanced charting and technical analysis sof tw are. http://w w w .amibroker.com _____ 6,099.4
_____ 5,986.6
6,037.9 6,068.7
6,012.3
^JKSE [ ^JKSE ] - Weekly - 11/10/2017 Open: 6,032 High: 6,072 Prev. Avg. Price: 6,037.9
R-Squared: 0.9335 Period: 52 Std.Dev: 1.84 Volatility (+) : 0.0102 Volatility (-) : -0.0085 V-Ratio : 1.20 Chg.: -0.3%
6,021.83
Oct Nov
^JKSE - Volume = 30,733,185,024.00
30,733,185,024
Created w ith AmiBroker - advanced charting and technical analysis sof tw are. http://w w w .amibroker.com _____ 6,215.9
_____ 5,840.0 6,031.2
5,956.9 6,112.2
^JKSE [ ^JKSE ] - Monthly - 11/10/2017 Open: 6,017 High: 6,082 Prev. Avg. Price: 6,031.2
R-Squared: 0.8886 Period: 30 Std.Dev: 1.60 Volatility (+) : 0.0306 Volatility (-) : -0.0317 V-Ratio : 0.97 Chg.: 0.3%
6,021.83
Oct 2017 Apr Jul Oct
^JKSE - Volume = 46,904,647,680.00
46,904,647,680
Stocks on our focus list
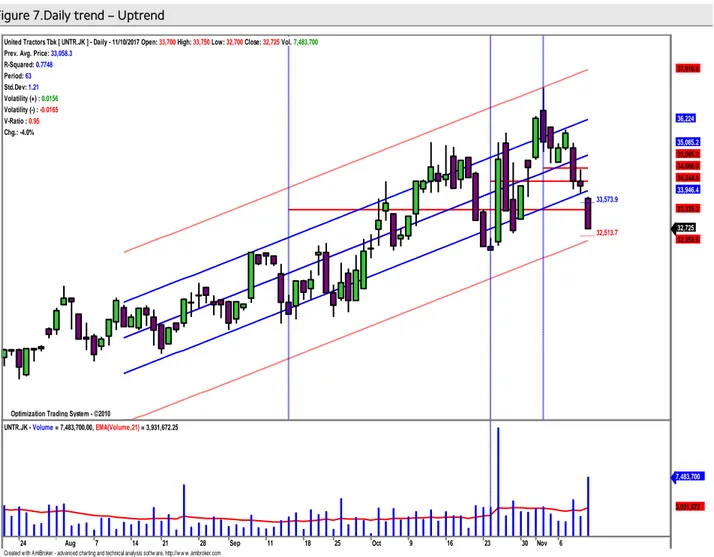
United Tractors (UNTR)-Daily, Buy on Weakness
Harga akan coba naik mendekati normal lower band pada uptrend channel.
Secara umum harga saham ini masih bergerak pada uptrend channel yang masih relatif valid (r-squared = 0.801) selama 69 hari terakhir yang bergerak normal dalam rentang +/- 1.21 std.deviasi dari center line. Peluang harga keluar dari pergerakan normal sekitar 19.95 % (sekitar 14 bar chart ). Rata-rata volatilitas normal pergerakan harga saat ini sebesar antara +1.56 % / -1.65 % atau +510.51 rupiah / -539.96 rupiah (rata-rata pergerakan normal positif / negatif, selama periode analisis) sebagaimana terlihat pada Figure 7.
Summary
Item Data Item Data
Close (Nov 10, 2017) 32,725 (-4.0%) Trading range 32,500 - 33,225 Relative Avg. Price performance to JCI (%) 13.73 Target
β (beta) 2.06 - Daily 33,225
Corelation 0.81 - Weekly 33,775
Period 69 - Monthly 36,550
r-squared 0.801 Stop loss 32,100
Volatility (+/-, %) +1.56/ -1.65
Volatility (+/-, Rp.) +510.51/ -539.96
Source: Mirae Asset Sekuritas Indonesia Research
Figure 7.Daily trend – Uptrend
Source: Mirae Asset Sekuritas Indonesia Research
Created w ith AmiBroker - advanced charting and technical analysis softw are. http://w w w .amibroker.com
_____ 33,573.9
_____ 32,513.7
Optimization Trading System - ©2010 Optimization Trading System - ©2010 Optimization Trading System - ©2010 Optimization Trading System - ©2010 Optimization Trading System - ©2010
United Tractors Tbk [ UNTR.JK ] - Daily - 11/10/2017 Open: 33,700 High: 33,750 Low: 32,700 Close: 32,725 Vol. 7,483,700 Prev. Avg. Price: 33,058.3
R-Squared: 0.7748 Period: 63 Std.Dev: 1.21 Volatility (+) : 0.0156 Volatility (-) : -0.0165 V-Ratio : 0.95 Chg.: -4.0%
32,725 32,353.6 33,335.3 33,946.4 34,244.8 34,666.9 35,085.2 35,085.2 36,224 37,816.8
24 31 Aug 7 14 21 28 Sep 11 18 25 Oct 9 16 23 30 Nov 6
UNTR.JK - Volume = 7,483,700.00, EMA(Volume,21) = 3,931,672.25
7,483,700
3,931,672
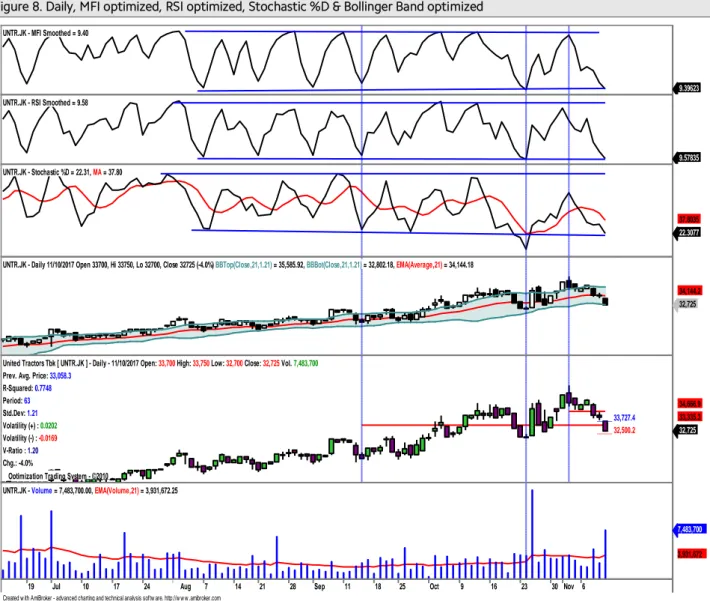
Aliran dana keluar dan volatilitas harga turun mulai terbatas.
Pada Figure 8, terlihat dari hasil optimalisasi terakhir terlihat pada indikator MFI optimized, indikator RSI optimized dan indikator Stochastic %D. sudah berada sekitar support trendline. Sementara itu harga pada indikator Bollinger Band optimized terlihat sudah berada sekitar BBBottom. Daily resistance terdekat di 33,225 sebelum ke weekly resistance di 33,375. Daily dan weekly support di 32,500 dan 32,100.Cut loss level di 32,100.
Figure 8. Daily, MFI optimized, RSI optimized, Stochastic %D & Bollinger Band optimized
Source: Mirae Asset Sekuritas Indonesia Research
Created w ith AmiBroker - advanced charting and technical analysis softw are. http://w w w .amibroker.com UNTR.JK - MFI Smoothed = 9.40
9.39623 UNTR.JK - RSI Smoothed = 9.58
9.57835 UNTR.JK - Stochastic %D = 22.31, MA = 37.80
22.3077 37.8035
UNTR.JK - Daily 11/10/2017 Open 33700, Hi 33750, Lo 32700, Close 32725 (-4.0%) BBTop(Close,21,1.21) = 35,585.92, BBBot(Close,21,1.21) = 32,802.18, EMA(Average,21) = 34,144.18
32,725 34,144.2
_____ 33,727.4 _____ 32,500.2
Optimization Trading System - ©2010 Optimization Trading System - ©2010
United Tractors Tbk [ UNTR.JK ] - Daily - 11/10/2017 Open: 33,700 High: 33,750 Low: 32,700 Close: 32,725 Vol. 7,483,700 Prev. Avg. Price: 33,058.3
R-Squared: 0.7748 Period: 63 Std.Dev: 1.21 Volatility (+) : 0.0202 Volatility (-) : -0.0169 V-Ratio : 1.20 Chg.: -4.0%
32,725 33,335.3 34,666.9
19 Jul 10 17 24 31Aug 7 14 21 28 Sep 11 18 25 Oct 9 16 23 30 Nov 6
UNTR.JK - Volume = 7,483,700.00, EMA(Volume,21) = 3,931,672.25
7,483,700 3,931,672
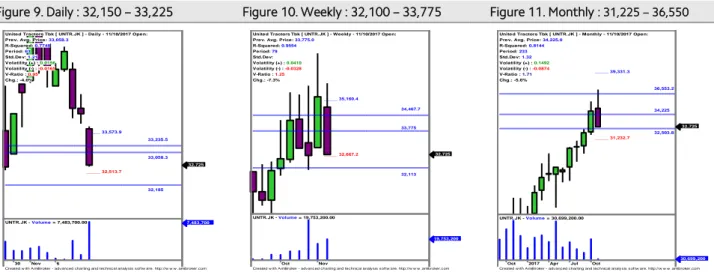
Harga akan coba naik dan bertahan diatas rata-rata pada masing-masing periode.
Untuk mampu naik lebih lanjut, harga saham saat ini harus mampu minimal bertahan diatas rata-rata masing-masing periode (positive area). Pada pergerakkan daily harga saat ini terkoreksi ke level -4.0 % , normal koreksi hanya sekitar -1.65 %. Sementara itu pada pergerakkan weekly terkoreksi sekitar -7.3%, normal koreksi sekitar -3.28 %.
Dengan demikian potensi koreksi mulai terbatas. Pada Figure 9,10 dan 11 terlihat perkiraan normal trading range untuk masing-masing periode.
Figure 9. Daily : 32,150 – 33,225 Figure 10. Weekly : 32,100 – 33,775 Figure 11. Monthly : 31,225 – 36,550
Source: Mirae Asset Sekuritas Indonesia Research Source: Mirae Asset Sekuritas Indonesia Research Source: Mirae Asset Sekuritas Indonesia Research
Created w ith AmiBroker - advanced charting and technical analysis sof tw are. http://w w w .amibroker.com _____ 33,573.9
_____ 32,513.7
32,185 33,058.3 33,235.5 United Tractors Tbk [ UNTR.JK ] - Daily - 11/10/2017 Open:
Prev. Avg. Price: 33,058.3 R-Squared: 0.7748 Period: 63 Std.Dev: 1.21 Volatility (+) : 0.0156 Volatility (-) : -0.0165 V-Ratio : 0.95 Chg.: -4.0%
32,725
30 Nov 6
UNTR.JK - Volume = 7,483,700.00 7,483,700
Created w ith AmiBroker - advanced charting and technical analysis sof tw are. http://w w w .amibroker.com _____ 35,160.4
_____ 32,667.2
33,775 34,467.7
32,113 United Tractors Tbk [ UNTR.JK ] - Weekly - 11/10/2017 Open:
Prev. Avg. Price: 33,775.0 R-Squared: 0.9554 Period: 79 Std.Dev:
Volatility (+) : 0.0410 Volatility (-) : -0.0328 V-Ratio : 1.25 Chg.: -7.3%
32,725
Oct Nov
UNTR.JK - Volume = 19,753,200.00
19,753,200
Created w ith AmiBroker - advanced charting and technical analysis sof tw are. http://w w w .amibroker.com _____ 39,331.3
_____ 31,232.7 34,225
32,503.8 36,553.2 United Tractors Tbk [ UNTR.JK ] - Monthly - 11/10/2017 Open:
Prev. Avg. Price: 34,225.0 R-Squared: 0.8144 Period: 233 Std.Dev: 1.32 Volatility (+) : 0.1492 Volatility (-) : -0.0874 V-Ratio : 1.71 Chg.: -5.6%
32,725
Oct 2017 Apr Jul Oct
UNTR.JK - Volume = 30,699,200.00
30,699,200
Bank Central Asia (BBCA) - Daily , Buy on Weakness
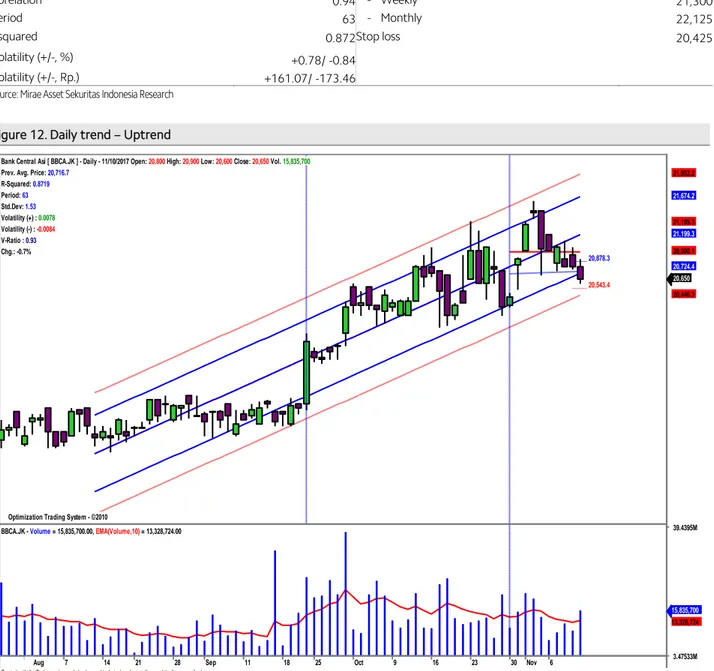
Harga akan coba bertahan diatas normal lower band pada uptrend channel.
Secara umum harga saham ini juga masih bergerak dalam pola uptrend channel yang masih relatif valid (r-squared = 0.872) selama 63 hari terakhir dan bergerak normal dalam rentang +/- 1.53 std.deviasi dari center line. Peluang harga keluar dari pergerakan normal sekitar 12.81 % (sekitar 8 bar chart ). Rata-rata volatilitas normal pergerakan harga saat ini sebesar antara +0.78% / -0.84 % atau + 161.07 rupiah / - 173.46 rupiah (rata-rata pergerakan normal positif / negatif, selama periode analisis) sebagaimana sebagaimana terlihat pada Figure 12.
Summary
Item Data Item Data
Close (Nov 10, 2017) 20,650 ( -0.7%) Trading range 20,550 - 20,875 Relative Avg. Price performance to JCI (%) 13.05 Target
β (beta) 1.19 - Daily 20,875
Corelation 0.94 - Weekly 21,300
Period 63 - Monthly 22,125
r-squared 0.872 Stop loss 20,425
Volatility (+/-, %) +0.78/ -0.84
Volatility (+/-, Rp.) +161.07/ -173.46
Source: Mirae Asset Sekuritas Indonesia Research
Figure 12. Daily trend – Uptrend
Source: Mirae Asset Sekuritas Indonesia Research
Created w ith AmiBroker - advanced charting and technical analysis softw are. http://w w w .amibroker.com
_____ 20,878.3
_____ 20,543.4
Optimization Trading System - ©2010 Optimization Trading System - ©2010 Optimization Trading System - ©2010
Bank Central Asi [ BBCA.JK ] - Daily - 11/10/2017 Open: 20,800 High: 20,900 Low: 20,600 Close: 20,650 Vol. 15,835,700 Prev. Avg. Price: 20,716.7
R-Squared: 0.8719 Period: 63 Std.Dev: 1.53 Volatility (+) : 0.0078 Volatility (-) : -0.0084 V-Ratio : 0.93 Chg.: -0.7%
20,650 20,446.3 20,724.4 20,990.1 21,199.3 21,199.3 21,674.2 21,952.2
31 Aug 7 14 21 28 Sep 11 18 25 Oct 9 16 23 30 Nov 6 3.47533M
39.4395M BBCA.JK - Volume = 15,835,700.00, EMA(Volume,10) = 13,328,724.00
15,835,700 13,328,724
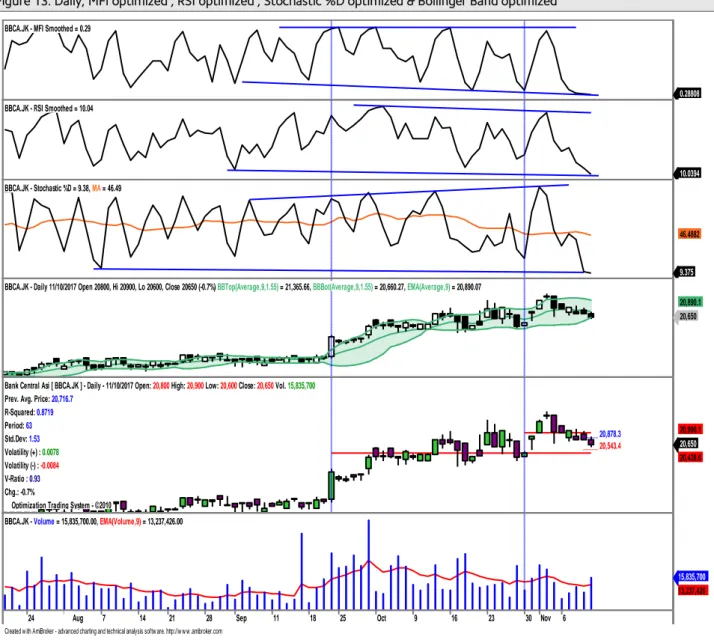
Aliran dana keluar dan volatilitas harga turun mulai terbatas.
Pada Figure 13, terlihat dari hasil optimalisasi indikator MFI optimized,indikator RSI optimizeddan indikator Stochastic %D optimized akan menguji support trend line. Disisi lain pada indikator Bollinger Band optimized harga akan coba naik ke center line Weekly resistance di 21,425 dengan catatan daily resistance 21,025 dapat ditembus.
Sementara itu daily dan weeklysupport di 20,550 dan 21,300.Cut loss level di 20,425.
Figure 13. Daily, MFI optimized , RSI optimized , Stochastic %D optimized & Bollinger Band optimized
Source: Mirae Asset Sekuritas Indonesia Research
Created w ith AmiBroker - advanced charting and technical analysis softw are. http://w w w .amibroker.com BBCA.JK - MFI Smoothed = 0.29
0.28808 BBCA.JK - RSI Smoothed = 10.04
10.0394 BBCA.JK - Stochastic %D = 9.38, MA = 46.49
9.375 46.4882
BBCA.JK - Daily 11/10/2017 Open 20800, Hi 20900, Lo 20600, Close 20650 (-0.7%) BBTop(Average,9,1.55) = 21,365.66, BBBot(Average,9,1.55) = 20,660.27, EMA(Average,9) = 20,890.07
20,650 20,890.1
_____ 20,878.3 _____ 20,543.4
Optimization Trading System - ©2010 Optimization Trading System - ©2010
Bank Central Asi [ BBCA.JK ] - Daily - 11/10/2017 Open: 20,800 High: 20,900 Low: 20,600 Close: 20,650 Vol. 15,835,700 Prev. Avg. Price: 20,716.7
R-Squared: 0.8719 Period: 63 Std.Dev: 1.53 Volatility (+) : 0.0078 Volatility (-) : -0.0084 V-Ratio : 0.93 Chg.: -0.7%
20,650 20,428.6 20,990.1
24 31 Aug 7 14 21 28 Sep 11 18 25 Oct 9 16 23 30 Nov 6
BBCA.JK - Volume = 15,835,700.00, EMA(Volume,9) = 13,237,426.00
15,835,700 13,237,426
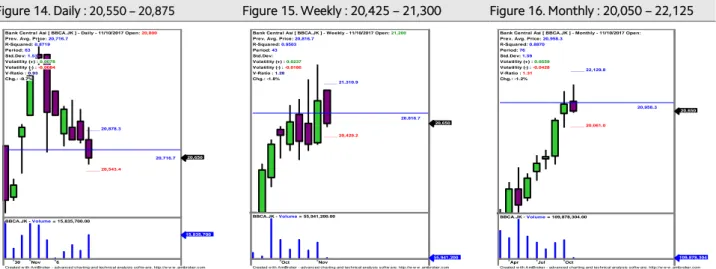
Harga saat ini akan coba naik dan bertahan diatas rata-ratapada masing-masing periode.
Untuk mampu naik lebih lanjut, harga saham saat ini harus mampu minimal bertahan diatas rata-rata masing-masing periode (positive area) . Lebih lanjut potensi koreksi normal harga pada pergerakkan daily sekitar -0.84%, saat ini di level -0.7 %. Sementara itu pada pergerakkan weekly koreksi normal sekitar -1,86% saat ini harga terkoreksi ke - 1.8%. Dengan demikian potensi koreksi mulai terbatas. Pada Figure 14,15 dan 16 terlihat perkiraan normal trading range untuk masing-masing periode.
Figure 14. Daily : 20,550 – 20,875 Figure 15. Weekly : 20,425 – 21,300 Figure 16. Monthly : 20,050 – 22,125 x
Source: Mirae Asset Sekuritas Indonesia Research Source: Mirae Asset Sekuritas Indonesia Research Source: Mirae Asset Sekuritas Indonesia Research
Created w ith AmiBroker - advanced charting and technical analysis sof tw are. http://w w w .amibroker.com _____ 20,878.3
_____ 20,543.4
20,716.7 Bank Central Asi [ BBCA.JK ] - Daily - 11/10/2017 Open: 20,800 Prev. Avg. Price: 20,716.7
R-Squared: 0.8719 Period: 63 Std.Dev: 1.53 Volatility (+) : 0.0078 Volatility (-) : -0.0084 V-Ratio : 0.93 Chg.: -0.7%
20,650
30 Nov 6
BBCA.JK - Volume = 15,835,700.00
15,835,700
Created w ith AmiBroker - advanced charting and technical analysis sof tw are. http://w w w .amibroker.com _____ 21,310.9
_____ 20,429.2
20,816.7 Bank Central Asi [ BBCA.JK ] - Weekly - 11/10/2017 Open: 21,200 Prev. Avg. Price: 20,816.7
R-Squared: 0.9503 Period: 43 Std.Dev:
Volatility (+) : 0.0237 Volatility (-) : -0.0186 V-Ratio : 1.28 Chg.: -1.8%
20,650
Oct Nov
BBCA.JK - Volume = 55,941,200.00
55,941,200
Created w ith AmiBroker - advanced charting and technical analysis sof tw are. http://w w w .amibroker.com _____ 22,129.8
_____ 20,061.0
20,958.3 Bank Central Asi [ BBCA.JK ] - Monthly - 11/10/2017 Open:
Prev. Avg. Price: 20,958.3 R-Squared: 0.8870 Period: 76 Std.Dev: 1.59 Volatility (+) : 0.0559 Volatility (-) : -0.0428 V-Ratio : 1.31 Chg.: -1.2%
20,650
Apr Jul Oct
BBCA.JK - Volume = 109,878,304.00
109,878,304
Astra International (ASII) - Weekly, Trading Buy
Harga akan coba naik dan bertahan diatas normal lower band pada uptrend channel.
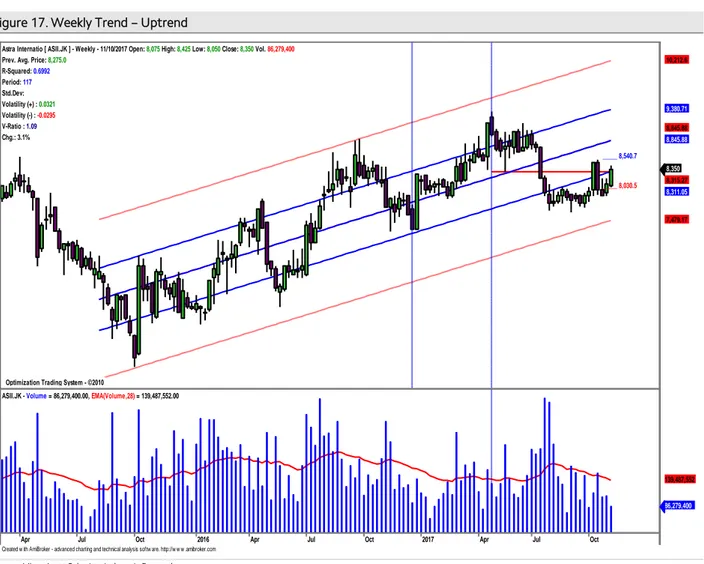
Secara umum harga akan coba naik dan bertahan diatas normal lower band pada uptrend channel yang masih relatif valid dengan r-squared = 0.70 selama 117 minggu terakhir dan bergerak normal dalam rentang +/-1.04 std.deviasi dari centerline. Peluang harga keluar dari pergerakan normalnya sekitar 30.08 % (sekitar 35 bar chart ). Rata- rata volatilitas normal pergerakan harga saat ini sebesar antara +3.21 % / - 2.95 % atau + 268.04 rupiah / -246.33 rupiah (rata-rata pergerakan normal positif / negatif, selama periode analisis)sebagaimana terlihat pada Figure 17.
Summary
Item Data Item Data
Close (Nov 10, 2017) 8,350 (+0.9%) Normal trading range 8,025 - 8,550
Relative Avg. Price performance to JCI (%) 1.46 Target
β (beta) 1.55 - Daily 8,325
Corelation 0.31 - Weekly 8,550
Period 117 - Monthly 9,100
r-squared 0.70 Stop loss 8,000
Volatility (+/-, %) +3.21/ -2.95
Volatility (+/-, Rp.) +268.04/ -246.33
Source: Mirae Asset Sekuritas Indonesia Research
Figure 17. Weekly Trend – Uptrend
Source: Mirae Asset Sekuritas Indonesia Research
Created w ith AmiBroker - advanced charting and technical analysis softw are. http://w w w .amibroker.com
_____ 8,540.7
_____ 8,030.5
Optimization Trading System - ©2010 Optimization Trading System - ©2010 Optimization Trading System - ©2010
Astra Internatio [ ASII.JK ] - Weekly - 11/10/2017 Open: 8,075 High: 8,425 Low: 8,050 Close: 8,350 Vol. 86,279,400 Prev. Avg. Price: 8,275.0
R-Squared: 0.6992 Period: 117 Std.Dev:
Volatility (+) : 0.0321 Volatility (-) : -0.0295 V-Ratio : 1.09 Chg.: 3.1%
8,350 8,315.27 8,311.05
7,479.17 8,845.88 8,845.88 9,380.71 10,212.6
Apr Jul Oct 2016 Apr Jul Oct 2017 Apr Jul Oct
ASII.JK - Volume = 86,279,400.00, EMA(Volume,28) = 139,487,552.00
86,279,400 139,487,552
Aliran dana masuk dan volatilitas harga naik masih terlihat.
Pada Figure 18, terlihat dari hasil optimalisasi, indikator MFI optimized, indikator W%R optimized,indikator RSI optimized , indikator Stochastic %D cenderung naik Sementara pada indikator Bollinger Band optimized harga coba naik dan tembus center line. Dengan demikian diperkirakan potensi kenaikkan masih terlihat Perkiraan daily resistance di 8,325 sebelum ke weekly resistance di 8,550. Daily support dan weekly support di 8,200 dan 8,325. Cut loss level di 8,000.
Figure 18. Weekly ,MFI optimized, W%R optimized, Stochastic %D optimized & Bollinger Band optimized
Source: Mirae Asset Sekuritas Indonesia Research
Created w ith AmiBroker - advanced charting and technical analysis softw are. http://w w w .amibroker.com ASII.JK - MFI Smoothed = 66.61
66.6055
ASII.JK - RSI Smoothed = 64.83
64.8319
ASII.JK - Stochastic %D = 54.98, MA = 34.84
54.9801 34.8373
ASII.JK - Weekly 11/10/2017 Open 8075, Hi 8425, Lo 8050, Close 8350 (3.1%) BBTop(Average,28,1.09) = 8,786.47, BBBot(Average,28,1.09) = 7,846.27, SMA Typical Price(Average,28) = 8,316.37
8,350 8,316.37
_____ 8,540.7 _____ 8,030.5
Optimization Trading System - ©2010
Astra Internatio [ ASII.JK ] - Weekly - 11/10/2017 Open: 8,075 High: 8,425 Low: 8,050 Close: 8,350 Vol. 86,279,400 Prev. Avg. Price: 8,275.0
R-Squared: 0.6992 Period: 117 Std.Dev:
Volatility (+) : 0.0321 Volatility (-) : -0.0295 V-Ratio : 1.09 Chg.: 3.1%
8,350 8,315.27
Apr Jul Oct 2016 Apr Jul Oct 2017 Apr Jul Oct
ASII.JK - Volume = 86,279,400.00, EMA(Volume,28) = 139,487,552.00
86,279,400 139,487,552
Relative Avg.Price Performance to JCI (%) : Persentase kenaikan harga saham dari rata-rata sejak IHSG memulai uptrend-nya β (beta) : Indikator sensitivitas harga saham terhadap IHSG, beta diatas 1 berarti harga makin sensitif terhadap pergerakan IHSG dan sebaliknya
Correlation : Ukuran kuat hubungan (korelasi) pergerakan harga saham dibanding dengan pergerakan IHSG selama periode analisis.
Period : Periode uptrend / downtrend yang valid dari pergerakan harga saham.
r-squared : Koefisien determinasi, menunjukkan persentase gerakan yang dapat dijelaskan dengan regresi linier.Nilai R2 terletak antara 0 – 1, dan kecocokan model dikatakan lebih baik kalau R2 semakin mendekati 1 (validitas uptrend atau downtrend makin valid) Volatility (+/-%) : Besaran volatilitas normal maksimal/minimal dari pergerakan harga harian selama harga saham bergerak normal pada trend channel dalam persentase.
Volatility (+/- point or Rp) : Besaran volatilitas normal maksimal/minimal dari pergerakan harga harian selama harga saham bergerak dalam periode analisis.
Harga akan coba bertahan diatas rata-ratapada masing-masing periode.
Untuk mampu naik lebih lanjut, harga saham saat ini harus mampu minimal bertahan diatas rata-rata masing-masing periode (positive area) . Jika dilihat lebih lanjut kenaikkan normal pada pergerakkan daily sekitar +1.26 %, saat ini di level +0.99 %. Sementara itu pada pergerakkan weekly kenaikkan normal sekitar +3.21 % saat ini di level +3.1.0%.
Dengan demikan potensi kenaikkan masih terlihat namun untuk sementara masih terbatas.Pada Figure 19,20 dan 21 terlihat perkiraan normal trading range untuk masing-masing periode.
Figure 19. Daily : 8,200 – 4,325 Figure 20. Weekly : 8,025 – 8,550 Figure 21. Monthly : 7,650 – 9,100
Source: Mirae Asset Sekuritas Indonesia Research Source: Mirae Asset Sekuritas Indonesia Research Source: Mirae Asset Sekuritas Indonesia Research
analyzed by : Tasrul, [email protected], +62-21- 5151140
Buy: : Beli, harga sudah menyentuh atau jatuh di bawah support dan indikator teknikal berada di oversold area.
Sell: : Jual, harga sudah menyentuh atau tembus resistance normal dan indikator berada di overbought area.
BoW: : Buy on Weakness, beli ketika harga sudah melemah, dimana volume tekanan jual mulai berkurang dan harga mendekati support, serta indikator teknikal sudah berada di oversold area.
SoS: : Sell on Strength, jual ketika kenaikan harga sudah mulai terbatas dimana volume beli mulai berkurang dan harga mendekati resistance, serta indikator teknikal sudah berada di overbought area.
Trading Buy: : Beli dan jual kembali secepatnya jika harga sudah mencapai level resistance terdekat, karena kenaikan harga relatif tidak stabil atau hanya sementara.
Trading Sell : Jual dan beli kembali secepatnya jika harga sudah mencapai level support terdekat karena koreksi harga relatif tidak stabil atau hanya sementara.
Relative Avg.Price Performance to JCI (%) : Persentase kenaikan harga saham dari rata-rata sejak IHSG memulai uptrend-nya β (beta) : Indikator sensitivitas harga saham terhadap IHSG, beta diatas 1 berarti harga makin sensitif terhadap pergerakan IHSG dan sebaliknya
Correlation : Ukuran kuat hubungan (korelasi) pergerakan harga saham dibanding dengan pergerakan IHSG selama periode analisis.
Period : Periode uptrend / downtrend yang valid dari pergerakan harga saham.
r-squared : Koefisien determinasi, menunjukkan persentase gerakan yang dapat dijelaskan dengan regresi linier.Nilai R2 terletak antara 0 – 1, dan kecocokan model dikatakan lebih baik kalau R2 semakin mendekati 1 (validitas uptrend atau downtrend makin valid) Volatility (+/-%) : Besaran volatilitas normal positif/negatif dari pergerakan harga harian selama harga saham bergerak normal pada trend channel dalam persentase.
Volatility (+/- point or Rp) : Besaran volatilitas normal positifl/negatif dari pergerakan harga harian selama harga saham bergerak dalam periode analisis.
Created w ith AmiBroker - advanced charting and technical analysis sof tw are. http://w w w .amibroker.com _____ 8,429.5
_____ 8,219.5 8,325 Astra Internatio [ ASII.JK ] - Daily - 11/10/2017 Open: 8,225 Prev. Avg. Price: 8,325.0
R-Squared: 0.7042 Period: 549 Std.Dev: 1.04 Volatility (+) : 0.0126 Volatility (-) : -0.0127 V-Ratio : 0.99 Chg.: 0.9%
8,350
30 Nov 6
ASII.JK - Volume = 21,907,200.00
21,907,200
Created w ith AmiBroker - advanced charting and technical analysis sof tw are. http://w w w .amibroker.com _____ 8,540.7
_____ 8,030.5
8,258.3 Astra Internatio [ ASII.JK ] - Weekly - 11/10/2017 Open: 8,075 Prev. Avg. Price: 8,275.0
R-Squared: 0.6992 Period: 117 Std.Dev:
Volatility (+) : 0.0321 Volatility (-) : -0.0295 V-Ratio : 1.09 Chg.: 3.1%
8,350
Oct Nov
ASII.JK - Volume = 86,279,400.00
86,279,400
Created w ith AmiBroker - advanced charting and technical analysis sof tw are. http://w w w .amibroker.com _____ 9,095.7
_____ 7,646.9 8,258.3 8,677.0 Astra Internatio [ ASII.JK ] - Monthly - 11/10/2017 Open: 8,000 Prev. Avg. Price: 8,258.3
R-Squared: 0.8925 Period: 200 Std.Dev: 1.61 Volatility (+) : 0.1014 Volatility (-) : -0.0740 V-Ratio : 1.37 Chg.: 4.4%
8,350
Oct 2017 Apr Jul Oct
ASII.JK - Volume = 152,072,096.00
152,072,096
Chart 22. JCI Vs. USD/IDR Chart 23. JCI performance (absolute vs. relative)
Source: Bloomberg, Mirae Asset Sekuritas Indonesia Note: Relative to MSCI EM Index
Source: Bloomberg, Mirae Asset Sekuritas Indonesia
Chart 24. Foreigner’s net purchase (EM) Chart 25. Energy price
Note: The latest figure for India are Nov 8th, 2017
Source: Bloomberg, Mirae Asset Sekuritas Indonesia Source: Bloomberg, Mirae Asset Sekuritas Indonesia
Chart 26. Non-ferrous metal price Chart 27. Precious metal price
Source: Bloomberg, Mirae Asset Sekuritas Indonesia Source: Bloomberg, Mirae Asset Sekuritas Indonesia 13,100
13,200 13,300 13,400 13,500 13,600 13,700 13,800
5,600 5,700 5,800 5,900 6,000 6,100
8/14 9/11 10/9 11/6
(IDR)
(pt) JCI (L) USD/IDR (R)
-0.3 -0.3
1.6
15.1
0.1
-0.5
1.4
-17.8 -20
-16 -12 -8 -4 0 4 8 12 16 20
1D 1W 1M 1Y
Absolute Relative (%, %p)
(%, %p) (%, %p)
0 8
-89 -82 -4
0
-76
-255
-141 -119 -1
1,036
-400 -200 0 200 400 600 800 1,000 1,200
Korea Taiwan Indonesia Thailand Philippines India
1 Day 5 Days
(USDmn) (USDmn) (USDmn) (USDmn) (USDmn) (USDmn) (USDmn) (USDmn)
90 95 100 105 110 115 120 125
8/14 9/11 10/9 11/6
CPO WTI Coal
(D-3M=100) (D-3M=100)
90 95 100 105 110 115 120 125 130
8/14 9/11 10/9 11/6
(D-3M=100) Copper Nickel Tin
90 95 100 105 110 115 120
8/14 9/11 10/9 11/6
Silver Gold Platinum
(D-3M=100)
Table. Key valuation metrics
Company Name Ticker
Price Market Cap Price Performance (%) P/E(X)* P/B(X)* ROE(%)*
(IDR) (IDRbn) 1D 1W 1M 1Y FY17 FY18 FY17 FY18 FY17 FY18
Jakarta Composite Index JCI 6,022 6,689,293 -0.3 -0.3 1.6 15.1 17.8 15.8 2.6 2.4 18.4 12.8
FINANCIALS
Bank Central Asia BBCA 20,650 509,126 -0.7 -1.8 -0.1 40.7 22.1 19.7 3.9 3.4 19.0 18.4
Bank Mandiri Persero BMRI 7,050 329,000 -0.4 -2.8 4.1 30.0 15.2 12.3 1.9 1.7 12.8 14.2
Bank Rakyat Indonesia Persero BBRI 3,280 404,574 -0.3 2.5 6.8 37.0 16.3 14.4 2.8 2.5 18.2 18.3
Bank Negara Indonesia Persero BBNI 7,975 148,723 0.0 2.9 4.6 54.9 11.2 9.7 1.5 1.4 14.4 15.0
Bank Tabungan Negara Persero BBTN 2,910 30,817 1.4 1.0 -4.6 65.3 13.6 11.9 1.4 1.3 10.6 11.3
CONSUMER
HM Sampoerna HMSP 4,030 468,762 2.0 1.0 7.2 5.5 35.9 33.4 13.2 12.5 37.6 39.0
Gudang Garam GGRM 76,000 146,231 -1.6 3.3 18.4 18.5 19.7 17.6 3.4 3.1 17.8 18.1
Indofood CBP Sukses Makmur ICBP 8,525 99,418 0.3 -3.7 -3.4 -2.8 25.7 23.5 5.1 4.6 20.8 20.4
Indofood Sukses Makmur INDF 8,025 70,463 0.9 -2.4 -3.6 4.6 15.8 14.7 2.2 2.0 14.6 13.5
Kalbe Farma KLBF 1,600 75,000 0.0 -0.6 -5.9 4.2 30.3 27.3 5.6 5.1 19.1 18.4
Unilever Indonesia UNVR 49,175 375,205 -0.3 -1.4 -0.2 19.9 51.6 46.3 70.0 63.1 144.8 145.5
AGRICULTURAL
Astra Agro Lestari AALI 14,600 28,100 -0.7 0.3 -1.0 -7.2 13.6 13.9 1.5 1.4 11.5 10.6
PP London Sumatera Indonesia LSIP 1,555 10,610 -0.3 1.0 7.6 -0.6 13.3 12.9 1.3 1.2 9.9 9.8
Sawit Sumbermas Sarana SSMS 1,485 14,145 -1.7 -1.0 -0.3 1.4 22.3 14.1 3.6 3.0 16.2 21.5
INFRASTRUCTURE
XL Axiata EXCL 3,500 37,408 -0.6 -1.7 -0.8 45.8 121.9 34.5 1.7 1.6 1.4 4.0
Jasa Marga JSMR 6,500 47,176 -3.3 -0.4 7.0 43.2 22.2 20.6 3.0 2.7 14.0 13.7
Perusahaan Gas Negara PGAS 1,805 43,756 -1.6 1.4 10.1 -23.8 16.7 13.3 1.1 1.0 5.3 8.6
Tower Bersama Infrastructure TBIG 6,700 30,360 -1.1 -1.8 5.5 19.1 24.6 20.2 15.8 9.8 63.7 58.1
Telekomunikasi Indonesia TLKM 4,120 415,296 -1.0 0.7 -7.0 4.5 17.5 16.0 4.3 3.9 26.0 24.6
Soechi Lines SOCI 282 1,991 2.2 2.9 3.7 -31.2 3.0 2.6 #N/A N/A #N/A N/A 10.1 9.8
Garuda Indonesia GIAA 340 8,801 -1.2 -5.6 4.9 -1.2 17.0 12.4 2.1 1.9 12.1 14.7
BASIC-INDUSTRIES
Semen Indonesia SMGR 10,000 59,315 -1.0 -3.6 -7.8 13.0 20.7 17.3 2.0 1.8 9.2 10.5
Charoen Pokphand Indonesia CPIN 3,160 51,818 -1.9 -3.4 1.3 -0.9 20.7 16.2 3.2 2.8 15.2 17.1
Indocement Tunggal Prakarsa INTP 20,875 76,846 -4.5 -10.4 8.3 37.3 30.9 26.5 2.9 2.8 9.2 10.2
Japfa Comfeed Indonesia JPFA 1,285 14,663 0.8 -3.7 -4.8 -26.4 10.5 7.9 1.5 1.3 15.3 17.8
MINING
Indo Tambangraya Megah ITMG 21,500 24,293 1.7 -4.4 3.4 19.4 8.1 8.4 1.8 1.7 22.2 20.4
Adaro Energy ADRO 1,815 58,055 -0.8 -4.2 -4.5 9.3 8.9 8.9 1.2 1.2 14.1 12.6
Aneka Tambang ANTM 705 16,942 -0.7 5.2 9.3 -21.7 97.6 87.2 1.0 1.0 0.1 1.1
Vale Indonesia INCO 3,120 31,001 -1.9 1.3 4.0 -10.9 N/A 46.1 1.5 1.5 -0.4 2.5
Tambang Batubara Bukit Asam PTBA 11,875 27,362 0.6 2.8 7.2 -12.7 8.0 8.1 2.1 1.8 27.2 23.4
TRADE
United Tractors UNTR 32,725 122,069 -4.0 -7.3 -4.5 43.2 16.6 14.7 2.9 2.6 16.8 17.1
AKR Corporindo AKRA 7,300 29,246 -0.3 -3.6 1.0 11.9 25.3 22.5 3.8 3.4 15.1 15.8
Global Mediacom BMTR 590 8,377 -3.3 -1.7 10.3 -18.1 N/A N/A N/A N/A N/A N/A
Matahari Department Store LPPF 9,900 28,887 -1.0 -2.9 5.3 -37.5 14.4 13.2 10.8 8.5 90.8 77.0
Media Nusantara Citra MNCN 1,650 23,556 -0.3 9.6 11.9 -12.2 14.9 13.1 2.3 2.1 16.2 16.8
Matahari Putra Prima MPPA 595 3,200 0.0 -0.8 -7.8 -64.3 N/A 94.1 1.4 1.3 -3.0 0.7
Surya Citra Media SCMA 1,975 28,878 -0.3 1.3 -9.0 -16.0 18.1 16.0 7.4 6.5 42.4 42.5
Siloam International Hospital SILO 9,875 16,054 1.0 1.3 0.8 0.0 125.1 98.7 3.2 3.1 2.9 3.3
PROPERTY
Bumi Serpong Damai BSDE 1,690 32,527 -2.3 -4.5 -3.4 -11.5 11.6 11.6 1.4 1.2 12.2 11.0
Adhi Karya ADHI 2,220 7,905 -0.4 -1.8 7.2 3.7 14.7 10.0 1.3 1.2 8.7 11.9
Alam Sutera Realty ASRI 398 7,820 0.0 -1.5 2.1 -1.0 7.7 7.2 1.0 0.9 14.0 12.7
Ciputra Development CTRA 1,210 22,458 0.0 -0.8 4.3 -22.4 21.4 17.1 1.7 1.6 8.6 9.4
Lippo Karawaci LPKR 645 14,885 1.6 0.0 -11.6 -25.0 14.4 12.8 0.8 0.7 5.7 5.7
Pembangunan Perumahan PTPP 2,830 17,546 0.4 -1.7 4.0 -27.4 12.6 10.3 1.6 1.4 12.5 13.4
Pakuwon Jati PWON 620 29,859 -0.8 -2.4 3.3 -10.1 15.3 13.5 2.8 2.4 19.0 18.4
Summarecon Agung SMRA 985 14,210 -3.0 -3.0 -2.5 -28.4 45.0 30.0 2.1 1.9 5.0 6.5
Wijaya Karya WIKA 2,010 18,030 0.0 2.6 14.2 -22.1 14.6 11.9 1.4 1.3 10.0 11.2
Waskita Karya WSKT 2,180 29,591 1.9 1.4 16.9 -9.5 9.5 8.4 1.8 1.5 20.3 18.7
MISCELLANEOUS
Astra International ASII 8,350 338,038 0.9 3.1 -1.5 8.4 17.1 15.5 2.7 2.5 16.0 16.0
Source: Bloomberg, Mirae Asset Sekuritas Indonesia
*Note: Valuation metrics based on Bloomberg consensus estimates
Sector performance Top 10 market cap performance
Name Index Chg (%) Ticker Price Market Cap (IDRbn) Chg (%)
Agricultural 1,766.0 -0.5 INDY IJ 2790 14,536 3.33
Mining 1,609.3 -0.2 WSKT IJ 2180 29,591 1.87
Basic-Industry 667.6 -0.9 PLIN IJ 3860 13,703 1.8
Miscellaneous Industry 1,399.3 0.6 BSIM IJ 900 13,803 1.69
Consumer Goods 2,563.5 0.4 ITMG IJ 21500 24,293 1.65
Property & Construction 503.1 -0.4 LPKR IJ 645 14,885 1.6
Infrastructure 1,152.9 -0.9 BJTM IJ 695 10,407 1.46
Finance 1,049.5 -0.4 BFIN IJ 700 11,177 1.45
Trade 894.1 -1.2 HITS IJ 720 5,113 1.41
Composite 6,021.8 -0.3 BBTN IJ 2910 30,817 1.4
Source: Bloomberg
Top 5 leading movers Top 5 lagging movers
Name Chg (%) Close Name Chg (%) Close
HMSP IJ 2.0 4,030 UNTR IJ -4.0 32,725
ASII IJ 0.9 8,350 TLKM IJ -1.0 4,120
TPIA IJ 1.2 28,800 BBCA IJ -0.7 20,650
INDF IJ 0.9 8,025 INTP IJ -4.5 20,875
WSKT IJ 1.9 2,180 GGRM IJ -1.6 76,000
Source: Bloomberg
Economic Calendar
Time Currency Detail Forecast Previous
5:00am AUD RBA Assist Gov Debelle Speaks
6:50am JPY PPI y/y 3.1% 3.1%
7:01am GBP Rightmove HPI m/m 1.1%
7:10am USD FOMC Member Harker Speaks
1:00pm JPY Prelim Machine Tool Orders y/y 45.0%
2:00pm EUR German WPI m/m 0.4% 0.6%
All Day CAD Bank Holiday
Note: Time is based on Indonesian local time Source: Forex Factory
Disclaimers
This report is prepared strictly for private circulation only to clients of PT Mirae Asset Sekuritas Indonesia (MASI). It is purposed only to person having professional experience in matters relating to investments. The information contained in this report has been taken from sources which we deem reliable. No warranty (express or implied) is made to the accuracy or completeness of the information. All opinions and estimates included in this report constitute our judgments as of this date, without regards to its fairness, and are subject to change without notice. However, none of MASI and/or its affiliated companies and/or their respective employees and/or agents makes any representation or warranty (express or implied) or accepts any responsibility or liability as to, or in relation to, the accuracy or completeness of the information and opinions contained in this report or as to any information contained in this report or any other such information or opinions remaining unchanged after the issue thereof. We expressly disclaim any responsibility or liability (express or implied) of MASI, its affiliated companies and their respective employees and agents whatsoever and howsoever arising (including, without limitation for any claims, proceedings, action, suits, losses, expenses, damages or costs) which may be brought against or suffered by any person as a results of acting in reliance upon the whole or any part of the contents of this report and neither MASI, its affiliated companies or their respective employees or agents accepts liability for any errors, omissions or misstatements, negligent or otherwise, in the report and any liability in respect of the report or any inaccuracy therein or omission there from which might otherwise arise is hereby expresses disclaimed.
This document is not an offer to sell or a solicitation to buy any securities. This firms and its affiliates and their officers and employees may have a position, make markets, act as principal or engage in transaction in securities or related investments of any company mentioned herein, may perform services for or solicit business from any company mentioned herein, and may have acted upon or used any of the recommendations herein before they have been provided