Mimi Halimin +62-21-515-1140 [email protected] To subscribe to our Daily Focus, please contact us at [email protected]
Mirae Asset Sekuritas Indonesia
Monthly average live bird prices (West Java)
Source: Company data, Mirae Asset Sekuritas Indonesia Research
July 6, 2017
Poultry: Fighting the supply and demand imbalance
Setelah mengalami kinerja yang lemah di 1Q17, emiten poultry memiliki banyak harapan peningkatan kinerja di 2Q17. Ramadan, yang berlangsung dari akhir Mei sampai akhir Juni tahun ini, biasanya merupakan bulan dimana permintaan konsumsi daging ayam naik, sehingga memicu kenaikkan harga. Namun, inflasi bulan Juni tercatat lebih lemah dibanding pada bulan Idul Fitri tahun lalu, mengindikasikan kenaikan harga yang lebih lemah tahun ini. Walaupun data menunjukkan peningkatan harga live bird dan DOC pada bulan Mei-Juni (dibandingkan dengan Januari-April), namun harga tahun ini tidak sekuat tahun 2016.
Industri perunggasan masih berjuang untuk menyeimbangkan pasokan dan permintaan ayam, sebagaimana dibuktikan oleh kondisi kelebihan pasokan yang masih berlangsung. Namun, pemerintah secara positif telah menunjukkan respon yang lebih cepat dalam mengenali dan mengatasi oversupply. Tahun ini, tiga program culling telah dirilis. Pertama, pemerintah mengeluarkan Keputusan Menteri Pertanian Nomor 3035/kpts/PK010/F/03/2017 tentang pengurangan DOC FS broiler, DOC FS jantan layer, dan FS ayam layer. Program culling kedua (diumumkan dalam surat edaran tertanggal 23 Mei) menginstruksikan perusahaan unggas untuk mengurangi hatching eggs (tergantung pada ukuran masing-masing perusahaan) selama 5-10 Juni. Program culling ketiga yang masih berlangsung (21 Juni - 17 Juli) melalui Keputusan Menteri Pertanian Nomor 6073/kpts/PK.000/F/06/2017 tentang pengurangan populasi parent stock (PS) broiler menginstruksikan perusahaan-perusahaan unggas untuk secara bertahap mengurangi secara total 3mn PS broiler selama tiga minggu.
Kami mempertahankan pandangan Netral kami di sektor Poultry. Respons cepat pemerintah merupakan sumber sentimen positif, namun kami concern dengan daya beli di 2H17, yang mungkin kurang kuat dibandingkan dengan saat momentum Ramadan.
Market Index
Last Trade Chg (%) MoM YoY
JCI 5,825.1 -0.7 2.8 18.0
MSCI Indonesia 27.2 -0.8 0.9 12.8
MSCI EM 1,009.8 0.3 -0.9 22.9
HANG SENG 25,522.0 0.5 -2.3 23.9
KOSPI 2,388.4 0.1 0.8 22.3
FTSE 7,367.6 0.1 -2.2 13.8
DJIA 21,478.2 0.0 1.6 19.9
NASDAQ 6,150.9 0.7 -2.6 25.7
Valuation
2017F P/E (x) P/B (x) ROE (%)
JCI 16.7 2.5 18.5
Key Rates
Last Trade Chg (bps) MoM YoY
BI 7-Day RR 4.75 0 0 -50*
3yr 6.72 0 -1 -42
10yr 6.82 -5 -12 -55
*since introduced in Aug 2016
FX
Last Trade Chg (%) MoM YoY
USD/IDR 13,365.00 0.0 0.6 1.2
USD/KRW 1,150.45 0.0 2.9 -1.3
USD/JPY 113.26 0.0 3.5 11.8
USD/CNY 6.80 0.0 0.0 1.7
Commodities
Last Trade Chg (%) MoM YoY
WTI 45.1 -4.1 -6.6 -13.6
Gold 1,227.0 0.3 -5.2 -10.0
Coal 83.1 3.0 9.4 41.7
Palm Oil 2,670.0 -1.7 -5.4 7.8
Rubber 129.9 0.0 -3.8 -5.1
Nickel 9,160.0 -0.2 3.3 -8.3
Copper 5,841.0 -0.9 4.0 23.0
Tin 19,680.0 -1.4 -1.0 12.7
JCI Index VS MSCI Emerging Markets
650 800 950 1,100
3,500 4,500 5,500
05/13 05/14 05/15 05/16 05/17
JCI MSCI EM (pt)
(pt)
800 950 1,100
4,500 5,500
(pt) JCI MSCI EM (pt)
2
Mirae Asset Sekuritas Indonesia cartoon
Local flashes
MPOW: Bangun pembangkit, Megapower siapkan investasi hingga US$30 juta. PT Megapower Makmur Tbk (MPOW) mengaku, pihaknya saat ini tengah mengurus izin untuk dua proyek pembangkit listrik minihidro baru berkapasitas sekitar 5 MW-10 MW di Sulawesi Selatan. Hal itu disampaikan Direktur Utama Perseroan, Kang Jimmi, di Jakarta, Rabu. Untuk memuluskan kedua proyek tersebut, Kang Jimmi mengaku, perusahaan diproyeksikan bakal menyiapkan dana investasi sekitar US$15-30 juta.
Adapun sumber pendanaannya, akan berasal dari hasil pinjaman bank. (Iqplus)
BBNI: BNI membukukan pertumbuhan kredit 15% di kuartal II 2017. Penyaluran kredit PT Bank Negara Indonesia Tbk (BNI) melambat di kuartal II 2017. Bank BUMN ini mencatat pertumbuhan kredit sekitar 15% di kuartal II tahun 2017 atau lebih rendah dari pertumbuhan kredit sebesar 23,7% di kuartal II tahun 2016. Dengan asumsi perkiraan kredit tumbuh 15% maka penyaluran kredit BNI sekitar Rp 410,80 triliun di kuartal II tahun ini dari perhitungan realisasi kredit Rp 357,21 triliun di kuartal II tahun lalu. Direktur Utama BNI Achmad Baiquni mengaku, kendati pertumbuhan kredit kuartal II di tahun ini lebih rendah dibandingkan tahun lalu, namun BNI mencatat pertumbuhan kredit di atas rata-rata industri perbankan. (Kontan)
BKSW: QNB Indonesia rights issue Rp 2 triliun. PT Bank QNB Indonesia Tbk berencana menerbitkan saham baru dengan Hak Memesan Efek Terlebih Dahulu (HMETD) atau rights issue. Bank milik investor Qatar ini mengincar dana rights issue hingga Rp 2,05 triliun. Direktur Bank QNB Windiarto Tabingin dalam keterbukaan informasi kepada Bursa Efek Indonesia (BEI) menyatakan Bank QNB Indonesia berencana melepas saham sebanyak-banyaknya 8,23 miliar saham baru dengan nilai nominal Rp 250 per lembar saham. (Kontan)
KAEF: Pabrik alat kesehatan KAEF rampung Agustus. Demi memperkuat bisnis alat kesehatan, PT Kimia Farma (Persero) Tbk, membangun faslitas produksi Rapid Test.
Nantinya, fasilitas ini untuk memproduksi alat kesehatan test kit untuk melakukan pendeteksian penyakit seperti HIV, Siphilis, Malaria, Hepatitis, Dengue, Narkoba dan test kehamilan. Berdiri di atas lahan milik perseroan seluas 375 meter persegi (m2) di Denpasar Bali, perusahaan berkode saham KAEF ini berinvestasi 22 miliar. Proyek ini sudah dimulai dari 2016 lalu dan ditargetkan bangunan bisa selesai pada Agustus 2017.
(Kontan)
PWON: Rating utang Pakuwon naik jadi Ba2. Peringkat utang PT Pakuwon Jati Tbk (PWON) membaik. Moody's Investors Service menaikkan peringkat utang perusahaan properti ini dari sebelumnya Ba3 menjadi Ba2. Selain itu, Moody's juga meningkatkan peringkat senior unsecured debt Pakuwon Prima Pte Ltd dari Ba3 menjadi Ba2.
Pakuwon Prima merupakan anak usaha PWON. Moody's memberikan outlook stabil untuk surat utang tersebut. Moody's menyebut, peningkatan rating tersebut mencerminkan kemampuan PWON mencetak pertumbuhan berkelanjutan. (Kontan)
WIKA: Wijaya Karya suntik modal anak usaha Rp 43,42 miliar. PT Wijaya Karya Tbk (WIKA), melakukan peningkatan modal disetor kepada PT Wijaya Karya Industri &
Konstruksi (WIKA IKON). Besaran dana yang disuntik yakni Rp 43,42 miliar, terdiri dari setoran tunai Rp 25,62 miliar dan setoran in-kind berupa aset fabrikasi baja senilai Rp 17,8 miliar. WIKA merupakan pemegang saham mayoritas dari WIKA IKON dengan saham sebesar 96,5%. Tambahan modal tersebut, ditujukan untuk mendukung pertumbuhan WIKA IKON sesuai dengan rencana jangka panjang 2017-2021. (Kontan)
KBRI: Kertas Basuki Rachmat putuskan tidak bagi dividen. PT Kertas Basuki Racmat Tbk memutuskan tidak membagikan dividenkepada pemegang saham saat ini. Hal tersebut disampaikan oleh Direktur Independen PT Kertas Basuki Rachmat Tbk, Henry Priyantoro usai Rapat Umum Pemegang Saham (RUPS), Jakarta (5/7). (Kontan)
Technical analysis
4 Tasrul +62-21-515-1140 [email protected] Jakarta Composite Index (JCI) – Test support at 5,793
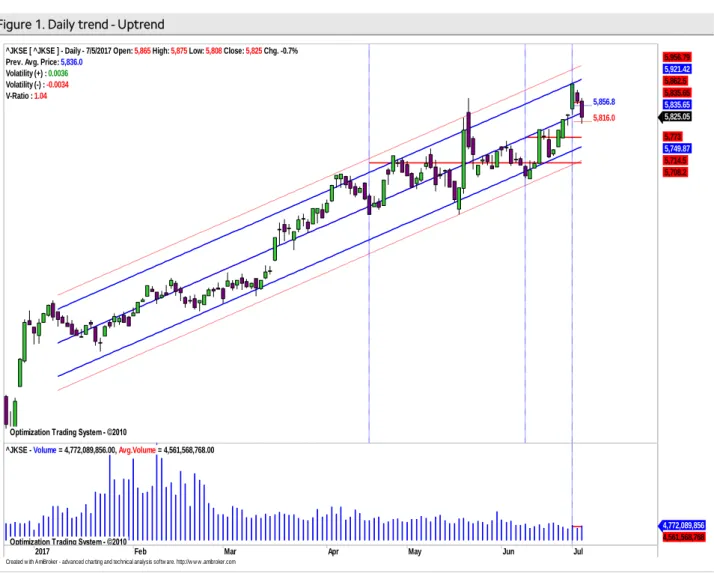
IHSG akan bertahan sekitar center line pada uptrend channel.
IHSG saat masih dalam pola uptrend jangka pendek relatif valid yang dimulai sejak 112 hari terakhir dengan r-squared = 0.9293 dan bergerak normal dalam rentang +/-1.81 std.deviasi dari centerline. Peluang IHSG bergerak di luar pergerakan normal sekitar 7,07%
atau sekitar 8 bar chart. Rata-rata volatilitas normal pergerakan IHSG saat ini sebesar +/- 0.46% atau sekitar +/- 26.5 point. sebagaimana terlihat pada Figure 1.
Summary
Item Data Item Data
Close (July 5, 2017) 5,825.1 (-0.7%) Trading range 5,793– 5,848 Average index performance (%) 6.39 Target
Period 112 - Daily 5,857
r-squared 0.9293 - Weekly 5,912
Volatility (+/-, %) 0.46 - Monthly 5,967 Volatility (+/-, point) 26.5 Stop loss 5,773 Source: Mirae Asset Sekuritas Indonesia Research
Figure 1. Daily trend - Uptrend
Source: Mirae Asset Sekuritas Indonesia Research
Aliran dana keluar mulai terbatas dan volatilitas pergerakkan indeks turun masih
Created w ith AmiBroker - advanced charting and technical analysis softw are. http://w w w .amibroker.com
_____ 5,856.8 _____ 5,816.0
Optimization Trading System - ©2010 Optimization Trading System - ©2010 Optimization Trading System - ©2010 Optimization Trading System - ©2010 Optimization Trading System - ©2010
^JKSE [ ^JKSE ] - Daily - 7/5/2017 Open: 5,865 High: 5,875 Low: 5,808 Close: 5,825 Chg. -0.7%
Prev. Avg. Price: 5,836.0 Volatility (+) : 0.0036 Volatility (-) : -0.0034 V-Ratio : 1.04
5,825.05 5,773 5,749.87 5,714.5 5,708.2 5,835.65 5,835.65 5,862.5 5,921.42 5,956.79
2017 Feb Mar Apr May Jun Jul
Optimization Trading System - ©2010
^JKSE - Volume = 4,772,089,856.00, Avg.Volume = 4,561,568,768.00
4,772,089,856 4,561,568,768
terlihat.
Pada Figure 2, terlihat dari hasil optimalisasi terakhir, indikator MFI optimized,indikator W%R optimized dan indikator RSI optimized masih cenderung turun untuk sementara dengan volume tembus rata-rata, dengan demikian potensi koreksi masih terlihat namun masih dalam kisaran wajar. Daily resistance di 5,857 dan daily support di 5,816 dan jika level ini tidak mampu dipertahankan koreksi diperkirakan berlanjut ke 5,793. Cut loss level di 5,773.
Figure 2. Daily MFI optimized ,W%R optimized & RSI optimized
Source: Mirae Asset Sekuritas Indonesia Research
Created w ith AmiBroker - advanced charting and technical analysis softw are. http://w w w .amibroker.com
^JKSE - MFI Smoothed = 37.01
37.0137
^JKSE - Will%R Smoothed = -29.94
-29.9416
^JKSE - RSI Smoothed = 58.65
58.6479
_____ 5,856.8 _____ 5,816.0
Optimization Trading System - ©2010 Optimization Trading System - ©2010 Optimization Trading System - ©2010
^JKSE [ ^JKSE ] - Daily - 7/5/2017 Open: 5,865 High: 5,875 Low: 5,808 Close: 5,825 Chg. -0.7%
Prev. Avg. Price: 5,836.0 Volatility (+) : 0.0036 Volatility (-) : -0.0034 V-Ratio : 1.04
5,825.05 5,773 5,708.2 5,862.5
27 Mar 6 13 20 27 Apr 10 17 25 May 8 15 22 29 Jun 12 19 Jul
Optimization Trading System - ©2010
^JKSE - Volume = 4,772,089,856.00, Avg.Volume = 4,561,568,768.00
4,772,089,856 4,561,568,768
6 IHSG untuk mampu naik lebih lanjut, harus mampu bertahan diatas level 5,847
Untuk mampu kembali bergerak naik, indeks ini harus mampu dipertahankan pada level 5,847.9. Pada Figure 3,4 dan 5 terlihat perkiraan normal trading range untuk masing- masing periode.
Figure 3. Daily : 5,816 – 5,857 Figure 4. Weekly : 5,793 – 5,912 Figure 5. Monthly : 5,728 – 5,967
x
Source: Mirae Asset Sekuritas Indonesia Research Source: Mirae Asset Sekuritas Indonesia Research Source: Mirae Asset Sekuritas Indonesia Research
Created w ith AmiBroker - advanced charting and technical analysis sof tw are. http://w w w .amibroker.com _____ 5,856.8
_____ 5,816.0 5,836.0
^JKSE [ ^JKSE ] - Daily - 7/5/2017 Open: 5,865 High: 5,875 Prev. Avg. Price: 5,836.0
Volatility (+) : 0.0036 Volatility (-) : -0.0034 V-Ratio : 1.04
5,825.05
Jun Jul
^JKSE - Volume = 4,772,089,856.00
4,772,089,856
Created w ith AmiBroker - advanced charting and technical analysis sof tw are. http://w w w .amibroker.com _____ 5,912.9
_____ 5,793.1 5,847.9
^JKSE [ ^JKSE ] - Weekly - 7/5/2017 Open: 5,847 High:
Prev. Avg. Price: 5,847.9 Volatility (+) : 0.0111 Volatility (-) : -0.0094 V-Ratio : 1.19
5,825.05
Apr Jul
^JKSE - Volume = 13,684,707,328.00
13,684,707,328
Created w ith AmiBroker - advanced charting and technical analysis sof tw are. http://w w w .amibroker.com _____ 6,086.9
_____ 5,608.3 5,847.9
5,728.1 5,967.4
^JKSE [ ^JKSE ] - Monthly - 7/5/2017 Open: 5,847 High:
Prev. Avg. Price: 5,847.9 Volatility (+) : 0.0409 Volatility (-) : -0.0410 V-Ratio : 1.00
5,825.05
AprJul Oct2017 Jul
^JKSE - Volume = 13,684,707,328.00
13,684,707,328
Stocks on our focus list
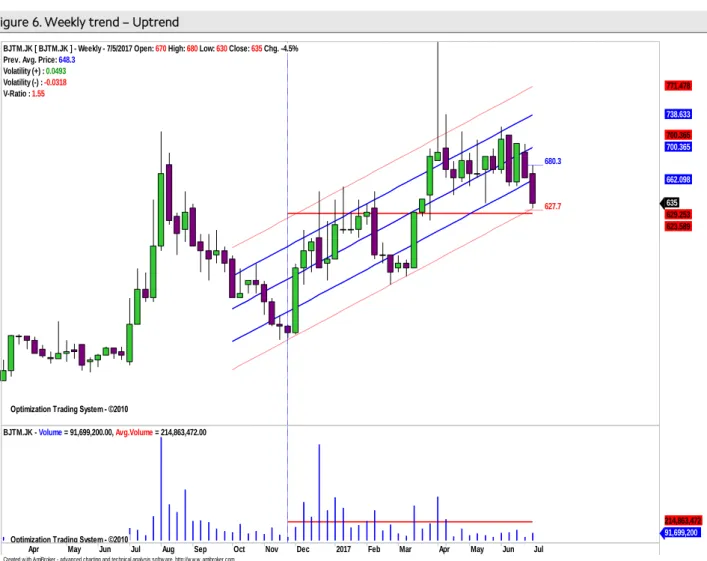
BPD Jawa Timur (BJTM)-Weekly, Buy on Weakness
Harga akan coba bertahan diatas abnormal lower band pada uptrend channel.
Secara umum harga saham ini masih bergerak pada uptrend channel yang masih relatif valid (r-squared = 0.748) selama 39 minggu terakhir yang bergerak normal dalam rentang +/- 1.15 std.deviasi dari center line. Peluang harga keluar dari pergerakan normal sekitar 25.22 % (sekitar 10 bar chart ). Rata-rata volatilitas normal pergerakkan harga saham ini sepanjang uptrend channel sebesar +/-5.15 % atau sekitar +/- 32.70 (potensi naik dan turun secara normal maksimum/minimum sebesar 30-35 rupiah) dari level penutupan terakhir sebagaimana terlihat pada Figure 6.
Summary
Item Data Item Data
Close (July 5, 2017) 635 (-4.5%) Trading range 620–680
Relative Avg. Price performance to JCI (%) 2.05 Target
β (beta) 1.49 - Daily 650
Corelation 0.85 - Weekly 680
Period 39 - Monthly 700
r-squared 0.748 Stop loss 610
Volatility (+/-, %) 5.15
Volatility (+/-, Rp.) 32.70
Source: Mirae Asset Sekuritas Indonesia Research
Figure 6. Weekly trend – Uptrend
Source: Mirae Asset Sekuritas Indonesia Research
Aliran dana keluar dan volatilitas harga turun mulai tertahan.
Created w ith AmiBroker - advanced charting and technical analysis softw are. http://w w w .amibroker.com
_____ 680.3
_____ 627.7
Optimization Trading System - ©2010 Optimization Trading System - ©2010 Optimization Trading System - ©2010
BJTM.JK [ BJTM.JK ] - Weekly - 7/5/2017 Open: 670 High: 680 Low: 630 Close: 635 Chg. -4.5%
Prev. Avg. Price: 648.3 Volatility (+) : 0.0493 Volatility (-) : -0.0318 V-Ratio : 1.55
635 629.253 623.589 662.098 700.365 700.365 738.633 771.478
24Apr May Jun Jul Aug Sep Oct Nov Dec 2017 Feb Mar Apr May Jun 22Jul
Optimization Trading System - ©2010
BJTM.JK - Volume = 91,699,200.00, Avg.Volume = 214,863,472.00
91,699,200 214,863,472
8 Pada Figure 7, terlihat dari hasil optimalisasi terakhir, indikator MFI Optimized , indikator W%R Optimized dan RSI Optimized masih cenderung turun namun mulai tertahan. Weekly resistance terdekat di 680 jika tembus daily resistance di 650. Daily dan weeklysupport di 620. Cut loss level di 610.
Figure 7. Weekly, MFI optimized,W%R optimized & RSI optimized
Source: Mirae Asset Sekuritas Indonesia Research
Created w ith AmiBroker - advanced charting and technical analysis softw are. http://w w w .amibroker.com BJTM.JK - MFI Smoothed = 22.88
22.8779
BJTM.JK - Will%R Smoothed = -73.92
-73.9153
BJTM.JK - RSI Smoothed = 32.54
32.5362
_____ 680.3 _____ 627.7
Optimization Trading System - ©2010 Optimization Trading System - ©2010 Optimization Trading System - ©2010
BJTM.JK [ BJTM.JK ] - Weekly - 7/5/2017 Open: 670 High: 680 Low: 630 Close: 635 Chg. -4.5%
Prev. Avg. Price: 648.3 Volatility (+) : 0.0493 Volatility (-) : -0.0318 V-Ratio : 1.55
635 623.589 610.811
2015 Apr Jul Oct 2016 Apr Jul Oct 2017 Apr Jul
Optimization Trading System - ©2010
BJTM.JK - Volume = 91,699,200.00, Avg.Volume = 214,863,472.00
91,699,200 214,863,472
Harga akan coba naik dan bertahan diatas rata-rata pada masing-masing periode.
Untuk mampu naik lebih lanjut, harga saham saat ini harus mampu minimal bertahan diatas rata-rata masing-masing periode (positive area) . Pada Figure 8,9 dan 10 terlihat perkiraan normal trading range untuk masing-masing periode.
Figure 8. Daily : 620 – 650 Figure 9. Weekly : 620 – 680 Figure 10. Monthly : 610 - 700
Source: Mirae Asset Sekuritas Indonesia Research Source: Mirae Asset Sekuritas Indonesia Research Source: Mirae Asset Sekuritas Indonesia Research
Created w ith AmiBroker - advanced charting and technical analysis sof tw are. http://w w w .amibroker.com _____ 654.7
_____ 630.5 641.7
624.0 648.0 BJTM.JK [ BJTM.JK ] - Daily - 7/5/2017 Open: 650 High:
Prev. Avg. Price: 641.7 Volatility (+) : 0.0204 Volatility (-) : -0.0174 V-Ratio : 1.17
635
Jun Jul
BJTM.JK - Volume = 32,365,600.00
32,365,600
Created w ith AmiBroker - advanced charting and technical analysis sof tw are. http://w w w .amibroker.com _____ 680.3
_____ 627.7 648.3 BJTM.JK [ BJTM.JK ] - Weekly - 7/5/2017 Open: 670 High:
Prev. Avg. Price: 648.3 Volatility (+) : 0.0493 Volatility (-) : -0.0318 V-Ratio : 1.55
635
Apr Jul
BJTM.JK - Volume = 91,699,200.00
91,699,200
Created w ith AmiBroker - advanced charting and technical analysis sof tw are. http://w w w .amibroker.com _____ 701.1
_____ 610.1 648.3 BJTM.JK [ BJTM.JK ] - Monthly - 7/5/2017 Open: 670 High:
Prev. Avg. Price: 648.3 Volatility (+) : 0.0814 Volatility (-) : -0.0589 V-Ratio : 1.38
635
AprJul Oct2017 Jul
BJTM.JK - Volume = 91,699,200.00
91,699,200
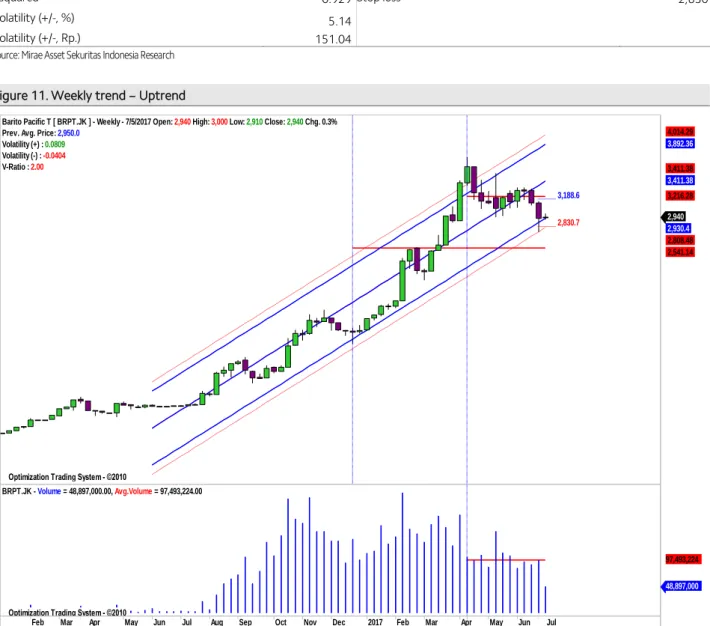
10 Barito Pacific (BRPT)-Weekly, Buy on Weakness
Harga akan coba bertahan diatas normal lower band pada uptrend channel . Secara umum harga saham ini juga masih bergerak dalam pola uptrend channel yang masih relatif valid (r-squared = 0,929) selama 56 minggu terakhir dan bergerak normal dalam rentang +/- 1.81 std.deviasi dari center line. Peluang harga keluar dari pergerakan normal sekitar 7.08 % (sekitar 4 bar chart ). Volatilitas normal pergerakan harga saham ini sepanjang uptrend channel sebesar +/- 5.14% atau sekitar +/- 151.04 (potensi naik dan turun secara normal maksimum/minimum sebesar 150 rupiah) dari level penutupan terakhir sebagaimana terlihat pada Figure 11.
Summary
Item Data Item Data
Close (July 5, 2017) 2,940 (+0.3%) Trading range 2,830–3,190 Relative Avg. Price performance to JCI (%) 23.20 Target
β (beta) 0.04 - Daily 3,020
Corelation 0.91 - Weekly 3,190
Period 56 - Monthly 3,580
r-squared 0.929 Stop loss 2,830
Volatility (+/-, %) 5.14
Volatility (+/-, Rp.) 151.04
Source: Mirae Asset Sekuritas Indonesia Research
Figure 11. Weekly trend – Uptrend
Source: Mirae Asset Sekuritas Indonesia Research
Created w ith AmiBroker - advanced charting and technical analysis softw are. http://w w w .amibroker.com
_____ 3,188.6
_____ 2,830.7
Optimization Trading System - ©2010 Optimization Trading System - ©2010 Optimization Trading System - ©2010 Optimization Trading System - ©2010
Barito Pacific T [ BRPT.JK ] - Weekly - 7/5/2017 Open: 2,940 High: 3,000 Low: 2,910 Close: 2,940 Chg. 0.3%
Prev. Avg. Price: 2,950.0 Volatility (+) : 0.0809 Volatility (-) : -0.0404 V-Ratio : 2.00
2,940 2,930.4 2,808.48 2,541.14 3,216.28 3,411.38 3,411.38 3,892.36 4,014.29
Feb Mar 24Apr May Jun Jul Aug Sep Oct Nov Dec 2017 Feb Mar Apr May Jun 22Jul
Optimization Trading System - ©2010
BRPT.JK - Volume = 48,897,000.00, Avg.Volume = 97,493,224.00
48,897,000 97,493,224
Aliran dana masuk mulai terlihatdan volatilitas harga turun mulai terbatas.
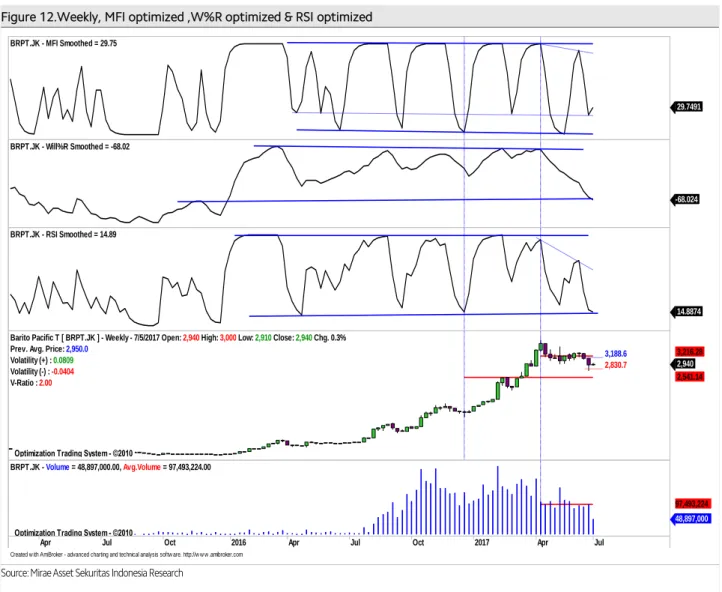
Pada Figure 12, terlihat dari hasil optimalisasi indikator MFI optimized cenderung naik, sementara itu koreksi indikator W%R Optimized dan RSI Optimized mulai terbatas.Weekly resistance di 3,190 dengan catatan level 3,020 sebagai daily resistance dapat ditembus. Weekly support saat ini di 2,830 yang sekaligus sebagai cut loss level.
Figure 12.Weekly, MFI optimized ,W%R optimized & RSI optimized
Source: Mirae Asset Sekuritas Indonesia Research
Created w ith AmiBroker - advanced charting and technical analysis softw are. http://w w w .amibroker.com BRPT.JK - MFI Smoothed = 29.75
29.7491
BRPT.JK - Will%R Smoothed = -68.02
-68.024
BRPT.JK - RSI Smoothed = 14.89
14.8874
_____ 3,188.6 _____ 2,830.7
Optimization Trading System - ©2010 Optimization Trading System - ©2010 Optimization Trading System - ©2010
Barito Pacific T [ BRPT.JK ] - Weekly - 7/5/2017 Open: 2,940 High: 3,000 Low: 2,910 Close: 2,940 Chg. 0.3%
Prev. Avg. Price: 2,950.0 Volatility (+) : 0.0809 Volatility (-) : -0.0404 V-Ratio : 2.00
2,940 2,541.14 3,216.28
Apr Jul Oct 2016 Apr Jul Oct 2017 Apr Jul
Optimization Trading System - ©2010
BRPT.JK - Volume = 48,897,000.00, Avg.Volume = 97,493,224.00
48,897,000 97,493,224
12 Harga saat ini akan coba naik dan bertahan diatas rata-rata pada masing-masing periode.
Untuk mampu naik lebih lanjut, harga saham saat ini harus mampu minimal bertahan diatas rata-rata masing-masing periode (positive area) . Pada Figure 13,14 dan 15 terlihat perkiraan normal trading range untuk masing-masing periode.
Figure 13. Daily : 2,890– 3,020 Figure 14. Weekly : 2,830 – 3,190 Figure 15. Monthly : 2,690 – 3,580 x
Source: Mirae Asset Sekuritas Indonesia Research Source: Mirae Asset Sekuritas Indonesia Research Source: Mirae Asset Sekuritas Indonesia Research
Created w ith AmiBroker - advanced charting and technical analysis sof tw are. http://w w w .amibroker.com _____ 3,022.5
_____ 2,889.3 2,946.7 Barito Pacific T [ BRPT.JK ] - Daily - 7/5/2017 Open: 2,980 Prev. Avg. Price: 2,946.7
Volatility (+) : 0.0257 Volatility (-) : -0.0195 V-Ratio : 1.32
2,940
Jun Jul
BRPT.JK - Volume = 15,327,600.00
15,327,600
Created w ith AmiBroker - advanced charting and technical analysis sof tw are. http://w w w .amibroker.com _____ 3,188.6
_____ 2,830.7 2,950.0 Barito Pacific T [ BRPT.JK ] - Weekly - 7/5/2017 Open:
Prev. Avg. Price: 2,950.0 Volatility (+) : 0.0809 Volatility (-) : -0.0404 V-Ratio : 2.00
2,940
Apr Jul
BRPT.JK - Volume = 48,897,000.00
48,897,000
Created w ith AmiBroker - advanced charting and technical analysis sof tw are. http://w w w .amibroker.com _____ 3,575.4
_____ 2,688.6 2,950.0 Barito Pacific T [ BRPT.JK ] - Monthly - 7/5/2017 Open:
Prev. Avg. Price: 2,950.0 Volatility (+) : 0.2120 Volatility (-) : -0.0886 V-Ratio : 2.39
2,940
AprJul Oct2017 Jul
BRPT.JK - Volume = 48,897,000.00
48,897,000
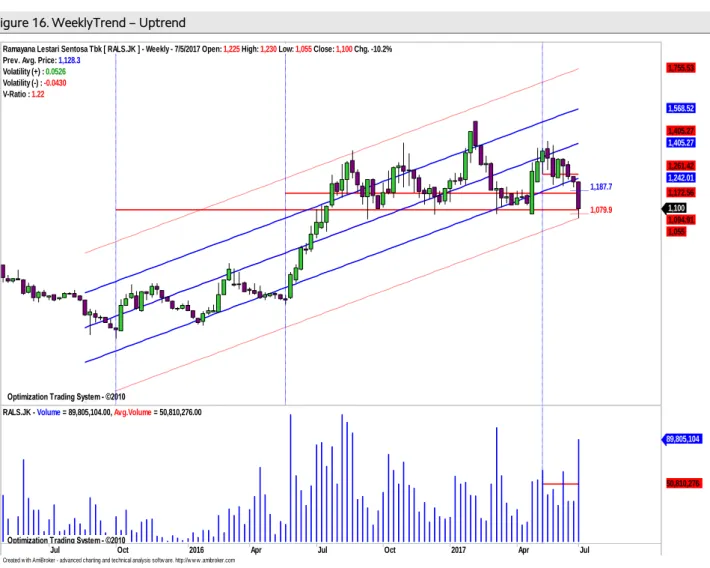
Ramayana Lestari Sentosa (RALS)-Weekly,Buy on Weakness Harga akan coba naik mendekati normallower band pada uptrend channel.
Secara umum harga saham akan coba naik dan bertahan diatas normal lower band pada uptrend channel yang masih relatif valid dengan r-squared = 0.797 selama 97 minggu terakhir dan bergerak normal dalam rentang +/-1.27 std.deviasi dari centerline.
Peluang harga keluar dari pergerakan normalnya sekitar 10.52 % (sekitar 8 bar chart ).
Volatilitas normal pergerakan harga saham ini sepanjang uptrend channel sebesar +/- 20.26 atau sekitar +/- 19.65 (potensi naik dan turun secara normal maksimum/minimum sebesar 65 rupiah) dari level penutupan terakhir sebagaimana terlihat pada Figure 16.
Summary
Item Data Item Data
Close (July 5, 2017) 1,100 (-10.2%) Normal trading range 1,080–1,190 Relative Avg. Price performance to JCI (%) (10.99) Target
β (beta) 0.96 - Daily 1,120
Corelation 0.08 - Weekly 1,190
Period 97 - Monthly 1,260
r-squared 0.797 Stop loss 1,080
Volatility (+/-, %) 5.81
Volatility (+/-, Rp.) 63.94
Source: Mirae Asset Sekuritas Indonesia Research
Figure 16. WeeklyTrend – Uptrend
Source: Mirae Asset Sekuritas Indonesia Research
Aliran dana keluar dan volatilitas harga turun mulai tertahan.
Created w ith AmiBroker - advanced charting and technical analysis softw are. http://w w w .amibroker.com
_____ 1,187.7 _____ 1,079.9
Optimization Trading System - ©2010 Optimization Trading System - ©2010 Optimization Trading System - ©2010 Optimization Trading System - ©2010 Optimization Trading System - ©2010
Ramayana Lestari Sentosa Tbk [ RALS.JK ] - Weekly - 7/5/2017 Open: 1,225 High: 1,230 Low: 1,055 Close: 1,100 Chg. -10.2%
Prev. Avg. Price: 1,128.3 Volatility (+) : 0.0526 Volatility (-) : -0.0430 V-Ratio : 1.22
1,100 1,094.91 1,055 1,172.56 1,242.01 1,261.42 1,405.27 1,405.27 1,568.52 1,755.53
Jul Oct 2016 Apr Jul Oct 2017 Apr Jul
Optimization Trading System - ©2010
RALS.JK - Volume = 89,805,104.00, Avg.Volume = 50,810,276.00
89,805,104
50,810,276
14
Pada Figure 17, terlihat dari hasil optimalisasi, indikator MFI Optimized ,W%R Optimized dan RSI Optimized saat ini sudah berada sekitar support trendline dengan volume tembus rata-rata. Dengan demikian diperkirakan potensi koreksi sudah mulai terbatas.
Perkiraan daily resistance di 1,120 sebelum weekly resistance ke 1,190 .Weeklysupport dan daily support di 1,080 yang sekaligus sebagai cut loss level.
Figure 17. Weekly MFI Optimized , W%R Optimized & RSI Optimized
Source: Mirae Asset Sekuritas Indonesia Research
Created w ith AmiBroker - advanced charting and technical analysis softw are. http://w w w .amibroker.com RALS.JK - MFI Smoothed = 3.29
3.28824 RALS.JK - Will%R Smoothed = -85.24
-85.2381 RALS.JK - RSI Smoothed = 14.92
14.9165
_____ 1,187.7 _____ 1,079.9
Optimization Trading System - ©2010 Optimization Trading System - ©2010 Optimization Trading System - ©2010
Ramayana Lestari Sentosa Tbk [ RALS.JK ] - Weekly - 7/5/2017 Open: 1,225 High: 1,230 Low: 1,055 Close: 1,100 Chg. -10.2%
Prev. Avg. Price: 1,128.3 Volatility (+) : 0.0526 Volatility (-) : -0.0430 V-Ratio : 1.22
1,100 1,094.91 1,172.56 1,261.42
2015 Apr Jul Oct 2016 Apr Jul Oct 2017 Apr Jul
Optimization Trading System - ©2010
RALS.JK - Volume = 89,805,104.00, Avg.Volume = 50,810,276.00
89,805,104 50,810,276
Harga akan coba naik dan bertahan diatas rata-ratapada masing-masing periode.
Untuk mampu naik lebih lanjut, harga saham saat ini harus mampu minimal bertahan diatas rata-rata masing-masing periode (positive area) . Pada Figure 18,19 dan 20 terlihat perkiraan normal trading range untuk masing-masing periode.
Figure 18. Daily : 1,080 – 1,120 Figure 19. Weekly : 1,080 – 1,190 Figure 20. Monthly : 1,030 – 1,260
Source: Mirae Asset Sekuritas Indonesia Research Source: Mirae Asset Sekuritas Indonesia Research Source: Mirae Asset Sekuritas Indonesia Research
analyzed by : Tasrul, [email protected], +62-21- 5151140
Relative Avg.Price Performance to JCI (%) : Persentase kenaikan harga saham dari rata-rata sejak IHSG memulai uptrend-nya β (beta) : Indikator sensitivitas harga saham terhadap IHSG, beta diatas 1 berarti harga makin sensitif terhadap pergerakan IHSG dan sebaliknya
Correlation : Ukuran kuat hubungan (korelasi) pergerakan harga saham dibanding dengan pergerakan IHSG
Period : Periode uptrend / downtrend yang valid dari pergerakan harga saham
r-squared : Koefisien determinasi, menunjukkan persentase gerakan yang dapat dijelaskan dengan regresi linier.Nilai R2 terletak antara 0 – 1, dan kecocokan model dikatakan lebih baik kalau R2 semakin mendekati 1 (validitas uptrend atau downtrend makin valid) Volatility (+/-%) : Besaran volatilitas normal maksimal/minimal dari pergerakan harga harian selama harga saham bergerak normal pada trend channel dalam persentase.
Volatility (+/- point or Rp) : Besaran volatilitas normal maksimal/minimal dari pergerakan harga harian selama Harga saham bergerak
Buy : Beli, harga sudah menyentuh atau jatuh di bawah support dan indikator teknikal berada di oversold area.
Sell : Jual, harga sudah menyentuh atau tembus resistance normal dan indikator berada di overbought area.
BoW : Buy on Weakness, beli ketika harga sudah melemah, dimana volume tekanan jual mulai berkurang dan harga mendekatisupport, serta indikator teknikal sudah berada di oversold area.
SoS : Sell on Strength, jual ketika kenaikan harga sudah mulai terbatas dimana volume beli mulai berkurang dan harga mendekati resistance, serta indikator teknikal sudah berada di overbought area.
Trading Buy : Beli dan jual kembali secepatnya jika harga sudah mencapai level resistance terdekat, karena kenaikan harga relatif tidak stabil atau hanya sementara.
Trading Sell : Jual dan beli kembali secepatnya jika harga sudah mencapai level support terdekat karena koreksi harga relative tidak stabil atau hanya sementara.
Created w ith AmiBroker - advanced charting and technical analysis sof tw are. http://w w w .amibroker.com _____ 1,120.7
_____ 1,076.6 1,098.3 1,122.4
1,078.2 Ramayana Lestari Sentosa Tbk [ RALS.JK ] - Daily - Prev. Avg. Price: 1,098.3
Volatility (+) : 0.0204 Volatility (-) : -0.0198 V-Ratio : 1.03
1,100
Jun Jul
RALS.JK - Volume = 27,215,500.00
27,215,500
Created w ith AmiBroker - advanced charting and technical analysis sof tw are. http://w w w .amibroker.com _____ 1,187.7
_____ 1,079.9 1,128.3 Ramayana Lestari Sentosa Tbk [ RALS.JK ] - Weekly Prev. Avg. Price: 1,128.3
Volatility (+) : 0.0526 Volatility (-) : -0.0430 V-Ratio : 1.22
1,100
Apr Jul
RALS.JK - Volume = 89,805,104.00
89,805,104
Created w ith AmiBroker - advanced charting and technical analysis sof tw are. http://w w w .amibroker.com _____ 1,259.6
_____ 1,033.5 1,128.3 Ramayana Lestari Sentosa Tbk [ RALS.JK ] - Monthly Prev. Avg. Price: 1,128.3
Volatility (+) : 0.1163 Volatility (-) : -0.0841 V-Ratio : 1.38
1,100
AprJul Oct2017 Jul
RALS.JK - Volume = 89,805,104.00
89,805,104
16
Chart 21. JCI Vs. USD/IDR Chart 22. JCI performance (absolute vs. relative)
Source: Bloomberg, Mirae Asset Sekuritas Indonesia Note: Relative to MSCI EM Index
Source: Bloomberg, Mirae Asset Sekuritas Indonesia
Chart 23. Foreigner’s net purchase (EM) Chart 24. Energy price
Note: The latest figure for India are July 4th, 2017
Source: Bloomberg, Mirae Asset Sekuritas Indonesia Source: Bloomberg, Mirae Asset Sekuritas Indonesia
Chart 25. Non-ferrous metal price Chart 26. Precious metal price
Source: Bloomberg, Mirae Asset Sekuritas Indonesia Source: Bloomberg, Mirae Asset Sekuritas Indonesia 13,200
13,300 13,400 13,500 13,600 13,700 13,800
5,400 5,500 5,600 5,700 5,800 5,900 6,000
4/5 5/3 5/31 6/28
(IDR)
(pt) JCI (L) USD/IDR (R)
-0.7
0.6 2.1
17.2
-1.0
1.0
2.6
-6.1 -8
-4 0 4 8 12 16 20
1D 1W 1M 1Y
Absolute Relative (%, %p)
(%, %p) (%, %p)
0
-80 -22
-1 -8
-179
-98 -83
-210 70
10
-262 -300
-250 -200 -150 -100 -50 0 50 100
Korea Taiwan Indonesia Thailand Philippines India
1 Day 5 Days
(USDmn) (USDmn) (USDmn) (USDmn)
75 80 85 90 95 100 105 110
4/5 5/3 5/31 6/28
CPO WTI Coal
(D-3M=100) (D-3M=100)
80 85 90 95 100 105
4/5 5/3 5/31 6/28
(D-3M=100) Copper Nickel Tin
85 90 95 100 105
4/5 5/3 5/31 6/28
Silver Gold Platinum
(D-3M=100)
Table. Key valuation metrics
Company Name Ticker
Price Market Cap Price Performance (%) P/E(X)* P/B(X)* ROE(%)*
(IDR) (IDRbn) 1D 1W 1M 1Y FY16 FY17 FY16 FY17 FY16 FY17
Jakarta Composite Index JCI 5,825 6,426,145 -0.7 0.6 1.3 17.2 16.7 14.5 2.5 2.3 18.5 20.4
FINANCIALS
Bank Central Asia BBCA 18,350 452,419 -1.1 1.4 3.5 38.8 18.5 19.8 3.4 3.5 20.4 18.7
Bank Mandiri Persero BMRI 13,325 310,917 -1.3 6.4 5.1 41.8 19.6 15.8 1.8 1.9 10.3 12.4
Bank Rakyat Indonesia Persero BBRI 15,200 374,971 -0.7 1.5 1.2 41.4 10.9 13.4 1.9 2.3 20.2 18.1
Bank Negara Indonesia Persero BBNI 6,650 124,014 1.1 -0.7 2.7 29.1 9.1 9.4 1.2 1.3 13.9 14.3
Bank Tabungan Negara Persero BBTN 2,600 27,534 -1.5 -2.3 5.3 53.8 13.3 11.9 1.0 1.2 7.6 10.3
CONSUMER
HM Sampoerna HMSP 3,790 440,846 -0.5 -1.3 -1.6 2.7 34.8 32.5 13.0 12.3 38.6 38.4
Gudang Garam GGRM 75,800 145,846 -3.4 -4.5 2.0 11.1 18.4 19.6 3.1 3.3 17.3 17.8
Indofood CBP Sukses Makmur ICBP 8,675 101,167 -1.4 -1.1 -1.4 2.4 27.8 25.6 5.7 5.1 21.8 21.4
Indofood Sukses Makmur INDF 8,750 76,829 0.0 2.9 -1.4 24.6 18.3 17.1 2.4 2.4 14.7 15.1
Kalbe Farma KLBF 1,640 76,875 -0.9 2.2 5.5 8.3 30.9 30.3 6.0 5.8 20.6 19.9
Unilever Indonesia UNVR 48,500 370,055 -0.5 0.5 2.8 10.7 46.3 50.6 62.9 67.0 134.1 142.1
AGRICULTURAL
Astra Agro Lestari AALI 15,200 29,255 2.0 5.7 5.4 5.2 14.8 14.5 1.9 1.7 14.1 11.3
PP London Sumatera Indonesia LSIP 1,390 9,484 0.4 0.7 -6.4 1.1 20.0 11.6 1.6 1.2 7.9 10.0
Sawit Sumbermas Sarana SSMS 1,645 15,669 0.0 3.1 -5.5 -13.4 22.5 24.7 3.9 4.0 18.3 16.2
INFRASTRUCTURE
XL Axiata EXCL 3,250 34,736 -1.2 0.3 1.2 -10.0 60.8 91.8 1.2 1.6 2.1 1.3
Jasa Marga JSMR 5,400 39,193 -1.4 0.9 5.9 5.1 15.6 20.8 2.3 2.7 15.7 13.4
Perusahaan Gas Negara PGAS 2,340 56,725 0.4 1.7 -3.7 0.0 15.3 10.9 1.5 1.3 9.8 12.5
Tower Bersama Infrastructure TBIG 6,650 30,134 -9.5 -3.3 11.3 0.8 17.4 24.4 14.3 12.2 83.6 57.0
Telekomunikasi Indonesia TLKM 4,580 461,664 -0.2 2.0 5.5 15.9 20.3 19.7 4.7 4.8 24.3 24.4
Soechi Lines SOCI 292 2,061 -2.0 -5.2 -5.8 -30.5 8.2 4.4 0.6 N/A 7.4 10.1
Garuda Indonesia GIAA 350 9,060 0.0 1.2 -0.6 -24.9 31.7 18.9 2.6 2.3 8.6 12.9
BASIC-INDUSTRIES
Semen Indonesia SMGR 9,950 59,019 -2.0 -2.5 7.0 7.6 12.0 16.7 1.9 1.9 16.3 11.8
Charoen Pokphand Indonesia CPIN 3,280 53,785 -0.9 4.5 5.5 -12.1 22.6 19.5 3.6 3.3 16.5 18.5
Indocement Tunggal Prakarsa INTP 18,625 68,563 -1.5 -0.3 -0.4 13.4 14.6 21.7 2.2 2.5 15.5 10.9
Japfa Comfeed Indonesia JPFA 1,390 15,861 1.5 4.5 12.6 24.7 7.7 9.0 1.9 1.6 28.6 19.0
MINING
Indo Tambangraya Megah ITMG 17,650 19,943 0.0 0.6 12.1 88.3 10.4 7.2 1.5 1.5 15.0 20.8
Adaro Energy ADRO 1,620 51,817 2.5 -1.2 4.9 83.1 12.0 10.1 1.3 1.1 11.1 11.7
Aneka Tambang ANTM 700 16,822 -0.7 -1.4 -3.4 -2.1 298.3 61.0 1.2 0.9 0.4 2.5
Vale Indonesia INCO 1,885 18,730 1.6 -0.5 1.1 3.9 N/A 70.4 1.1 0.7 0.1 1.1
Tambang Batubara Bukit Asam PTBA 12,100 27,880 -2.4 2.1 11.8 53.2 13.1 8.9 2.5 2.1 20.5 25.5
TRADE
United Tractors UNTR 27,825 103,791 -2.4 3.1 4.8 88.0 15.8 15.4 1.9 2.3 12.7 15.6
AKR Corporindo AKRA 6,275 25,101 -0.4 -3.5 -6.0 -2.3 23.5 21.6 3.5 3.3 15.7 15.6
Global Mediacom BMTR 565 8,022 -0.9 -8.9 -11.0 -43.5 41.8 N/A 0.9 N/A 2.0 N/A
Matahari Department Store LPPF 13,300 38,808 -3.6 -8.6 -10.1 -32.7 21.9 17.6 23.8 12.9 136.4 85.4
Media Nusantara Citra MNCN 1,750 24,983 1.7 -6.7 -6.9 -21.2 17.7 14.4 2.7 2.3 15.4 16.7
Matahari Putra Prima MPPA 685 3,684 1.5 -8.1 -11.0 -54.6 211.4 30.9 3.3 1.5 1.6 2.8
Surya Citra Media SCMA 2,350 34,361 -7.5 -12.0 -12.3 -27.0 27.2 19.3 11.9 8.4 45.7 46.4
Siloam International Hospital SILO 11,125 14,469 0.2 -1.8 -3.1 -1.3 150.3 105.7 4.5 4.5 3.5 4.2
PROPERTY
Bumi Serpong Damai BSDE 1,845 35,510 -2.1 1.7 1.9 -11.7 18.8 14.5 1.6 1.5 9.1 10.8
Adhi Karya ADHI 2,180 7,763 0.5 0.0 -4.4 -20.1 23.6 12.9 1.4 1.3 5.9 9.9
Alam Sutera Realty ASRI 320 6,288 0.6 0.6 -1.2 -32.8 13.6 7.6 1.0 0.8 7.5 11.2
Ciputra Development CTRA 1,195 22,180 1.3 2.6 2.1 -15.3 19.9 18.5 2.2 1.7 9.8 10.3
Lippo Karawaci LPKR 695 16,039 0.0 8.6 1.5 -39.6 18.6 15.2 0.9 0.8 5.0 5.3
Pembangunan Perumahan PTPP 3,330 20,646 -0.9 4.1 7.1 -8.0 23.1 15.1 2.4 1.9 14.4 12.8
Pakuwon Jati PWON 630 30,341 -2.3 4.1 -0.8 4.1 16.3 15.5 3.1 2.8 21.0 19.3
Summarecon Agung SMRA 1,270 18,322 -1.6 -1.6 -4.9 -29.8 61.3 44.4 3.1 2.6 5.1 6.4
Wijaya Karya WIKA 2,220 19,913 -1.3 0.0 -1.3 -16.8 14.4 15.5 1.8 1.6 12.9 10.0
Waskita Karya WSKT 2,270 30,813 -2.6 -1.7 -2.2 -9.2 17.3 12.6 3.1 2.0 16.6 17.5
MISCELLANEOUS
Astra International ASII 8,800 356,255 0.3 -1.7 -2.2 18.9 22.1 18.1 3.0 2.9 14.2 16.6
Source: Bloomberg, Mirae Asset Sekuritas Indonesia
*Note: Valuation metrics based on Bloomberg consensus estimates
18
Sector performance Top 10 market cap performance
Name Index Chg (%) Ticker Price Market Cap (IDRbn) Chg (%)
Agricultural 1,802.8 0.1 SMCB IJ 810 6,207 4.52
Mining 1,409.2 -0.6 AUTO IJ 2680 12,917 4.28
Basic-Industry 623.7 -0.3 MAYA IJ 3420 16,824 3.64
Miscellaneous Industry 1,484.7 0.3 AMRT IJ 585 24,292 2.63
Consumer Goods 2,519.4 -1.0 ADRO IJ 1620 51,817 2.5
Property & Construction 498.9 -0.5 PNBN IJ 1065 25,653 2.40
Infrastructure 1,183.9 -0.8 RALS IJ 1100 7,806 2.33
Finance 958.2 -0.6 RMBA IJ 466 16,963 2.19
Trade 903.0 -1.3 AALI IJ 15200 29,255 2.0
Composite 5,825.1 -0.7 TSPC IJ 1960 8,820 1.82
Source: Bloomberg
Top 5 leading movers Top 5 lagging movers
Name Chg (%) Close Name Chg (%) Close
BBNI IJ 1.1 6,650 GGRM IJ -3.4 75,800
ADRO IJ 2.5 1,620 BBCA IJ -1.1 18,350
ASII IJ 0.3 8,800 BMRI IJ -1.3 13,325
TOPS IJ 24.5 660 TBIG IJ -9.5 6,650
KMTR IJ 24.4 555 SCMA IJ -7.5 2,350
Source: Bloomberg
Economic Calendar
Time Currency Detail Forecast Previous
1:00am USD FOMC Meeting Minutes
8:30am AUD Trade Balance 1.00B 0.56B
10:45am JPY 30-y Bond Auction 0.82|3.6
1:00pm EUR German Factory Orders m/m 1.9% -2.1%
2:15pm CHF CPI m/m 0.0% 0.2%
3:10pm EUR Retail PMI 52.0
3:30pm GBP Housing Equity Withdrawal q/q -7.4B -10.2B
Tentative EUR French 10-y Bond Auction 0.72|1.8
Tentative GBP 10-y Bond Auction 1.14|2.1
6:30pm EUR ECB Monetary Policy Meeting Accounts
6:30pm USD Challenger Job Cuts y/y 9.7%
7:15pm USD ADP Non-Farm Employment Change 184K 253K
7:30pm CAD Trade Balance -0.5B -0.4B
7:30pm CAD Building Permits m/m 2.5% -0.2%
7:30pm USD Unemployment Claims 243K 244K
7:30pm USD Trade Balance -46.3B -47.6B
8:45pm USD Final Services PMI 53.0 53.0
9:00pm USD ISM Non-Manufacturing PMI 56.5 56.9
9:00pm USD FOMC Member Powell Speaks
10:00pm USD Crude Oil Inventories -2.4M 0.1M
Note: Time is based on Indonesian local time Source: Forex Factory
Disclaimers
This report is prepared strictly for private circulation only to clients of PT Mirae Asset Sekuritas Indonesia (MASI). It is purposed only to person having professional experience in matters relating to investments. The information contained in this report has been taken from sources which we deem reliable. No warranty (express or implied) is made to the accuracy or completeness of the information. All opinions and estimates included in this report constitute our judgments as of this date, without regards to its fairness, and are subject to change without notice. However, none of MASI and/or its affiliated companies and/or their respective employees and/or agents makes any representation or warranty (express or implied) or accepts any responsibility or liability as to, or in relation to, the accuracy or completeness of the information and opinions contained in this report or as to any information contained in this report or any other such information or opinions remaining unchanged after the issue thereof. We expressly disclaim any responsibility or liability (express or implied) of MASI, its affiliated companies and their respective employees and agents whatsoever and howsoever arising (including, without limitation for any claims, proceedings, action, suits, losses, expenses, damages or costs) which may be brought against or suffered by any person as a results of acting in reliance upon the whole or any part of the contents of this report and neither MASI, its affiliated companies or their respective employees or agents accepts liability for any errors, omissions or misstatements, negligent or otherwise, in the report and any liability in respect of the report or any inaccuracy therein or omission there from which might otherwise arise is hereby expresses disclaimed.
This document is not an offer to sell or a solicitation to buy any securities. This firms and its affiliates and their officers and employees may have a position, make markets, act as principal or engage in transaction in securities or related investments of any company mentioned herein, may perform services for or
solicit business from any company mentioned herein, and may have acted upon or used any of the recommendations herein before they have been provided to you. © PT Mirae Asset Sekuritas Indonesia 2016.