INTRODUCTION
Energy Crisis
World energy demand in the last two decades has grown at a rate of 1.9 percent per year. The latest report from the IPCC (Intergovernmental Panel on Climate Change) [4] shows a high correlation between global warming and increased CO2 emissions.
Solar Hydrogen
Various approaches for solar-driven water splitting have been widely studied, such as combined operation of photovoltaics (PV) and electrolyzers[8], and photocatalytic water splitting.[9] Recently, solar-driven thermochemical water splitting has attracted considerable attention due to its potential for large-scale hydrogen production [10-14]. In order for the reaction to be thermodynamically favorable, the operating temperature must be higher than 4,330 oK and 3,330 oK for splitting water and carbon dioxide, respectively.
![Figure 1-3 Role of renewable energy production in the United States, 2013. [6]](https://thumb-ap.123doks.com/thumbv2/123dok/11420709.0/17.918.173.724.753.1020/figure-role-renewable-energy-production-united-states-2013.webp)
Two-Step Thermochemical Splitting of Water
However, for the water splitting step shown in Figure 1.6(b), the temperature range must be increased to extrapolate its intersection with the dashed line with zero free energy. Another potential candidate is the ZnO/Zn redox pair for the two-step thermochemical water splitting cycle [22], and the corresponding reactions for each step are described in equations 1.6 and 1.7.

Nonstoichiometric Two-Step Thermochemical Splitting of Water
The redox properties (reduction and oxidation) of the metal oxide control its behavior within the thermochemical two-step water splitting cycle. Therefore, the prerequisite for thermochemical water splitting on the redox properties of materials based on the thermodynamic properties (∆Hrxn water0 _ and ∆Srxn water0 _) for water thermolysis can be set as.
Discovery of Perovskites materials for Thermochemical Water Splitting
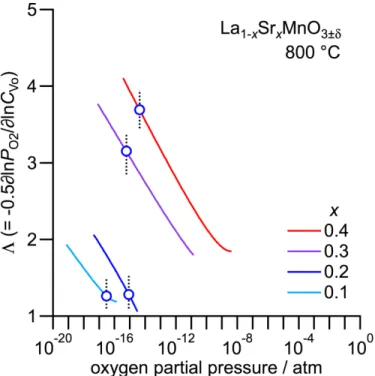
From the relationships described with Equation (2.2) to (2.5), the ∆hO and ∆sO can be extracted from the slope and intercept of the ln p (O2) vs. The Δδ values are converted from the averages of the oxygen release and hydrogen generation amounts shown in Figure 5-5.

Literature Review and Problems Statements
EXPERIMENTAL APPROACHES AND TECHNIQUES
Introduction
Materials Preparation
However, the size depends on the composition, the thermal stability and sintering of the metal oxide will affect the porosity and size of the monolith.
Powder X-ray Diffraction
The pattern of the collected diffracted beam reveals information about the spacing between atomic planes. The crystal structure can be determined by comparing a sample with a sample of the same material composition in a database or by refinement analysis.
Mercury Porosimetry
Closed pores cannot be detected with this method and will be one of the sources of error. Compared with the conventional porosity measurement performed by measuring the dimensions and volume of the sample, mercury porosimetry can minimize the measurement errors.

Scanning Electron Microscopy
Thermogravimetric Analysis (TGA)
The straight line in the graph implies that ∆hO is essentially independent of temperature. The partial pressure of oxygen in the system with values above 10-5 atm was monitored using premixed ultra-high purity O2 (UHP) in UHP argon.
Quadrupole Mass Spectrometry
Such a large sample mass benefits from the accuracy of measuring the relatively small mass changes due to the release and incorporation of oxygen. Therefore, the release of oxygen and the production of fuel (hydrogen or carbon monoxide) will change their respective ion concentrations in the reaction gases and can be detected based on changes in the ion current.
Thermochemical Water Splitting Cycle
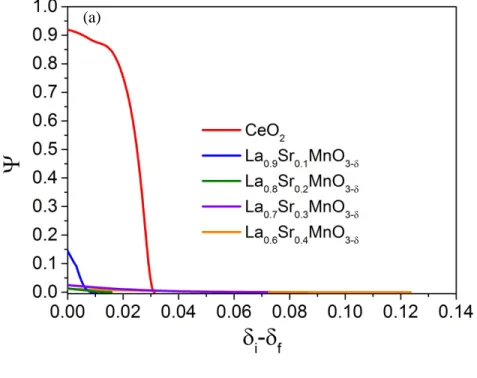
D and tel are largely independent of [V ]O•• , the latter being close to 1 throughout the experimental conditions, and both are effectively independent of p(O2). 6] Behavior is compared with that of CeO2-δ, calculated on the basis of the thermodynamic data reported by Panlener et al.[5] The calculation has great uncertainty due to the absence of data in the raw thermogravimetric plots in the vicinity of δ= 0, therefore the calculated curves are calculated within the last 0.5% of δi- δf with approximation.

THERMOCHEMICAL WATER SPLITTING WITH LANTHANUM
Then the multivalent element must be chosen, as this element plays a major role in the redox properties of the perovskite. In this study, the solid solution oxides La1-xSrxMO3-δ (M = 3d transition metals such as Cr, Mn, Fe, Co, etc.) are considered first because their redox properties have been widely studied for various applications such as the electrode, electrolyte and interconnect for SOFC [1 -3].
At first impression, the oxygen excess region is attractive for the thermochemical cycles because it expands the region of oxygen non-stoichiometric changes. The thermodynamic prerequisite for redox medium is described with equation (1.14), and it shows that the reduction enthalpy (ΔhO) of La0.9Sr0.1MnO3±δ within the oxygen excess range (3+δ>3) is smaller than the values of water (241 kJ/mol -ISLAND).
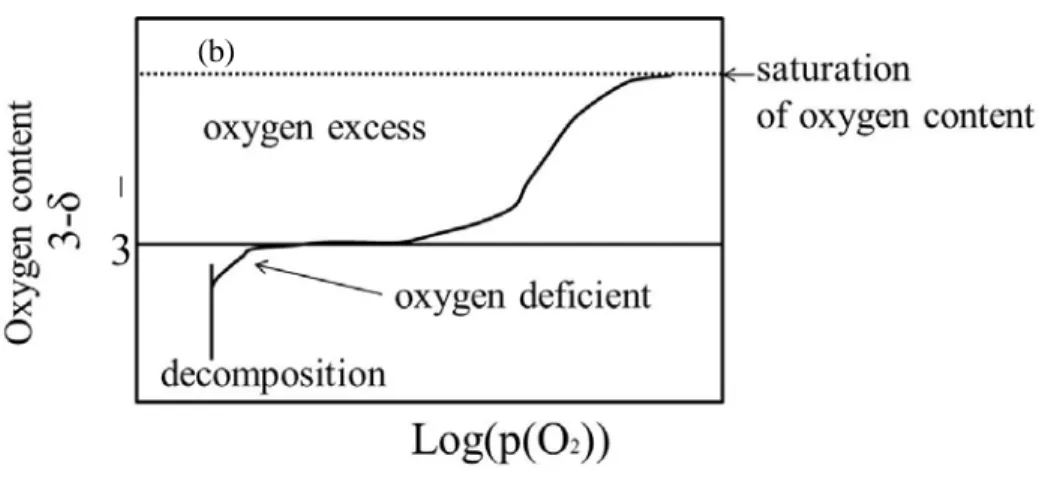
This agreement provides confidence in the extrapolation of the oxygen non-stoichiometry values to high temperature. In the case of LaMnO3-δ, a contribution to Δδ appears due to the possibility of entering the oxygen excess region.
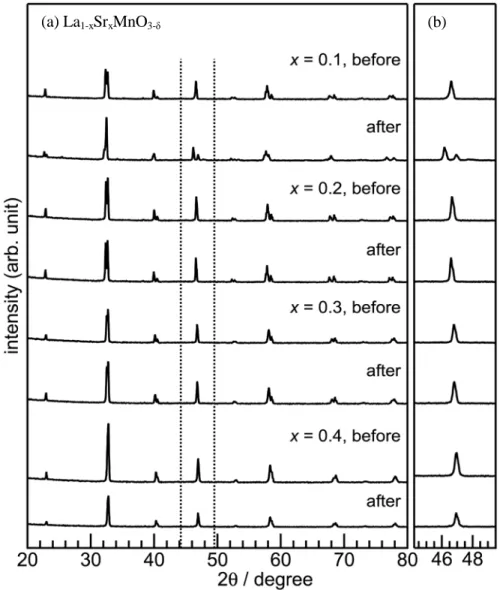
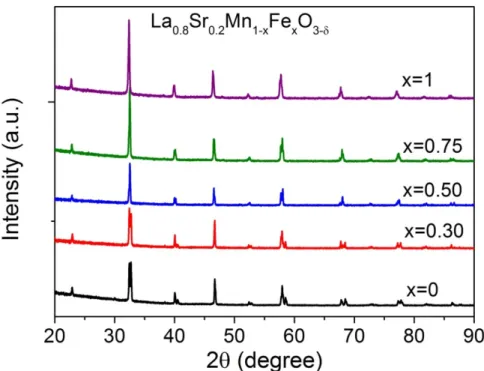
No structural changes were observed in the cycling of working oxides with Sr content of 20 at% (x=0.2 of La1-xSrxMnO3-δ) or higher. For samples with a space group of 3�
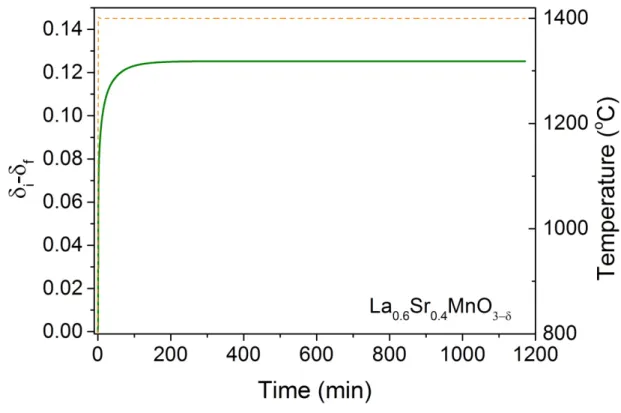
The oxygen and hydrogen yields per cycle for the x = 0.2 and 0.4 compositions (obtained from an integration of the surface area of the In addition, the predicted O2 release based on the thermodynamic analysis is given for comparison.

Reaction Kinetics Discussion
The peak of the efficiency curve is at 880 oC (±20 oC) as the water splitting temperature. However, due to the limited knowledge of the redox nature of La0.8Sr0.2Mn1-xAlxO3-δ, evidence to support this is still insufficient.
SOLAR TO FUEL PRODUCTIVITY AND EFFICIENCY
Introduction
1-3] While equilibrium fuel productivity provides one measure of a material's suitability for thermochemical cycles, such a metric has the potential to be misleading because it does not take into account the steam-to-hydrogen conversion efficiency. The solar-to-fuel conversion efficiency calculation and the effects of redox properties of active oxides on this efficiency are discussed here.
Fuel Production Reaction Extent
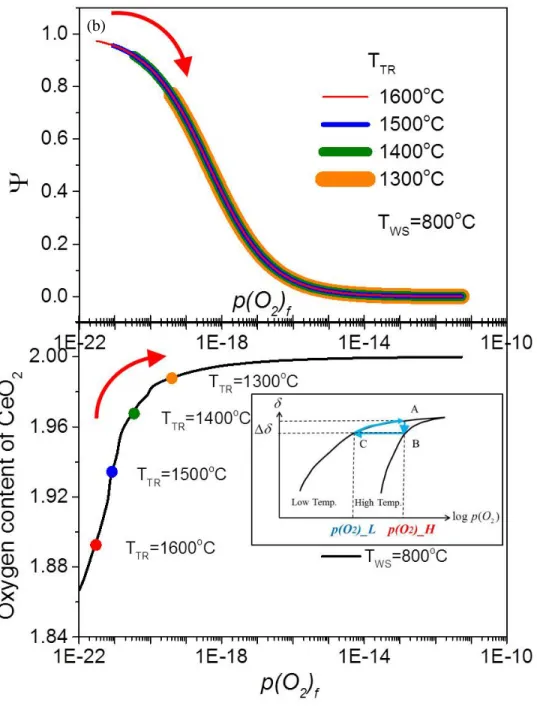
It is worth noting that in the inset graph, p(O2) of point B is the partial pressure of the oxygen reduction reaction, and p(O2) of point A determines the p(H2O) of the vapor. The reaction volume of the water splitting reaction, ψ, plotted along with the change in chemical potential corresponding to the effective partial pressure of oxygen during the reaction carried out with CeO2.

Temperature Effect on Reaction Extent
Fixed temperature water splitting (TWS) reaction extent calculated from the redox properties of CeO2. The course of the water splitting reaction can be seen as the movement of point C towards point A along the thermogravimetric TWS curve as shown in the graph below.
Materials-Related Impacts on Reaction Extent
Top) Reaction scope of CeO2. tested under the same cycling conditions shown on the plot. From the analysis above, it is clear to see how different redox properties affect the extent of the reaction and the amount of water required for reoxidation.
Approaches to Designing New Materials from Solar to Fuel Efficiency
Refined structural parameters at room temperature for La0.8Sr0.2Mn1-xFexO3-δ as-synthesized samples and the porosity of the porous monolith before and after the thermochemical cycle (10 continuous cycles) between 800-1400 °C. PO i represents the oxygen partial pressure of the gas atmosphere after passing through the reactive oxide.

B SITE DOPING EFFECTS ON THERMOCHEMICAL CYCLING
Introduction
For the divalent cation, the first-column transition metals have ionic radii similar to Mn, so high doping solubility is expected. From the same preliminary measurements, La0.8Sr0.2FeO3-δ showed higher fuel productivity from thermochemical cycling than La0.8Sr0.2CrO3-δ, therefore La0.8Sr0.2Mn1-xFexO3-δ will be studied.
New Oxides Structure Characterizations
Microstructure of La0.8Sr0.2Mn1-xFexO3-δ before (left column) and after (right column) a thermochemical cycle (10 continuous cycles) between 800-1400 °C. The microstructure of the synthesized La0.8Sr0.2Mn1-xAlxO3-δ porous monoliths was characterized by SEM and is shown in Figure 5-4.
Reduction enthalpy and entropy of La0.8Sr0.2MnO3-δ extracted from reported TGA results [4]. Indeed, the distinct behavior of La0.8Sr0.2FeO3-δ can be seen directly from the raw TGA results.
![Figure 5-8. (a) Oxygen non-stoichiometry of La 0.75 Sr 0.25 FeO 3-δ in (3- δ)-vs-log ( p(O 2 )) plots from reference [2] measured by thermogravimetric analyzer](https://thumb-ap.123doks.com/thumbv2/123dok/11420709.0/124.918.195.792.112.941/figure-oxygen-stoichiometry-plots-reference-measured-thermogravimetric-analyzer.webp)
For thermal reduction reactions, the oxide is in the oxidized state at the beginning of the reaction. After the oxygen release from the oxide during thermal reduction, the chemical potential of the oxide would change due to the change of state (value of δi).

REACTION KINETICIS ASPECTS STUDIES
Introduction
In the first half of this chapter, we studied the reaction kinetic limitation for both thermal reduction and water splitting steps. The aim is to suppress the segregation of SrO, i.e. to improve the kinetics of the water splitting reaction.
Thermodynamic Influences on Kinetics
The index of the bracket stands for the states of the oxygen originally stored in the oxides. It is clear that after the reduction reaction, shown in Equation 6.5, the amount of oxygen in the gas phase increases due to the release of oxygen from the reactive oxide.

Concrete Examples: Thermal Reduction Kinetics
For the sample that shows agreement between calculated and measured profiles, such as La0.9Sr0.1MnO3-δ, there is also the possibility that the reaction kinetics is limited by the gas carrier flow rate since the ratio of the gas carrier flux to mass ( 𝐹̇ 𝑛� 𝑜𝑥𝑖𝑑𝑒) also affects the δ evolution as shown in Equation 6.13. The differences between calculated and measured profiles may also be due to the approach of the simulation.
Concrete Examples: on Water Splitting Kinetics
Comparing the simulations with the experimental results, it is clear that the simulations give higher hydrogen production fluxes. The solid lines are the simulated hydrogen production fluxes under different steam flow rates and the dashed lines stand for the corresponding calculated δ evolutions.
Enhancing Reaction Kinetics through Materials Modification
Regarding the A-site cation excess samples (x>1 of (La0.50Sr0.50)xMnO3-δ), there is no obvious, systematic microstructural trend with the composition stoichiometry. Therefore, the samples possessing an excess of A-site cations can be considered as compositions of (La0.50Sr0.50)MnO3-δ and (La1-ySry)3Mn2O7-δ.

CONCLUSIONS AND FUTURE OUTLOOK
Conclusions
Increasing the substitution of Sr for the A-site cation mainly decreases the enthalpy of the oxidation reaction, which increases the reduction and increases fuel productivity. To balance the goals of high fuel productivity and large reaction scale, the solar fuel efficiency (ηsolar fuel) was determined as a value for evaluating candidate oxides for two-step thermochemical cycling.
Future Work
Within the study of A-site cation stoichiometry modifications for La0.5Sr0.5MnO3-δ, excess A-site cation doping promotes the reaction kinetics on both thermochemical cycle steps. This enhancement is believed to be related to the presence of the additional Ruddlesden-Popper phase resulting from the excess A-site cation doping.
![Figure 1-1 Current and projected world energy demand from 1990 to 2040 from ref. [1].](https://thumb-ap.123doks.com/thumbv2/123dok/11420709.0/14.918.258.625.613.896/figure-current-projected-world-energy-demand-1990-2040.webp)


