Directory UMM :Data Elmu:jurnal:A:Agricultural & Forest Meterology:Vol102Issue4May2000:
Teks penuh
Gambar
Dokumen terkait
The objectives of this study were: (i) to examine the feasibility of measuring soil CO 2 efflux in a Bel- gian Scots pine forest by eddy covariance, and (ii) to compare the eddy
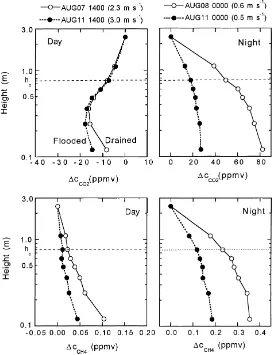
Source distributions for heat, water vapour, CO2 and CH4 within a rice canopy were derived using measured concentration profiles, a prescribed turbulence field and an inverse
The variation between the two plants in their transpiration rates was probably due to the varying levels of shade provided by the Grevillea canopy as determined by the
To estimate the annual net ecosystem production (NEP) and carbon sequestration, eddy-covariance measurements during periods of poorly developed turbulence at night, and missing
Free-air CO 2 enrichment (FACE): blower effects on wheat canopy microclimate and plant
The most obvi- ous difference between both experiments was S, where the sunflower canopy in the 1998 experiment would fluctuate between one to two azimuth preferences, but in the
A statistical interpolation method is proposed which allows calculation of the leaf area index LAI(t), the downward cumulative leaf area index L(z, t) and the canopy leaf area
(a) Rubisco-limited (solid curve) or RuBP-limited (dashed curve) photosynthesis of sunlit leaves within the canopy, the cu- mulative leaf area index at which photosynthesis of
