Design of Multi-wavelength Optical Power Meter
using Feedback Resistor Combination
D. Hanto, T. B. Waluyo, A. Setiono, R. K. Ula and B.
Widiyatmoko
11Research Center for Physics
Indonesian Institute of Sciences South Tangerang, Indonesia Email: [email protected]
A. R. Permata Sari
22
Engineering Physics, Institut Teknologi Sepuluh Nopember
Surabaya, Indonesia
Email: [email protected]
Abstract— Optical power is one of the important parameters in optics. Optical power is used to determine losses that occur along the optic link. Optical power is also needed in the designing of optical fiber sensors. In this research, the signal-conditioning-circuit design and optical-power-measurements characterization for laser at wavelength 1310 nm and 1552 nm have been conducted. This device works as an optical power meter. It uses 6 units of resistances (100 Ω, 1k Ω, 10k Ω, 100k Ω, 1M Ω and 10M
Ω) as feedback of transimpedance amplifier. These resistors are connected in a parallel way and combined to expand the measurement range of optical power. The obtained data was compared and validated with Anritsu ML9002A OPM. The result was 5 different optical power measurement regions for each wavelength from -5 dBm to -45 dBm. This range can be expanded using analytical approach to obtain a wider dynamic range.
Keywords— Optical power meter; signal conditioning; laser; transimpedance amplifier.
I.INTRODUCTION
The use of optical fiber as a medium of data transmission has largely replaced the role of copper wires. Optical fiber is chosen because it has several advantages over copper cables, including: cheaper, more flexible, smaller diameter, larger capacity (bandwidth), and immunity to electromagnetic waves interference since optical fiber is constructed of glass and plastic [1], [2]. Furthermore, optical fiber can be developed to various sensors [3]–[6].
In optical fiber transmission system, optical power is essential. The optical power that enters and leaves the optical fiber must be considered. Consequently, Optical Power Meter (OPM) is very important, it is used to measure the power of the transmitted light. OPM is also used to determine losses, optical-link checking, and optical-fiber-sensor validation [4]. Optical power as a function of wavelength is expressed in decibels (dB) or Watt (W) [7].
In the market, OPM is available with a choice of diverse wavelengths such as 850, 1310, 1490, 1550, and 1625 nm which are selected manually. Connector adapters for optical fiber is also available on various models, such as SC, FC, ST, and LC. On the other hand, the optical power measurement range is starting from -60 dBm to 10 dBm [8]–[10].
The most popular OPM development was the one that built from the transimpedance amplifier (TIA). The TIA is used for OPM because it has small noise and wide bandwidth [11]– [14]. Applying the TIA, OPM gets a wide dynamic measurement range from 1 pW up to 80 mW for the wavelengths of 532 nm and 642 nm. To obtain a wide dynamic range, a feedback resistor was selected automatically from several resistors mounted on circuit [15][16].
In this paper, a simple optoelectronic system have been developed. The system works as OPM mainly for continuos wave (CW) laser operation. Then it is adopted as a field model. The constructed OPM used TIA as main circuit. Combination of feedback resistors is used for range selection. The resistors is connected in parallel way and expected to facilitate the development of system automation and to avoid confusion of value. The parallel combination also desired to produce wide dynamic range and a uniform value.
In this paper, OPM have been tested for measuring the frequently-used light sources, such as laser at wavelengths 1310 nm and 1552 nm. Therefore, the OPM function appropriately especially in the communication and sensor fields.
II. EXPERIMENT
In this paper, Optical Power Meter has been made using transimpedance amplifier technique as shown in Figure 1. The feedback resistors with parallel configuration is used in the system. The parallel configuration will be used to facilitate autoranging system. In the previous paper from the authors, which is also report the designing of OPM, the system used just one value of resistor to determine the optical power [17].
2015 International Conference on Automation, Cognitive Science, Optics, Micro Electro-Mechanical System, and Information Technology (ICACOMIT), Bandung, Indonesia, October 29–30, 2015
Fig. 1. Optical Power Meter Circuit
The circuit as shown in Fig. 1 is used as conditioning system for incoming signal from the light source. The FGA01FC InGaAs photodiode is used as light detector with FC (ferrule connector) connector. The photodiode has wavelenght range of 800 nm – 1700 nm [18]. The IC OP07CP is used as the operational amplifier. Since the IC needs ±6 V power to works, so the voltage regulator system is required. The regulator system is obtained from LM 7806 and 7906 and two 9V batteries. A parallel feedback resistor consist of 100 Ω, 1k Ω, 10k Ω, 100k Ω, 1M Ω, and 10M Ω. These resistors will be selected manually using dip switch. The consequence of using 6 resistors is there will be several value of resistances as shown in Table I.
Table I. Combination of parallel feedback resistor No. Parallel combination Resitance value (Ω)
1 R6 1,0000,000.00
2 R6 and R5 909,090.91
3 R6, R5, and R4 90,090.09
4 R6, R5, R4, and R3 9,000.90
5 R6, R5, R4, R3, and R2 900.01
6 R6, R5, R4, R3, R2, and R1 90.00
The light source used in this experiment was diode laser at wavelength of 1310 nm and 1552 nm alternately. Scheme Block of experiment can be seen in Figure 2. As a variation of measured optical power, this experiment used Attenuator HP 8156A. The light passes through single-mode-optical-fiber cable from diode laser to attenuator and from attenuator to the conditioning circuit. The output voltage of the conditioning circuit was measured by digital voltmeter.The output optical power from attenuator is also being measured by Power Meter OPM Anritsu ML9002A for validation.
Fig. 2 Scheme block of characterization
III. RESULT AND DISCUSSION
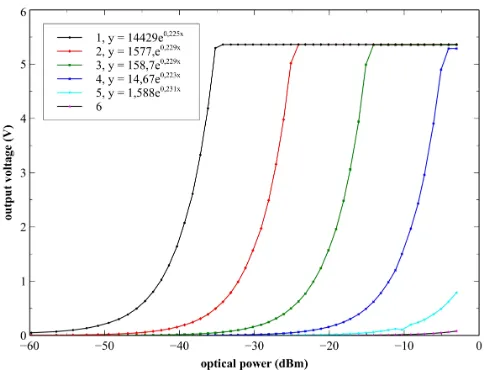
The optical power of laser at wavelength of 1310 nm and 1552 nm measurement characterization using OPM circuit results as shown in Figure 3 and Figure 4. For each light source, the measurement has been done by providing optical power variation from -5 dBm to -45 dBm.
Fig. 3 Measurement results of OPM circuit with the 1310 nm laser diode
Fig. 4 Measurement results of OPM circuit with the 1552 nm laser diode
Generally, both of the graph from figure 3 and 4 showed the same trend. The graph shows the relation between optical power (dBm) and output voltage (V) of the conditioning circuit of OPM. Each graph represents the usage of each combination of resistors in parallel way.
Combination 1 to 4 of parallel feedback resistors had exponential expression, starting arround 0 V, proportionately increasing between 0 V and 5.3 V, and then saturating at 5.3 V. On the other hand, the combination 5 and 6 of feedback resistors have not been used in this experiment because of the combination 1 to 4 is enough to measure the full range of the laser optical power. Thus, the result of the combination 5 and
Diode laser Attenuator Power Meter
Circuit OPM Multimeter
FO cable
FO cable
FO cable
6 will be used in optical power measurement greater than -5 dBm.
Compared with the previous research [17], the result of this experiment showed some improvements, where the produced measurement ranges have similar lengths. It were indicated by the same distance between the graphs. These results were obtained in both experiment using light source at 1310 nm and 1552 nm. While on the previous research [17], the only light source had been characterized at wavelength 1310 nm. According to the result of experiment, the OPM circuit can be used on multi wavelength light sources not limited to 1310 nm and 1552 nm. However, each optical power measurement at different wavelength will have different expression because responsitivity value of photodiode is also dissimilar. So, further experiment must be done.
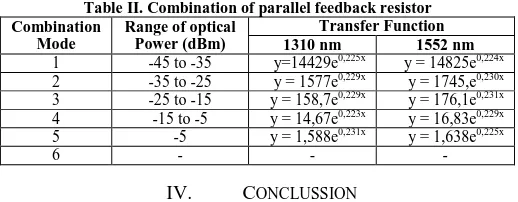
In Figure 3 and 4, the different wavelength of light sources caused different transfer function equation of optical power to electrical voltage. The transfer function is taken from by taking the lowest limit at 0.5 V and highest limit at 5 V. As a result, Table II gives information about measurement range from parallel resistors combination in 1310 nm and 1552 nm. According to the combination of 1 to 4, the use of parallel wavelengths. By using further analysis, it is possible to expand the dynamic range lower than -50 dB or greater than 15 dB by manipulating the parallel combination of feedback resistors as desired.
Table II. Combination of parallel feedback resistor Combination using OPM, the light source wavelength to be measured has to be in accordance with the wavelength selection of the OPM. In addition, in order to be able to work automatically OPM needs a processing system to choose the combination of parallel resistors and its equation according to optical power values. The advantage of using the combination of parallel resistors rather than single resistor is to avoid the saturated value happened at transition time because of switching between one resistor to another.
Acknowledgment
The work was supprted by Ministry for Research and Technology Republic of Indonesia under grant RT-2014-0283. The Authors also thank to M. Syafiq, A. Miftachul Erfan, M. Nadhief, and Mustiyani for their help in fabrication and data measurement.
References
[1] G. P. Agrawal, Fiber-Optic Communications Systems, Third Edition., 3rd ed., vol. 6. Ney York: A john Wiley Interscience & Sons Inc, 2002.
[2] R. S. Quimby, Photonics and Lasers An Introduction, 1st ed. New jersey: John Wiley & Sons, Inc., 2006.
[3] J. Gan, H. Cai, J. Geng, Z. Pan, R. Qu, and Z. Fang, “Optic Fiber-Based Dynamic Pressure Sensor,” J. Electron. Sci. Technol. China, vol. 6, no. 4, pp. 482–485, 2008.
[4] M. Bin and Z. Xinguo, “Study of Vehicle Weight-in-Motion System Based on Fiber-Optic Microbend Sensor,” 2010 Int. Conf. Intell.
Comput. Technol. Autom., no. 1, pp. 458–461, May 2010.
[5] S. Yin, P. B. Ruffin, and F. T. S. Yu, Optical fiber Sensors, 2 nd. New York: CRC Press, 2008.
[6] S. Yuan, F. Ansari, X. Liu, and Y. Zhao, “Optic-Fiber Based Dynamic Pressure Sensor for WIM System,” vol. 4.
[7] U. Instrument, “Fiberoptics Measurements,” pp. 1–2.
[8] O. Fiber, “The FOA Reference For Optical fibers.” 2014.
[9] Coherent, “Measuring Laser Power and Energy Output.”
[10] F. Corporation, “SimpliFiber Pro Optical Power Meter & Fiber Test Kits – Optical Fiber Power Meter _ Fluke Networks.” 2015.
[11] J. Envall, “Optical Power Measurements: Applications in Optical fibers and Ultraviolet radiometry,” 2006.
[12] G. P. Eppeldauer, H. W. Yoon, D. G. Jarrett, and T. C. Larason, “Development of an in situ calibration method for current-to-voltage
converters for high-accuracy SI-traceable low dc current
measurements,” Metrologia, vol. 50, no. 5, pp. 509–517, Oct. 2013.
[13] F. Tavernier and M. Steyaert, High-Speed Optical Receivers with
Integrated Photodiode in Nanoscale CMOS. New York, NY: Springer
New York, 2011.
[14] K. Hayashi, K. Saitoh, Y. Shibayama, and K. Shirahama, “A current to voltage converter for cryogenics using a CMOS operational amplifier,”
J. Phys. Conf. Ser., vol. 150, no. 1, p. 012016, Feb. 2009.
[15] S. Krishnan, K. S. Bindra, and S. M. Oak, “A sensitive and high dynamic range cw laser power meter.,” Rev. Sci. Instrum., vol. 79, no. 12, pp. 125101–1 –1251016, Dec. 2008.
[16] D. Choudhury, M. Devi, and A. K. Barbara, “Laser power meter : A simple optoelectronic set-up,” Indian J. Pure Appl. Phys., vol. 44, no. November, pp. 801–804, 2006.
[17] D. Hanto, A. Setiono, I. T. Sugiarto, T. B. Waluyo, and B. Widiyatmoko, “Design of Range Selector Circuit for measuring Optical Power (in Indonesia),” Telaah, vol. 32, no. 2, pp. 52–55, 2014.