An Experiment of Lie Detection based EEG-P300
Classified by SVM Algorithm
Artha Ivonita Simbolon, Arjon Turnip
Technical Implementation Unit for InstrumentationDevelopment
Indonesian Institute of Sciences, Bandung, Indonesia E-mail: [email protected]
Jeperson Hutahaean, Yessica Siagian, Novica Irawati
Physics DepartmentInformation System Department
STIMIK Royal Kisaran, North Sumatra, Indonesia E-mail: [email protected]
Abstract—ERP method is chosen to identify whether a person is lying or not. It comprises of three steps and utilizes signal P300 as marker. For the sake of simplicity, Matlab based program is constructed to take over the processes. Eleven males whose age is between 20 and 27 were subject to the experiment. The gathered data were then divided into training and test data to produce several models. They were then narrowed down using SVM method based on accuracy and computation time. Despite being relatively low in accuracy, the resulting model that is used in the program proved to be able to discern all of the subjects.
Keywords—ERP method, signal P300, SVM method
I. INTRODUCTION
Lying is an act of hiding truth and any information that follows. It occurs in many occasions such as interview and interrogation. Many subjects or suspects may resort to this in hope of an easier way of getting out of their predicament. This shows the importance and necessity of lie detection.
The mechanism behind lie detection lies within human bodies themselves. There are several biological signals that represent signs of lying such as skin conductivity, blood pressures, heartbeat, sound producer microtremor, body temperature, and brain activities[1]. Developments in lie detection that had been conducted were based on skin conductivity, heartbeat, breathing, voice, handwriting, and brain activities[2]. Among them, lie detection based on brain activities is still ongoing. Functional Magnetic Resonance Imaging (fMRI) and Event Related Potentials (ERP) are examples of them[3].
Electroencephalogram (EEG) records brain activities based on its potential[4]. On the other hand, ERP measured brain response directly from thought or perception; it may be cognitive, sensory, or motoric events[5]. Among many types of signals that constitute ERP signal, P300 is the most important in detecting lies[6].
There are three types of P300 stimuli; probe stimuli, target stimuli, and irrelevant stimuli. Probe (P) stimuli are related to hidden information known only to lying subjects and observers. Unlike probe stimuli, target (T) stimuli are known by anyone, and the subjects are told to do some tasks while being presented. Lastly, irrelevant (I) stimuli
correspond to nothing that is related to lying, and thus is not known by all subjects[3, 7].
Despite being straight forward, the process is tedious and could be done through numerical program. The most suitable method for this is SVM classification[7]. Hence, Matlab based program, which is able to detect lies by utilizing signal P300 and SVM method, is proposed.
II. METHOD
A. Materials and Procedure
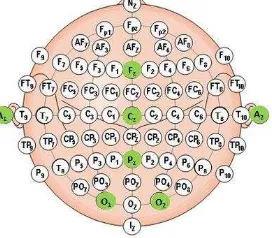
Eleven untrained male, whose age is between 20 and 27, were involved. They were all healthy both physically and mentally. Furthermore, the subjects were divided into two groups; innocent and lying. Each one of them is equipped with ElectroCap. Once equipped, each electrode must be covered with electrolyte gel. Among many channels on the ElectroCap, Fz, Cz, Pz, O1, and O2 were used. Their
respective location is shown in Fig. 1. These channels are related to sighting activities.
Fig. 1. Several channels used in the experiment which is related to sighting activities.
Further, recording signals were conducted using Mitsar EEG 202 system which preprocessed by WinEEG, while the stimuli were displayed through Psytask paradigm. Stimuli P, T, and I were repeatedly and randomly displayed. The time interval between each stimulus is about 1.1 s with 2 s delay. The mechanism of the displayed stimuli in the experiment is depicted in Fig. 2.
2015 International Conference on Automation, Cognitive Science, Optics, Micro Electro-Mechanical System, and Information Technology (ICACOMIT), Bandung, Indonesia, October 29–30, 2015
Fig. 2.Stimulus display mechanism.
Both WinEEG and Psytask must be simultaneously activated such that the EEG signals can be well transmitted to the subjects. This setup will also affect the quality of the recorded EEG signals.The recorded signals as EEG raw data is saved in *.eeg format for further processing.
B. Preprocessing
Signal P300 preprocessing composed of remove offset, bandpass filter, Independent Component Analysis (ICA), and trial data. In this experiment, the frequency for bandpass filter is set between 0.3 Hz and 30 Hz since the information lies within the range[8]. Meanwhile, ICA is used to separate data from the overlapping artifact at the electrodes. It works with three assumptions[9].
a. Data is combination of stable space cerebral activity and independent artifact.
b. Superposition of potentials on many parts of the brain, head skin, linear body of the electrodes, and propagation delay can be neglected.
c. Number of source is not greater than the electrode’s.
Trial data are samples of stimuli that are used in the experiment. They were used to separate the stimuli into P, T, and I.
C. Feature Extraction
Signal P300 is expressed in time domain while its energy distribution is scattered. Hence, its versatility in reducing noise. The energy signal must first be expressed in time and frequency domain before it can be further used. Afterward, feature extraction can be applied to produce five characteristics of signal P300; minimum amplitude, maximum amplitude, mode amplitude, median amplitude, and mean amplitude.
D. Classification
Classification is aimed to categorize feature extraction results based on mental tasks or the given stimuli. It must correspond to both mental tasks and stimuli in order to obtain the desired EEG signal. Among many classification algorithms, Support Vector Machine (SVM) is chosen due to its accurate result and fast computation time. The other algorithms are provided in the following literature[10-14].
SVM is a prediction algorithm used in classification and regression. Both SVM and ANN are comparable and are categorized as class supervised learning. SVM has long been developed, and is a combination of computational theories such as margin hyperplane and kernel.
In other words, SVM is a technique used to obtain the most probable hyperplane to separate two classes. It is done
by measuring the hyperplane’s margin and determines its
maximum point. Margin is defined as distance between the corresponding hyperplane and the nearest pattern from each class. Moreover, this nearest pattern is called support vector. Meanwhile, SVM can also be used to separate non-linear data as displayed previously in the following literature[9]. These explanations are well illustrated within Fig. 3. Fig. 3a displays several discrimination boundaries while Fig. 3b shows the most probable hyperplane.
(a) (b)
Fig. 3.SVM is a method used to obtain the most probable hyperplane (Nugroho, 2003).
III. RESULT AND DISCUSSION
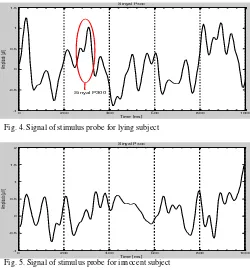
Among three stimuli responses which are produced through preprocessing, response P hold the most important information in determining whether subjects are lying or not. This response, which is called P300, is provided within Fig. 4 and Fig. 5. Lying subject shows significant amplitude change after 400 ms of given stimulus. This corresponds to the previous work which states signal P300 can be observed within time interval of 300 ms and 600 ms [5, 10, 11, 14].
Fig. 4.Signal of stimulus probe for lying subject
0 200 400 600 800 1000
Fig. 5.Signal of stimulus probe for innocent subject
data. Overall, there are 88 mode amplitude and 88 mean amplitude; hence 88 pairs data. These pairs are then divided into two; one for training while the other used for testing. In this work, 64 pairs were used for training and the rest were used for testing.
Training process was done by categorizing data into two groups; lying and innocent. Lying subjects will be marked with 1 while the innocent one is marked with 0. Each subject has 8 pairs of data that will be classified. The resulting sum of data will be used to define whether the subject is lying or not. Afterwards, the SVM models were tested, and the result is provided within Table 1.
TABLE I. SVM CLASSIFICATION RESULT
No. Test
Accuracy of SVM Model
(%)
Time (sekon)
Result of Classification
1 1 33.33 0.0324 Unclassified
2 2 62.5 0.0458 Unclassified
3 3 66.67 0.0411 Unclassified
4 4 58.33 0.0301 Unclassified
5 5 70.83 0.0283 Classified
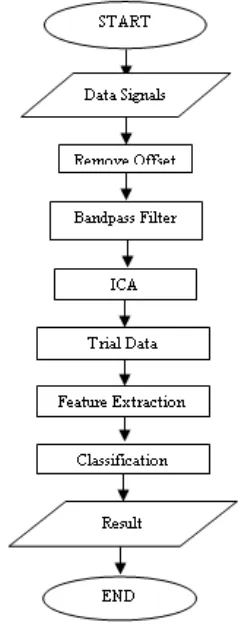
Table 1 shows that a SVM model that has an accuracy of 70.83% and computation time of 0.0283 s is the most probable. This model will then be used to construct Matlab based program to detect lies. The flowchart can be seen in Fig. 6.
Fig. 6.Flowchart of lie detector program
The resulting program was then tested using the same data used in the beginning of this work. The test result can be seen in Fig.7. Compared to the previous work, the SVM model used in this work has a relatively low accuracy [7]. However, despite low accuracy, the result is satisfactory.
Fig. 7.Lie detector program
IV. CONCLUSION
SVM method is able to separate lying subjects from the innocent one based on signal P300. The extracted signals then narrowed down using SVM method based on accuracy and computation time. Despite being relatively low in accuracy, the resulting model that is used in the program proved to be able to discern all of the subjects.
ACKNOWLEDGMENT
This research was supported by the thematic program through the Bandung Technical Management Unit for Instrumentation Development (Deputy for Scientific Services) funded by Indonesian Institute of Sciences, Indonesia.
References
[1] J. T. Cacioppo, L. G. Tassinary, and G. Berntson, Handbook of Psychophysiology, 3rd ed. Cambiage University Press, New York, 2007.
[2] I. G. A. Gunadi and A. Harjoko, "Telaah Metode-metode Pendeteksi Kebohongan," Indonesian Journal of Computing and Cybernetics Systems, vol. 6, pp. 35-46, July 2012.
[3] V. Abootalebi, M. H. Moradi, and M. A. Khalilzadeh, "A new approach for EEG feature extraction in P300-based lie detection," Computer Methods and Programs in Biomedicine, vol. 94, pp. 48-57, 4// 2009.
[4] A. Subasi and M. Ismail Gursoy, "EEG signal classification using PCA, ICA, LDA and support vector machines," Expert Systems with Applications, vol. 37, pp. 8659-8666, 2010. [5] A. Turnip, K. S. Hong, and M. Y. Jeong, “Real
-time feature extraction of P300 component using
adaptive nonlinear principal component analysis,” BioMedical Engineering OnLine,” vol. 10(83),
[6] B. Luzheng, F. Xin-an, and L. Yili, "EEG-Based Brain-Controlled Mobile Robots: A Survey," Human-Machine Systems, IEEE Transactions on, vol. 43, pp. 161-176, 2013.
[7] J. Gao, X. Yan, J. Sun, and C. Zheng, "Denoised P300 and machine learning-based concealed information test method," Computer Methods and Programs in Biomedicine, vol. 104, pp. 410-417, 12// 2011.
[8] M. T. Akhtar, W. Mitsuhashi, and C. J. James, "Employing spatially constrained ICA and wavelet denoising, for automatic removal of artifacts from multichannel EEG data," Signal Processing, vol. 92, pp. 401-416, 2// 2012.
[9] E. W. Sellers, D. J. Krusienski, D. J. McFarland, T. M. Vaughan, and J. R. Wolpaw, "A P300 event-related potential brain–computer interface (BCI): The effects of matrix size and inter stimulus interval on performance," Biological Psychology, vol. 73, pp. 242-252, 10// 2006.
[10] A. Turnip and K. S. Hong, “Classifying mental activities from EEG-P300 signals using adaptive
neural network,” Int. J. Innov. Comp. Inf. Control,
vol. 8(7), 2012.
[11] A. Turnip, S. S. Hutagalung, J. Pardede, and, D. Soetraprawata, "P300 detection using multilayer neural networks based adaptive feature extraction method", International Journal of Brain and Cognitive Sciences, vol. 2, no. 5, pp. 63-75, 2013. [12] A. Turnip and M. Siahaan, “Adaptive Principal
Component Analysis based Recursive Least
Squares for Artifact Removal of EEG Signals,”
Advanced Science Letters, vol. 20, no.10-12, pp. 2034-2037(4), October 2014.
[13] A. Turnip and D. E. Kusumandari, “Improvement of BCI performance through nonlinear independent
component analisis extraction,” Journal of
Computer, vol. 9, no. 3, pp. 688-695, March 2014. [14] A. Turnip, Haryadi, D. Soetraprawata, and D. E.