Design and development of customer distribution
mapping based on Geographical Information System
Hanif Fakhrurroja and Muhammad Ilham Rizqyawan
Technical Implementation Unit for Instrumentation DevelopmentIndonesian Institute of Sciences Bandung, Indonesia
[email protected], [email protected]
Abstract— This paper aim to design and development of customer distribution mapping based on Geographical Information System (GIS). Software Development Life Cycle (SDLC) used in system development. Geographic information systems (GIS) have been adopted as a useful tool by a wide range of disciplines. With GIS, people can gather spatial data more efficiently, accurately, and fast. From the customer data and their transaction history, it's possible to analyze the national needs of calibration and instrumentation. It also possible to make a reminder for the customers to calibrate their instrument when the expired date is close. This application helps UPT BPI to optimize services.
Keywords— Geographical Information System, Unified Modeling Language, Customer mapping
I. INTRODUCTION
Geographic information systems (GIS) have been adopted as a useful tool by a wide range of disciplines such as environmental planning, property management, infrastructure siting, emergence planning, automobile navigation systems, urban studies, market analyses, and business demographics. Analyses from GIS can determine both threats and opportunities for development [1]. With the rapid growth of computer technology, researcher and engineer developed Geographical Information System (GIS) to gather and use spatial information.
A GIS can be used to capture, prepare, manage, manipulate, analysis and present geo-referenced data [2]. With GIS people can gather spatial data efficiently, quickly, and accurately. Over the past decade, researchers have done many researches about GIS and its application. A GIS can be used to help people in transportation [3,4], real estate [5,6], green energy [7,8], crime mapping [9,10], and many more areas.
Technical Implementation Unit for Instrumentation Development (UPT BPI) is one Echelon III unit in Indonesian Institute of Sciences (LIPI) whose job is to carry out services in the field of calibration and instrumentation research and development [11]. UPT BPI also responsible with public services such as calibration services and training. From those public services UPT BPI has many customers scattered all around Indonesia.
With the many of customer in number, it is actually possible for UPT BPI to utilize the data and analyze it in order to optimize services.
From the customer data and their transaction history, it's possible to analyze the national needs of calibration and instrumentation. When the customer instrument’s calibration expiration date is close, it possible to make a reminder for
Software Development Life Cycle (SDLC) used in system development is waterfall [12]. The process begins with Requirements Definition, then System and Software Design, Implementation and Unit Testing, Integration and System Testing, and Operation and the last is Maintenance. Waterfall method can be seen in fig. 1.
III. DEVELOPMENT
Requirements Defined by observed and depth interview with UPT BPI's staff and management, especially the one that directly related with Customers, Calibration and Training services which are metrology and public relation section. This stage is important because it's like setting our destination before we make a journey. Information from this stage will determine where the direction of development goes, how much resources do we need, and most the important, how should we design the system.
Figure 1 Waterfall Method (Sommerville, 2007) 2015 International Conference on Automation, Cognitive Science, Optics, Micro Electro-Mechanical System, and Information Technology (ICACOMIT), Bandung, Indonesia, October 29–30, 2015
After the requirements are defined, the next step is System and Software Design. This step is crucial as this step will determine how the system will be built. If the design is bad, chance are there'll be many changes in the system while the software is developed, and there'll be also a lot of bugs come from the software. When it happens, we'll be forced to go back to the previous stage and redesign the system. This is clearly inefficient because we will be wasting our resource to build a system only to tear it down again because it's not usable.
The modeling tools used for System and Software Design in this study is Unified Modeling Language (UML). It's one of the most common modeling tools and could model not only application structure, behavior, and architecture, but also business models and data structures [13].
A. Use Case Diagram
There are two actors in this system. Admin can access all the features on the system, including Manage User, Manage Customer Data, Manage Services, and Access Services Information. Those features require admin to login into the system. In each manage feature, admin can add, edit, delete, and search data. While admin can access all the features on the system, the second actor, and public can only access map. User can filter which data to display. For details see fig. 2.
B. Activity Diagram
1) Access and Filter Map
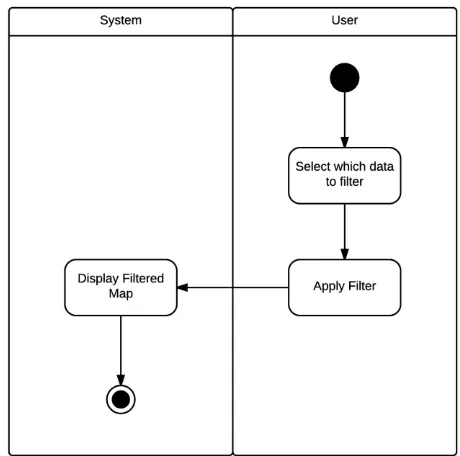
To access map, user just required to open the app, then map will be displayed in the home page. In the map, user can filter which data to display on the map. The filter is based on category of the customers. The category is Instrumentasi, Kalibrasi, Kerjasama, Pelatihan and Produk Hasil Penelitian.
Figure 2 Use Case Diagram
To filter the map, user needs to select which data to be displayed or filtered by checking or un-checking the category checkbox. After user click the filter button, system will filter the data displayed on map based on user selection. For details on those activities, see fig. 3 and fig. 4 below.
2) See Customer Details
User can see customer data which contains customer name and address by clicking customer marker on map. To see their transaction history, user needs to click customer name and
system will show the customer’s transaction history. See fig. 5 for details.
Figure 3 Activity Diagram - Access Map
Figure 5 See Customer Details
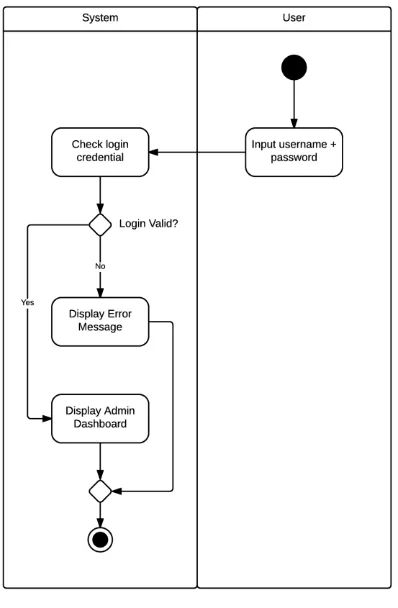
3) Login
Before admin can access admin dashboard, admin needs to login into the system. In the login page, user input their username and password, the system will check user login credential. If login not valid, error message will be displayed, telling user his/her login credential is not valid. If login valid, system will take user to admin dashboard. Login activity can be seen on fig. 6.
Figure 6 Activity Diagram - Login
4) Manage User, Customer and Services
The activity for these three use cases is basically same. User open one of the menu and system will display the menu page. In manage user menu, system will display the list of users and some of their basic data. The data displayed in paginated row, and each data has action button, allowed admin to edit and delete the data. There's also a search box for admin to quickly search specific data. Manage user, manage customer, and manage service activity can be seen on fig. 7, fig. 8, and fig. 9. Search, add edit, and delete data activity will be explained in next section.
Figure 7 Activity Diagram - Manage User
Figure 8 Activity Diagram - Manage Customer
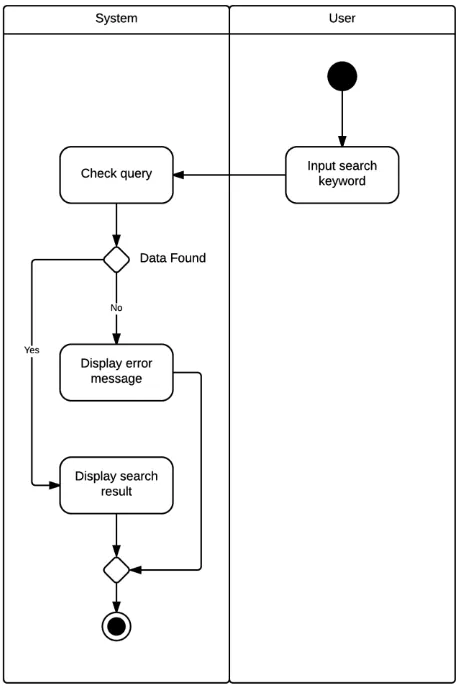
5) Search
Admin can quickly search specific data by inputting search keyword into the search box. The system will check for data in the database. If system found the data, search result will be displayed, and if not error message will be displayed. Search activity can be seen on fig. 10.
6) Add Data
To add data, admin needs to fill all required data field in the page, then click add button. System will insert the query into the database. If the insertion is successful, success message will be displayed, telling user that data has been successfully added into the database. If the insertion is unsuccessful, error message will be displayed instead. See fig. 11 for details.
7) Edit Data
After editing desired field in the edit page, admin needs to click edit button to confirm editing. System will call the update query into the database. If the editing is successful, system will take user back home menu. If the editing is unsuccessful, error message will be displayed. See fig. 12 for details.
Figure 10 Activity Diagram - Search
Figure 11 Activity Diagram - Add Data
Figure 12 Activity Diagram - Edit Data
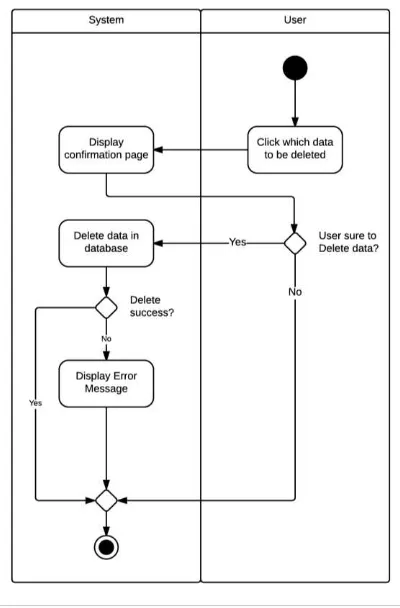
8) Delete Data
Figure 13 Activity Diagram - Delete Data
C. Entity Relationship Diagram
Entity Relationship Diagram shows graphical representation of table entity in the database and their relationship. There are four entities in this application: category, service, customer, and user account. See fig. 14 for details.
IV. IMPLEMENTATION
The designed system then coded and implemented into the actual application. The application developed using PHP as programming language and MySQL as Database Management System. CodeIgniter used as the framework for the application and Google Map API used as map engine.
Figure 14 Entity Relationship Diagram
A. Screenshot
Fig. 15 below shows homepage of the application and fig. 16 shows add service page, where admin can add service to the application database. Shown on fig. 17 customer details which contains customer name and their address. Customer transaction history can be seen on fig. 18.
Figure 15 Screenshot – Home
Figure 16 Screenshot - Add Service
Figure 17 Screenshot - Customer Details
B. Blackbox Testing
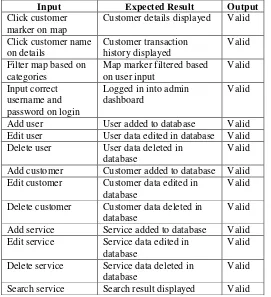
Blackbox testing used to figure whether the system works as intended or not. Blackbox testing on this application can be seen on table 1.
C. Maintenance
Operation and maintenance will be conducted by IT staff at public relation section. The staff is responsible for managing the application, log any bugs or error and report it once a month. The report will be handed to development team to be analyzed, fixed, and further developed.
V. CONCLUSIONS
This development of GIS customer distribution mapping helps staff and management of UPT BPI to understand their customer and plan better for their marketing strategy. But the developed system is still at an early stage, which only covers data collection and visualization on the map. Further development needed to be done to make this system more useful. One of our suggestions is to add an analytical and forecasting feature to the system.
Acknowledgment
This research was supported by the 2014 thematic program through the Bandung Technical Implementation Unit for Instrumentation Development (Deputy for Scientific Services) funded by Indonesian Institute of Sciences, Indonesia.
Table 1 Blackbox Testing
Input Expected Result Output
Click customer marker on map
Customer details displayed Valid
Click customer name
Add user User added to database Valid
Edit user User data edited in database Valid Delete user User data deleted in
database
Valid
Add customer Customer added to database Valid Edit customer Customer data edited in
database
Valid
Delete customer Customer data deleted in database
Valid
Add service Service added to database Valid Edit service Service data edited in
database
Valid
Delete service Service data deleted in database
Valid
Search service Search result displayed Valid
References
[1] Rachel J.C. Chen, "Geographic information systems (GIS) applications in retail tourism and teaching curriculum", Journal of Retailing and Consumer Services, vol 14, pp 289 – 295, 2007 "
[2] Otto Huisman and Rolf A. de By, Principles of Geographic Information Systems: an introductory textbook, 4th ed. Enschede, Netherlands: The International Institute for Geo-Information Science and Earth Observation (ITC), 2009.
[3] D. Cesur et al., "Integrating enterprise GIS with cloud computing for transportation planning and modeling," in Fifth International Conference on Computing for Geospatial Research and Application, 2014, pp. 108-109.
[4] Chih-Hao Wang and Na Chen, "A GIS-based spatial statistical approach to modeling job accessibility by transportation mode: case study of Columbus, Ohio," Journal of Transport Geography, May 2015.
[5] Jiann-Yeou Rau and Chen-Kuang Cheng, "A cost-effective strategy for multi-scale photo-realistic building modeling and web-based 3-D GIS applications in real estate," Computers, Environment and Urban Systems, vol. 38, pp. 35-44, March 2013.
[6] Francesco Battaglia, Giuseppe Borruso, and Andrea Porceddu, "Real estate values, urban centrality, economic activities. a GIS analysis on the city of swindon (UK)," in ICCSA'10 Proceedings of the 2010 international conference on Computational Science and Its Applications, Berlin, 2010, pp. 1-16.
[7] A. Abudureyimu, Y. Hayashi, and K. Nagasaka, "Off-shore wind power potential evaluation of entire Japan using GIS technology," in International Conference of Advanced Mechatronic Systems (ICAMechS), 2011.
[8] Jung-Jae Yee In-Ae Yeo, "A proposal for a site location planning model of environmentally friendly urban energy supply plants using an environment and energy geographical information system (E-GIS) database (DB) and an artificial neural network (ANN)," Applied Energy, vol. 119, pp. 99-117, April 2014.
[9] Chainey Spencer and Jerry Ratcliff, GIS and crime mapping.: John Wiley & Sons, 2005.
[10] R. Subhashini and V. Milani, "Implementing geographical information system to provide evident support for crime analysis," Procedia Computer System, vol. 48, pp. 537-540, 2015.
[11] UPT BPI LIPI, "Naskah akademik UPT Balai Pengembangan Instrumentasi," UPT BPI LIPI, Bandung, 2011.
[12] Ian Sommerville, Software engineering, 8th ed.: Addison-Wesley Publishers, 2007.