SPSS
®
FOR
DUMmIES
‰SPSS
®
FOR
DUMmIES
‰111 River Street Hoboken, NJ 07030-5774
www.wiley.com
Copyright © 2007 by Wiley Publishing, Inc., Indianapolis, Indiana Published by Wiley Publishing, Inc., Indianapolis, Indiana Published simultaneously in Canada
No part of this publication may be reproduced, stored in a retrieval system or transmitted in any form or by any means, electronic, mechanical, photocopying, recording, scanning or otherwise, except as permitted under Sections 107 or 108 of the 1976 United States Copyright Act, without either the prior written permis-sion of the Publisher, or authorization through payment of the appropriate per-copy fee to the Copyright Clearance Center, 222 Rosewood Drive, Danvers, MA 01923, (978) 750-8400, fax (978) 646-8600. Requests to the Publisher for permission should be addressed to the Legal Department, Wiley Publishing, Inc., 10475 Crosspoint Blvd., Indianapolis, IN 46256, (317) 572-3447, fax (317) 572-4355, or online at http://www. wiley.com/go/permissions.
Trademarks:Wiley, the Wiley Publishing logo, For Dummies, the Dummies Man logo, A Reference for the Rest of Us!, The Dummies Way, Dummies Daily, The Fun and Easy Way, Dummies.com, and related trade dress are trademarks or registered trademarks of John Wiley & Sons, Inc. and/or its affiliates in the United States and other countries, and may not be used without written permission. SPSS is a registered trade-mark of Norman H. Nie and C. Hadlai Hull. All other tradetrade-marks are the property of their respective owners. Wiley Publishing, Inc., is not associated with any product or vendor mentioned in this book.
LIMIT OF LIABILITY/DISCLAIMER OF WARRANTY: THE PUBLISHER AND THE AUTHOR MAKE NO REP-RESENTATIONS OR WARRANTIES WITH RESPECT TO THE ACCURACY OR COMPLETENESS OF THE CONTENTS OF THIS WORK AND SPECIFICALLY DISCLAIM ALL WARRANTIES, INCLUDING WITHOUT LIMITATION WARRANTIES OF FITNESS FOR A PARTICULAR PURPOSE. NO WARRANTY MAY BE CRE-ATED OR EXTENDED BY SALES OR PROMOTIONAL MATERIALS. THE ADVICE AND STRATEGIES CON-TAINED HEREIN MAY NOT BE SUITABLE FOR EVERY SITUATION. THIS WORK IS SOLD WITH THE UNDERSTANDING THAT THE PUBLISHER IS NOT ENGAGED IN RENDERING LEGAL, ACCOUNTING, OR OTHER PROFESSIONAL SERVICES. IF PROFESSIONAL ASSISTANCE IS REQUIRED, THE SERVICES OF A COMPETENT PROFESSIONAL PERSON SHOULD BE SOUGHT. NEITHER THE PUBLISHER NOR THE AUTHOR SHALL BE LIABLE FOR DAMAGES ARISING HEREFROM. THE FACT THAT AN ORGANIZATION OR WEBSITE IS REFERRED TO IN THIS WORK AS A CITATION AND/OR A POTENTIAL SOURCE OF FUR-THER INFORMATION DOES NOT MEAN THAT THE AUTHOR OR THE PUBLISHER ENDORSES THE INFOR-MATION THE ORGANIZATION OR WEBSITE MAY PROVIDE OR RECOMMENDATIONS IT MAY MAKE. FURTHER, READERS SHOULD BE AWARE THAT INTERNET WEBSITES LISTED IN THIS WORK MAY HAVE CHANGED OR DISAPPEARED BETWEEN WHEN THIS WORK WAS WRITTEN AND WHEN IT IS READ.
For general information on our other products and services, please contact our Customer Care Department within the U.S. at 800-762-2974, outside the U.S. at 317-572-3993, or fax 317-572-4002. For technical support, please visit www.wiley.com/techsupport.
Wiley also publishes its books in a variety of electronic formats. Some content that appears in print may not be available in electronic books.
Library of Congress Control Number: 2006939501 ISBN: 978-0-470-11344-8
About the Author
Arthur Griffithis a computer programmer and a writer. He is the author of eleven books and the coauthor of three. His education was many years ago in a land far away, and he has a degree in Computer Science and Mathematics.
During his years as a computer programmer, he developed systems as varied as nuclear power plant construction accounting, missile guidance, remote control of cable-TV set-top boxes, and satellite communications control. All the work he did with computer programming required the use of mathemat-ics and the ability to explain complex concepts in simple language.
He moved to Alaska in an attempt to retire, but failed. He is now developing software for Kachemak Research Development and writing books, like this one.
Dedication
To Colleen Riley of Kachemak Research Development for helping me reach the pinnacle of becoming the Dummy of my dreams.
Author’s Acknowledgments
Susan Pink is as much an author of this book as I am. She has the ability of taking a clunky, obscure, and badly worded thought and turning it into some-thing that is easy to read. Whenever you come across somesome-thing in this book that is clear and understandable, you can bet she had a hand in making it that way.
I would like to thank Melody Lane at Wiley Publishing for having faith that I could write this book. I would also like to thank Margot Maley Hutchinson at Waterside for helping convince Melody Lane that I could write the book.
Allen Wyatt contributed to the book by checking it for accuracy. I owe him a great thanks, but it’s hard to be nice to some who uncovered so many of your mistakes.
Throughout the entire process, Jill Reitma at SPSS was very efficient and went to a great deal of trouble to make sure I had all the information and soft-ware I needed. Several people at SPSS made themselves available to me and answered even my silliest questions. The SPSS support group never left me in need of information.
Some of the people who helped bring this book to market include the following:
Acquisitions, Editorial, and Media Development
Project Editor:Susan Pink
Acquisitions Editor:Melody Layne
Technical Editor:Allen Wyatt, Discovery Computing, Inc.
Editorial Manager:Jodi Jensen
Media Development Specialists:Angela Denny, Kate Jenkins, Steven Kudirka, Kit Malone
Media Development Coordinator:
Laura Atkinson
Media Project Supervisor:Laura Moss
Media Development Manager:
Laura VanWinkle
Editorial Assistant:Amanda Foxworth
Sr. Editorial Assistant:Cherie Case
Cartoons:Rich Tennant (www.the5thwave.com)
Composition Services
Project Coordinator: Heather Kolter
Layout and Graphics:Carl Byers,
Barbara Moore, Laura Pence, Ronald Terry
Proofreaders: Laura Albert, Aptara
Indexer: Aptara
Anniversary Logo Design:Richard Pacifico Special Help: Laura Bowman
Publishing and Editorial for Technology Dummies
Richard Swadley,Vice President and Executive Group Publisher
Andy Cummings,Vice President and Publisher
Mary Bednarek,Executive Acquisitions Director
Mary C. Corder,Editorial Director
Publishing for Consumer Dummies
Diane Graves Steele,Vice President and Publisher
Joyce Pepple,Acquisitions Director
Composition Services
Gerry Fahey,Vice President of Production Services
Contents at a Glance
Introduction ...1
Part I: The Fundamental Mechanics of SPSS ...7
Chapter 1: Introducing SPSS ...9
Chapter 2: Installing and Running the Software ...17
Chapter 3: A Simple Statistical Analysis Example ...41
Part II: Getting Data into and out of SPSS...59
Chapter 4: Entering Data from the Keyboard ...61
Chapter 5: Reading and Writing Files...75
Chapter 6: Data and Data Types ...91
Chapter 7: Messing with the Data After It’s in There ...103
Chapter 8: Getting Data out of SPSS...123
Part III: Graphing Data...137
Chapter 9: Fundamentals of Graphing ...139
Chapter 10: Some Types of Graphs ...157
Chapter 11: More Types of Graphs ...175
Chapter 12: Maps...195
Part IV: Analysis ...211
Chapter 13: Executing an Analysis ...213
Chapter 14: Some Analysis Examples ...229
Part V: Programming SPSS with Command Syntax...245
Chapter 15: The Command Syntax Language ...247
Chapter 16: Command Syntax Language Examples ...259
Part VI: Programming SPSS with Python and Scripts...271
Chapter 17: The Python Programming Language...273
Chapter 18: Python inside SPSS...289
Table of Contents
Introduction...1
About This Book...1
About the Data...2
Who This Book Is For ...2
How This Book Is Organized...2
Part I: The Fundamental Mechanics of SPSS...3
Part II: Getting Data into and out of SPSS ...3
Part III: Graphing Data ...3
Part IV: Analysis...3
Part V: Programming SPSS with Command Syntax ...4
Part VI: Programming SPSS with Python and Scripts ...4
Part VII: The Part of Tens ...4
Icons Used in This Book...4
Where to Go from Here...5
Part I: The Fundamental Mechanics of SPSS...7
Chapter 1: Introducing SPSS . . . .9
Garbage In, Garbage Out ...9
From Whence SPSS?...10
The Four Ways to Talk to SPSS ...11
The Things You Can and Cannot Do with SPSS ...12
How SPSS Works...12
All the Strange Words ...14
All Those Files ...14
Where to Get Help When You Need It...15
Your Most Valuable Possession...16
You Can Dive As Deep As You Want to Go ...16
Chapter 2: Installing and Running the Software . . . .17
Getting SPSS into Your Computer ...17
The things you need ...18
Cranking up the installer ...18
The SPSS installation sequence...19
Registration...25
Starting SPSS...26
The Default Settings and What They Can Become ...27
General options ...28
Viewer options...29
Draft viewer options ...31
Chart options ...33
Interactive chart options...34
Pivot table options ...35
A few data-handling options ...36
Currency formats...37
Scripts options...39
Chapter 3: A Simple Statistical Analysis Example . . . .41
When the Tanana at Nenana Thaws ...41
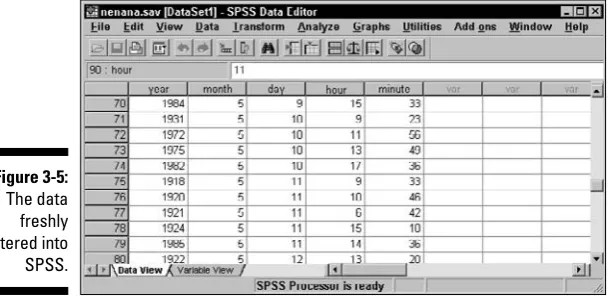
Entering the Data ...42
The data definitions ...42
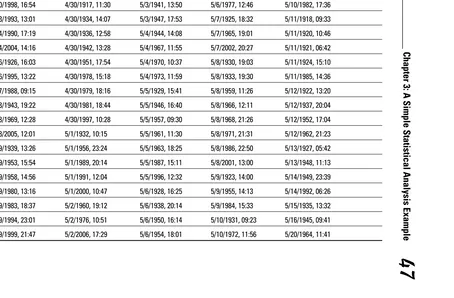
The actual data ...46
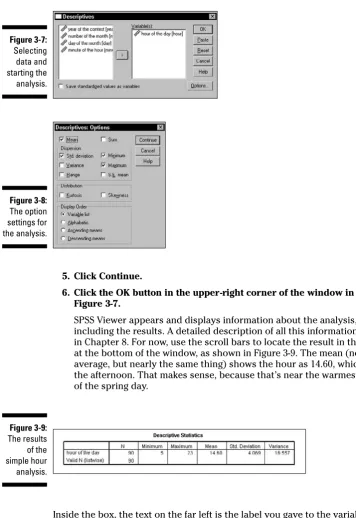
The Most Likely Hour ...49
Transforming Data ...51
The Two Kinds of Numbers ...54
The Day It Is Most Likely to Happen...56
Part II: Getting Data into and out of SPSS ...59
Chapter 4: Entering Data from the Keyboard . . . .61
The Variable View Is for Entering Variable Definitions...61
Name ...62
The Data View Is for Entering and Viewing Data Items ...71
Filling In Missed Categorical Values...72
Chapter 5: Reading and Writing Files . . . .75
The SPSS File Format ...75
Formatting a Text File for Input into SPSS ...76
Reading Simple Data from a Text File ...76
Transferring Data from Another Program...84
Reading from an unknown program type...85
Reading an Excel file ...85
Reading from a known program type...87
Chapter 6: Data and Data Types . . . .91
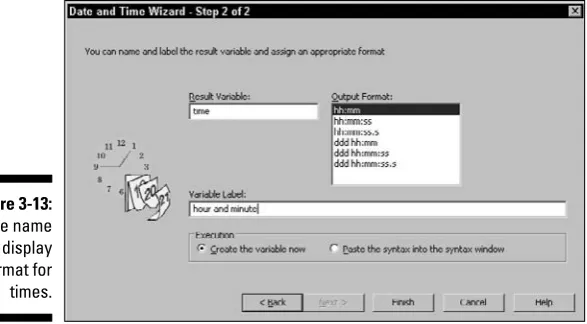
Dates and Times ...91
Time Schedule ...94
Creating a Multiple Response Set ...96
Copying Data Properties ...99
Chapter 7: Messing with the Data After It’s in There . . . .103
Sorting Cases ...103
Using an ID to Identify Cases ...106
Counting Case Occurrences ...107
Recoding Variables...111
Same-variable recoding ...111
Different variable recoding ...113
Automatic recoding...115
Binning...117
Chapter 8: Getting Data out of SPSS . . . .123
Printing ...123
Exporting to a Database ...124
Using SPSS Viewer...124
Creating an HTML Web page file ...126
Creating a text file ...127
Creating an Excel file...129
Creating a Word document file ...130
Creating a PowerPoint slide document ...132
Creating a PDF document ...133
Part III: Graphing Data ...137
Chapter 9: Fundamentals of Graphing . . . .139
Building Graphs the Easy Way...140
Gallery tab ...140
Basic Elements tab ...142
Groups/Point ID tab ...145
Titles and footnotes tab ...146
Element Properties dialog box ...146
Options ...151
Building Graphs the Fast Way...152
Building Graphs the Old-Fashioned Way...153
Editing a Graph...154
xi
Chapter 10: Some Types of Graphs . . . .157
Line Chart...157
Simple line chart...158
A chart with multiple lines...159
Scatterplots...160
A simple scatterplot...160
Scatterplot showing multiple variables...162
Three-dimensional scatterplot ...163
Dot plot ...164
Scatterplot matrix ...165
Drop-line chart...165
Bar Graphs ...167
Simple bar graph ...167
Clustered bar chart ...168
Stacked bar chart ...169
Three-dimensional bar chart ...171
Error bars ...172
Dual Y-axes with categorical X-axis...191
Dual Y-axes with scale X-axis ...192
Chapter 12: Maps . . . .195
Relating Geography and Data ...195
Part IV: Analysis...211
Chapter 13: Executing an Analysis . . . .213
Report Generation ...213
Processing summaries ...214
Case summaries...214
Summaries in rows ...217
Summaries in columns...221
One-sample T test ...231
Independent-samples T test...232
Paired-samples T test...233
One-way ANOVA ...233
Linear model ...234
One variable ...234
More than one variable...235
Correlation ...237
Part V: Programming SPSS with Command Syntax ...245
Chapter 15: The Command Syntax Language . . . .247
The Execution of Commands...251
Flow Control and Conditional Execution ...252
Files ...256
Writing a Syntax Command Program...259
Saving and Restoring Programs ...261
Adding a Syntax Program to the Menu...261
Doing Several Things at Once...265
Graphing P-P and Q-Q Plots ...266
Splitting Cases ...267
Examining Data...269
Part VI: Programming SPSS with Python and Scripts ...271
Chapter 17: The Python Programming Language . . . .273
You Type It In and Python Does It...273
The Way Python Does Arithmetic ...274
The Way Python Handles Words ...276
The Way Python Handles Lists...280
Making Functions ...281
Asking Questions with if...283
Doing It Over Again with forand while...285
Chapter 18: Python inside SPSS . . . .289
Installing Python for SPSS ...289
A Language inside a Language...294
Finding out about modules ...295
Installing more modules ...296
Multiple Commands with One Submit...296
Working with SPSS Variables ...297
Accessing SPSS from Outside ...298
Chapter 19: Scripts . . . .299
Picking Up BASIC...299
Scripting Fundamentals...300
Software classes, objects, and references...300
The classes of SPSS ...301
Properties and methods ...302
Creating a New Script ...304
Global Procedures...305
Part VII: The Part of Tens...307
Chapter 20: Ten Modules You Can Add to SPSS . . . .309
Geoset Manager...309
Amos ...310
Missing Value Analysis ...310
Regression Models ...311
Advanced Multivariate Models ...311
Exact Tests ...312
SPSS Categories ...312
SPSS Trends ...313
SPSS Map ...313
SPSS Complex Samples...314
Chapter 21: Ten Useful Things You Can Find on the Internet . . . .315
SPSS Humor...316
The SPSS Home Page ...316
SPSS Developer Center ...316
User Groups ...317
Mailing Lists and News Groups ...317
Python Programming...318
Script and Syntax Programming...319
Tutorials for SPSS and Statistics ...319
SPSS Wiki ...321
PSPP, a Free SPSS...321
Glossary ...323
Index...331
xv
Introduction
G
ood news! You don’t have to know diddly-squat about statistics to be able to come up with well-calculated conclusions and display them in fancy graphs. All you need is the SPSS software and a bunch of numbers. This book shows you how to type the numbers and produce brilliant statistics. It really is as simple as that.About This Book
This is fundamentally a reference book. Parts of the book are written as stand-alone tutorials to make it easy for you to get into whatever you’re after. After you’re up and running with SPSS, you can skip around and read just the sections you need. You really don’t want to read straight through the entire book. That way leads to boredom. I know — I went straight through every-thing to write the book, and believe me, you don’t want to do that.
The book was designed to be used as follows:
1. Read the opening chapter so you’ll understand what SPSS is. I tried to leave out the boring parts.
2. If SPSS is not already installed, you may need to read about installing it. 3. Read the stuff in Chapter 4 about defining variables and entering data. It
all makes sense after you get the hang of it, but the process seems to be kind of screwy until you see how it works.
4. Skip around to find the things you want to do.
I would mention that you could skip the introduction, but it’s too late for that. Besides, you’ll find some information here that could be useful.
However, if you decide to study the techniques of statistical calculation, you’ll be able to understand what SPSS does to produce numbers. Your main advantage in understanding the process to that degree of detail is that you’ll be able to choose a calculation method that more closely models the reality you are trying to analyze — if you are interested in reality.
About the Data
Throughout the book you will find examples that use data stored in files. These files are freely available to you. The files are either installed with SPSS in the SPSS installation directory at \Program Files\SPSS(unless you chose another location during installation) or designed for this book and available on the following Web site:
www.dummies.com/go/spss
You can also find the files at my Web site:
www.belugalake.com/spss
Different kinds of files are available. Most are data files used to demonstrate statistical calculations, and some are programming source code files. (Would you believe you have a choice of three programming languages inside SPSS?)
Who This Book Is For
In general terms, this book is for anyone new to SPSS. No prior knowledge of statistics or mathematics is needed or even expected. In specific terms, this book was written with two groups in mind: students who are not majoring in mathematics but are instructed to use SPSS and office workers who are instructed to use SPSS.
For most people generating statistics, the complexity of using the software becomes an obstacle. My purpose in writing this book is to show you how to move that obstacle out of the way with minimum effort.
How This Book Is Organized
The book is filled with step-by-step procedures that you can follow to see how SPSS operates. After you use the provided sample data and step through an example, you will understand how to apply the example to your data.
The parts of the book divide the information about SPSS into its major cate-gories. The chapters in each part further divide the information into smaller categories.
Part I: The Fundamental
Mechanics of SPSS
The first part is the only one intended to be read straight through. You can gloss over the installation, if you already have SPSS installed, but you will need to familiarize yourself with the configuration options. You will come across these configurations later and will need to know what can be changed. This is the only place in the book where you will find a complete example — starting with the entering of gathered data and ending with the generation of rudimentary analyses.
Part II: Getting Data into and out of SPSS
Input can be tricky. Variables are defined by type and size and a few other things. Part II shows you how to enter data through the main SPSS window or load it from a file. In fact, you can read data from several kinds of files. You can also write data to several kinds of files.
Part III: Graphing Data
In Part III you see how to produce graphs. A large part of the job performed by SPSS is displaying data in graphic formats. SPSS can produce lots of differ-ent kinds of graphs and maps. Fortunately, it’s an easy thing to do — you simply select variable names and how you want them displayed.
Part IV: Analysis
Hidden down inside SPSS are lots of statistical methods. This thing manufac-tures numbers like McDonald’s manufacmanufac-tures hamburgers. Part IV explains how to manufacture the numbers you want.
3
Part V: Programming SPSS
with Command Syntax
Part V shows you how to use the SPSS internal command language. You can record procedures in Command Syntax and execute them at will. You can do anything with a Command Syntax program that you can do with the mouse and keyboard.
Part VI: Programming SPSS
with Python and Scripts
Part VI is BASIC talk about programming and scripting SPSS. Anything you can do with Command Syntax or with the mouse and keyboard, you can also do in the Python programming language. The scripting language of SPSS is Sax BASIC.
Part VII: The Part of Tens
Part VII is all about the add-ons for SPSS and the locations on the Internet where you can find useful stuff.
Icons Used in This Book
You should remember this information. It is important to what you are doing.
Skip these unless the text makes you curious. This icon highlights unneces-sary information, but I had to include it to complete the thought.
A tip highlights a point that can save you time and effort.
Where to Go from Here
Read the first chapter. Then, if necessary, install SPSS, referring to Chapter 2. Work through the example in Chapter 3.
Now you’re up and running. Figure out what you want to do and refer to the sections of the book necessary to do that. For some tasks (such as program-ming Python), you need to read an entire chapter. For other jobs, you need to read only a single section.
5
Part I
The Fundamental
Mechanics
T
his is a look at SPSS from 10,000 feet. Even if you know nothing whatsoever about SPSS, after you read this part you will have a good idea of how it all works. You won’t know about all the details, but you will have a clear understanding of the general operation of SPSS. Everything else you find out about SPSS will fit in the structure you build for yourself by reading Part I.Chapter 1
Introducing SPSS
“T
here are three kinds of lies: lies, damn lies, and statistics.” That state-ment is often attributed to Mark Twain, but that’s not quite right. Mark Twain did say it, but he attributed it to someone else. He indirectly attributed it to Disraeli, but his attribution was vague, and the original statement, if it exists, can’t be located. Speaking statistically, the odds are in favor of us never knowing who said it first.Garbage In, Garbage Out
Statistical analysis is like a sewer. What you get out of it largely depends on what you put into it.
Over 82 percent of all statistics are made up on the spot to try to prove a point.
You can conclude just about anything if you’re not careful with your data and with your calculations. SPSS watches the performance of the calculations for you, but the raw data, and which calculations should be performed, is up to you.
Let me show you a simple example of using raw data to produce an obviously wrong conclusion. Suppose you want to demonstrate, by sampling, that every odd number is prime. (A prime number can be evenly divided only by 1 and itself.) The first thing to do is gather a collection of data points, as shown in Table 1-1.
Table 1-1
Odd Numbers and Whether They Are Prime
Number Prime? Comment
1 Yes It fits the definition exactly
3 Yes It is certainly both odd and prime
5 Yes It fits the pattern of primes
Table 1-1 (continued)
Number Prime? Comment
7 Yes So far, so good
9 No Must be a bad data point, so throw it out
11 Yes Now we’re back on track
13 Yes Looking good
Lots of things are already wrong with the data in Table 1-1. For one, the sample is too small. For another, the sampling cannot be considered random. All too often it happens that data points don’t fit a preconceived conclusion, so they are omitted. The result of the data in this table can be used as proof of a fact that is dead wrong.
This book is not about the accuracy, correctness, or completeness of the input data. Your data is up to you. This book shows you how to take the numbers you already have, put them into SPSS, crunch them, and display the results so it all makes sense. Gathering valid data and figuring out which crunch to use is up to you.
From Whence SPSS?
SPSS is probably older than you are. In 2007 it becomes 38 years old, and the average age of an American is 35.3.
At Stanford University in the late 1960s, Norman H. Nie, C. Hadlai (Tex) Hull, and Dale H. Bent developed the original software system named Statistical Package for the Social Sciences (SPSS). They needed to analyze a large volume of social science data, so they wrote software to do it. The software package caught on with other folks at universities and, with the open source tradition of the day, the software spread through universities around the country.
The three men produced a manual in the 1970s and the software’s popularity took off. A version of it existed for each of the different kinds of mainframe computers of the time. Its popularity spread from universities into other areas of government, and it began to leak out into private enterprise.
In the 1980s, a version of the software was moved to the personal computer, and here we are today.
The Four Ways to Talk to SPSS
More than one way exists for you to command SPSS to do your bidding. And you don’t have to choose one and stick with it — you can perform tasks using whichever of the four interfaces you prefer. You can use any of the four approaches to perform any of the SPSS functions, but which one is best for you depends, to an extent, on the task to be performed and which interface you prefer:
⻬GUI (graphic user interface):SPSS has a windowing interface and com-mands can be issued by the mouse through menu selections that cause dialog boxes to appear. This is a fill-in-the-blanks approach to statistical analysis that guides you through the process of making choices and selecting values. The advantage of the GUI approach is that, at each step, SPSS will make sure that you enter everything necessary before proceeding to the next step. This is the preferred interface for those just starting out — and if you don’t do much with SPSS, this may be the only interface you ever use.
⻬Syntax:This is the internal language used to command actions from SPSS. It was known as the command syntax of SPSS, hence its name. It is often referred to as the command language. You can write Syntax com-mands to directly command SPSS to do anything it is capable of doing. In fact, when you use menu and dialog box selections to command SPSS, you are actually generating Syntax commands internally that do your bidding. That is, the GUI is nothing more than the front end of a Syntax command-writing utility. Writing (and saving) command language pro-grams is a good way to store processes that you expect to repeat. You can even grab a copy of the Syntax commands generated by the GUI and save them to be repeated later.
⻬Python:This is a general-purpose language that has a collection of SPSS modules written for it, making it possible to write programs that work inside SPSS. It can be run with the Syntax language to command SPSS to perform statistical functions. One advantage of using Python is the fact that it is a modern language and gives you the power and convenience that come with languages today, including the ability to construct a more readable program. In addition, because it’s a general-purpose language, you can read and write data from other applications and from other files.
⻬Scripts:The items that SPSS calls scripts are actually programs written in BASIC. This language is simple and many people are familiar with it. Also, a BASIC program can be written as an autoscript— a script that executes automatically when SPSS produces certain output.
11
The Things You Can and
Cannot Do with SPSS
The full-blown SPSS package comes in many parts. The Base system is the center around which the rest of SPSS revolves. You have a Base system. You may also have one or more add-ons. With only one exception, everything described in this book is included in the Base system, so you will be able to do anything you read about. The one exception is the Python programming language, which requires some additional software. But the software is a free download and also comes on the SPSS distribution CD. Chapter 20 describes other modules you can add to your Base system.
SPSS works with numbers. Only. If you cannot express your information as a number, you can’t run it through SPSS. You will see names and descriptions seemingly being processed by SPSS, but that’s because each name has been assigned a number. That’s why survey questions are written like, “How much do you enjoy eating rhubarb? Select your answer: Very much, sort of, don’t care, not really, I hate the stuff.” A number is assigned to each of the possible answers, and these numbers are fed through the statistical process. SPSS uses the numbers, not the words, so be careful about keeping all your words and numbers straight.
You must keep accurate records describing your data, how you got the data, and what it means. SPSS can do all the calculations for you, but only you can decipher what it means. In Hitchhiker’s Guide to the Galaxy,a computer the size of a planet crunched on a problem for generations and finally came out with the answer, 42. But the people tending the machine had no idea what the answer meant because they didn’t remember the question. They hadn’t kept track of their input. You must keep careful track of your data or you may later discover, for example, that what you have interpreted to be a simple increase is actually an increase in your rate of decrease. Oops.
SPSS lets you enter the data and tag it to help keep it organized, but you already have the data written down someplace and fully annotated. Don’t you?
How SPSS Works
You always begin by defining a set of variables,then you enter data for the variables to create a number of cases.For example, if you are doing an analysis of automobiles, each car in your study would be a case. The vari-ables that define the cases could be things such as the year of manufacture, horsepower, and cubic inches of displacement. Each car in the study is defined as a single case, and each case is defined as a set of values assigned to the collection of variables. Every case has a value for each variable. (Well, you can have a missing value, but that’s a special situation described later.)
Variables have types. That is, each variable is defined as containing a specific kind of number. For example, a scalevariable is a numeric measurement, such as weight or miles per gallon. A categoricalvariable contains values that define a category; for example, a variable named gendercould be a categori-cal variable defined to contain only values 1 for female and 2 for male. Things that make sense for one type of variable don’t necessarily make sense for another. For example, it makes sense to calculate the average miles per gallon, but not the average gender.
After your data is entered into SPSS — your cases are all defined by values stored in the variables — you can run an analysis. You have already finished the hard part. Running an analysis on the data is much easier than entering the data. To run an analysis, you select the one you want to run from the menu, select appropriate variables, and click the OK button. SPSS reads through all your cases, performs the analysis, and presents you with the output.
You can instruct SPSS to draw graphs and charts the same way you instruct it to do an analysis. You select the desired graph from the menu, assign vari-ables to it, and click OK.
When preparing SPSS to run an analysis or draw a graph, the OK button is unavailable until you have made all the choices necessary to produce output. Not only does SPSS require that you select a sufficient number of variables to produce output, it also requires that you choose the right kinds of variables. If a categorical variable is required for a certain slot, SPSS will not allow you to choose any other kind. Whether the output makes sense is up to you and your data, but SPSS makes certain that the choices you make can be used to produce some kind of result.
All output from SPSS goes to the same place — a dialog box named SPSS Viewer. It opens to display the results of whatever you’ve done. After you have output, if you perform some action that produces more output, the new output is displayed in the same dialog box. And almost anything you do produces output.
13
All the Strange Words
Statistics seems to have been born in the land of strange words. Lots of them. If you come across a term that you don’t understand, such as dichotomy, vari-able,or kurtosis,you can look it up in the glossary at the back of the book.
It’s not only new words that can trip you up. You will find common words used in a special way. For example, a break variablehas a special purpose when organizing tabular data.
The glossary is always there, ready to explain the meaning of those strange terms.
All Those Files
Input data and statistics are stored in files. Different kinds of files. Some files contain numbers and definitions of numbers. Some files contain graphics. Some files contain both.
The examples in this book require the use of files that contain data config-ured to demonstrate capabilities of SPSS. These files are all in one of two places. Most are in the same directory you use to install SPSS. That is, the action of installing SPSS also installs a number of data files ready to be loaded into SPSS and used for analysis. A few of the files used in the examples can be found in the compressed file spss.zipfound at this Web site:
www.dummies.com/go/spss
You can also get the files from the author’s Web site:
www.belugalake.com/spss
After you have downloaded the zip file to your system, you need to decom-press (unzip) it into separate files and directories. If you don’t have an unzip-per, and would like to get one, enter the search word unzipinto Google. There are free ones and commercial ones. A popular commercial product that runs as a windowing program and uses mouse controls can be found at the follow-ing Web site:
http://www.winzip.com
If you want, the Web site is configured so that you can download the files in the form ready to be used. Doing it this way is a bit easier, but only if you don’t need all the files. Each file will have to be downloaded individually.
Where to Get Help When You Need It
You’re not alone. Some immediate help comes directly from the SPSS soft-ware package, and other help can be found on the Internet. If you find your-self stumped on some point, you can look in several places:⻬Topics:Choosing Help➪Topics from the main window of the SPSS appli-cation is your gateway to immediate help. The help is somewhat terse, but it will often be exactly what you need. You will find all the informa-tion in one large help document, presented to you one page at a time. Choose Contents to select a heading from an extensive table of contents, choose Index to search for a heading by entering its name, or choose Search to enter a string search inside the body of the help text. In the help directory, the titles in all uppercase are descriptions of Syntax language commands.
⻬Tutorial:Choose Help➪Tutorial to open a dialog box with the outline of a tutorial that guides you through many parts of SPSS. You can start at the beginning and view each lesson in turn, or you can select your sub-ject and view just that.
⻬Case Studies:Choose Help➪Case Studies to open a dialog box contain-ing examples in a format similar to that of the Tutorial selection. You can select titles from its outline and view descriptions and examples of spe-cific instances of using SPSS. You will also find descriptions of the differ-ent types of calculations. This is a good place to look if some particular analysis type is eluding your comprehension.
⻬Statistics Coach: Choose Help➪Statistics Coach if you have a good idea of what you want to do but need some specific information on how to go about doing it.
⻬Command Syntax Reference:Choose Help➪Command Syntax Reference to display more than 2000 pages of references to the Syntax language in your PDF viewer. The regular help topics, mentioned previously, provide a brief overview of each topic, but this document is much more detailed.
⻬Python:Choose Help➪Programmability to display a 100-page PDF docu-ment on programming SPSS using Python.
15
Your Most Valuable Possession
The most valuable possession you have in dealing with statistics is not your computer. It’s not your SPSS software. It’s not this book, or any other book you may be using to learn statistics. You can lose any one of those, but any one of them can be replaced.
Your most valuable possession is your data. Sure, you can always go and get more data, but you can’t go and get the same data. The world doesn’t hold still long enough. Make sure you make backup copies of your data.
Back up your data to memory that does not live in the same building with the computer you are using. You can swap backups with a friend, or if you have access to a remote Web site, you can stuff files in a blind directory.
This message about backing up your data comes to you from someone who has been stung. Twice. And I don’t want to talk about it again. Ever.
You Can Dive As Deep As You Want to Go
SPSS makes no effort to keep anything a secret. It is designed to be as easy to use as possible, so you really don’t have to know that much to make it work. However, if you want to understand how things are working internally, you can find out if you dig. And you don’t have to dig very far. Choosing Help is the first step to finding out anything you want to know about what’s going on inside.Let’s say you are working on your numbers and want to use some specific algorithm to do your calculations. SPSS has been at this longer than you have, so the algorithm you want to use is almost certainly built in. If you are not sure exactly what SPSS is doing to calculate some of the numbers, you can go to the Help menu and the PDF documents on the documentation CD to find out how the calculations are being performed. But, before you start look-ing, make sure you really want to know because the equations and how they are applied are explained in excruciating detail.
Chapter 2
Installing and Running
the Software
In This Chapter
䊳Installing SPSS 䊳Getting SPSS to run
䊳Understanding your configuration options
T
his chapter is all about installing your software and setting the options that determine how it works. If the software you’ll be using is already installed, you can skip the first part of this chapter. That is, don’t install the software if it’s already installed. I mention that only because this is a For Dummiesbook and I was told not to leave anything out.The installation process guides you, step by step, and then does most of the work itself. The configuration settings all default to something reasonable, so the only ones you might want to change are the ones you have some gripe with. I suggest leaving them alone for now.
Getting SPSS into Your Computer
Soap powder comes in boxes, paint comes in cans, corn dogs come on sticks, and SPSS comes on CDs. Two CDs. Open the package in which it came and read the labels on the CDs, and you’ll see that one contains the SPSS software and the other contains documentation. The CD with the software also contains some other stuff, which is listed on the CD label, but you can ignore that for right now.
The Mac version of the software is similar, but details of the installation procedure described here are specific to Windows.
The things you need
You won’t have to worry about the minimum requirements for the computer — unless yours is an antique. I mean, who doesn’t have at least 256MB of RAM and 300MB of free disk space?
SPSS comes in a variety of flavors. They’re fundamentally alike, but some versions have more parts than others. You may have all, some, or none of the add-ons described in Chapter 20. In any case, you need an authorization code to enable whatever you do have. You may have more than one authorization code — it depends on how your SPSS system is configured, which is deter-mined by what parts are included with it.
Remember those bits of paper I warned you to keep track of? You will find your authorization code, or codes, somewhere there. Go ahead and find them now.
For the installation procedure to work, you must be logged in to your Windows system with administrator privileges. You don’t have to be logged in as an administrator, but whatever login you are using must have the privi-leges that the administrator has.
You should also be connected to the Internet. You can install SPSS without being connected, but it’s a pain to do it that way. Make it easy on yourself and connect your computer to the Internet before you start. And keep it connected at least until you get SPSS installed.
In summary, before you begin the installation:
⻬You must have access to your authorization code or codes. ⻬You must have access to the serial number of your copy of SPSS. ⻬You may also need to have access to your customer number.
⻬You must be logged into your computer with administrator privileges. ⻬For convenience, you probably want to be connected to the Internet.
Cranking up the installer
You can start the installer in two ways. The first method is automatic: You insert the SPSS CD into the drive and wait a bit. Most Windows computers will recognize what’s on the CD and start the installer. If the installer doesn’t start automatically (or if you fool around and close the window after it started), choose Start➪Run and execute the program on the CD named setup.exe. Either way, you get the window shown in Figure 2-1.
As you can see in Figure 2-1, it’s possible to install several items, some of which you may have never even heard of. Stick with me and you’ll hear about all of them eventually. For starters, however, we’ll look at the simple case of a single-user installation of SPSS.
The SPSS installation sequence
With the window shown in Figure 2-1 on your screen, click the words Install SPSS, at the very top of the list. The computer makes a sort of boink sound (if speakers are attached) and you are informed that something called InstallShield is preparing itself. While InstallShield is getting ready, it displays some animation on the screen to indicate that progress is being made. The software that will install SPSS is getting itselfinstalled. When it’s finally satis-fied that everything is okay for the installation to proceed, it pops up the window shown in Figure 2-2. We’ll be installing the software for a single user, so choose the Single User License option and then click Next. If you need to make an installation for multiple users, arrangements would have been made at the time of the purchase of SPSS and your administrator would have sup-plied you with the necessary information. If you arethe administrator and you don’t know what you should do, you need to get in touch with SPSS. The instructions in this book are for a simple installation.
Figure 2-1:
The first window is a list of installation choices.
19
After you make your selection, you’re greeted by the license, as shown in Figure 2-3. Simply do what it says: Read the license and if you accept the terms, select the I Accept the Terms in the License Agreement option and then click the Next button.
Figure 2-3:
The license agreement you have with SPSS.
Figure 2-2:
Now the installation gets talky, as shown in Figure 2-4. If you thought the license was something, wait until you read this stuff. Not all of it will apply to you, but you should read it anyway because you might find something you need, such as the Klingon numbering system. After you’ve gained all the pleasure you can stand from the ReadMe file, click Next to move on.
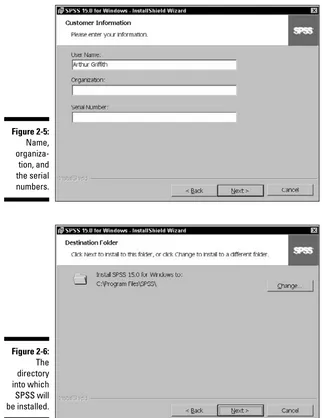
The next screen, shown in Figure 2-5, asks for your name and organization. I always take it as a compliment that the software thinks of me as being organized, but I can never figure out what to put in the blank. You can put anything you like in there, but keep it clean because it could pop up on the screen one afternoon while your mom is watching. The third piece of infor-mation is a little more important. It wants you to enter the serial number of your copy of the software. This is notthe authorization code — that comes later. You can find the serial number in two places: on a tag inside the plastic box in which you found the CD and on the cardboard stiffener that came inside the mailing package. See, I told you not to throw anything away.
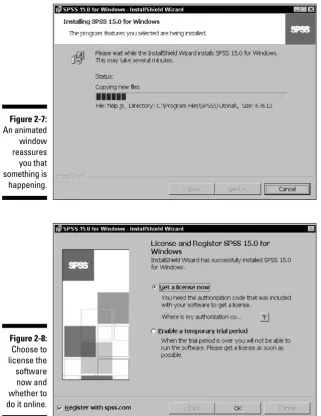
When you click the Next button, you get the window shown in Figure 2-6, which asks for the directory into which SPSS will be installed. The directory it chooses is fine, and you should change it only if you have a really good reason. If you can’t think of a reason, accept what’s there and move on by clicking the Next button.
Figure 2-4:
The ReadMe notes contain the last-minute, “Oh, by the way” thoughts.
21
This displays a window that asks you whether you want to install SPSS. All you’ve done so far is answer some questions; nothing has been installed. This window has a Back button you can use to go back and change your answers. The Next button unleashes the installation software onto your computer. The screen also has a Cancel button if you chicken out or if you enjoyed the process so much that you want to drop everything and do the entire thing over again. You want SPSS on your computer, so click Next.
Figure 2-6:
The directory into which SPSS will be installed.
Figure 2-5:
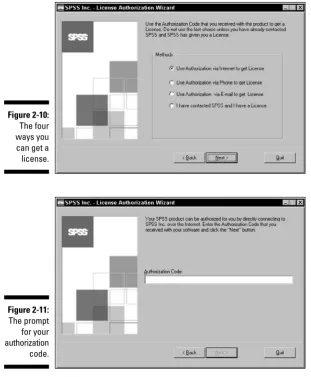
The next window, shown in Figure 2-7, lists every file being installed, while a progress indicator moves across the screen. The file names flicker by pretty fast; only Superman or Data from Star Trek can read them. Normal mortals see mostly a line of constantly flickering letters.
The progress indicator marches across the screen until it reaches the far right. At that point, the flickering of file names will stop. For a time, nothing moves. Be patient. Just about the time you start to wonder whether some-thing has gone wrong, the display presents the window shown in Figure 2-8.
Figure 2-8:
Choose to license the software now and whether to do it online.
Figure 2-7:
An animated window reassures you that something is happening.
23
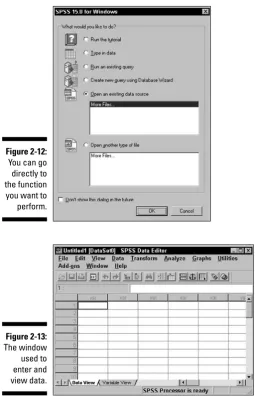
This is where it is convenient to be connected to the Internet. You need to select both options shown in Figure 2-8 if you want to enable your copy of SPSS. If you click the question mark button, you are told that you have the authorization code on one of your pieces of paper or maybe someone else has it. If you don’t have it, you might as well stop until you get it because the following steps require it. If you already have it, click OK and you will get the startup window of the License Authorization Wizard, shown in Figure 2-9.
If you want, you can read about the License Authorization Wizard by clicking the About button in Figure 2-9, but that won’t put you any closer to getting the software ready to run. To move forward with the installation, click Start.
Your software is installed, but you can’t use it because you don’t have a license. You need to get your license from the SPSS company, and to do that you need the authorization code that came in your software package. As you can see by the window in Figure 2-10, you have four ways of getting a license. You want the first choice — via the Internet.
Click Next, and the window shown in Figure 2-11 appears, asking for your authorization code. This is your big moment. Enter your authorization code exactly as it is printed on your piece of paper, and then click Next. If you enter the right code and are doing your licensing through the Internet, you are licensed in just a few seconds. The window changes to tell you that you’re doing it correctly, and a Finish button appears at the bottom. Click Finish and you’re out of there. You now have SPSS installed and ready.
Figure 2-9:
Registration
Now that SPSS is on your system and ready to run, that’s it, right? Not so fast. You need to register. When you finished your authorization, a Web site popped up displaying your contact information. This Web site enables you to correct and complete your information, so read it over carefully. It’s to your advantage to get the information right. For one, you can use the Web site to add your address to some useful mailing lists.
You may need one more number. It could be that your customer number is not recorded on the Web site, and if that’s the case you can enter it now. You will find it on one of those pieces of paper I told you to save — probably the same one that has your authorization code.
Figure 2-11:
The prompt for your authorization code.
Figure 2-10:
The four ways you can get a license.
25
The Internet being the Internet, your connection might get dropped right in the middle of getting registered. If that happens, you can get back in by going to the following Web site: http://www.spss.com/registration.
You have to use your e-mail address and a password to get back in. If you don’t know your password, you can have it e-mailed to you. People say you should memorize your password instead of writing it down, but trying to do that always gets me in trouble. I just write it on one of the pieces of paper I stash with the other SPSS stuff. It’s okay, though, because nobody in the world can read my handwriting.
Starting SPSS
You now have SPSS installed on your computer. You’ll find a listing for it with the other programs on your Start menu. Choose Start➪Programs➪SPSS for Windows. You then have three choices:
⻬SPSS for Windows
⻬License Authorization Wizard ⻬Production Mode Facility
The first choice is the main program itself and will be the number-one selection on your hit parade in days to come. The second choice is the authorization stuff you went through earlier. The third choice allows you to preset instruc-tions so you can run programs while you are off doing something else. For example, if you have an analysis you run every day to produce a report, you can set the analysis to run automatically. Later chapters go into all this. For now, let’s stick to the main activity, choice number one.
When you first start SPSS, you get a window like the one in Figure 2-12. This window makes it possible for you to go directly to the window you want to work with. The problem is that it assumes you already know what you want to do, but so far you have no idea what you want to do, so just click the Cancel button to close the window.
The Default Settings and
What They Can Become
Over time, you’ll find that you want to configure your system to work in ways you prefer. SPSS has lots of options that you can set to do just that. If you are new to this and have just started looking at the software, you probably don’t want to change many options just yet, but you need to have some idea of what they are and what you can do with them. Later, when you absolutely have to make some sort of change, you will know where to go to do it.
Figure 2-13:
The window used to enter and view data.
Figure 2-12:
You can go directly to the function you want to perform.
27
With the Data Editor on the screen (refer to Figure 2-13), choose Edit➪ Options to display the Options window. All possible options can be set in the Options window. At the top of this window are some tabs, and each tab selects a different collection of options. Sometimes a change in configuration doesn’t have an immediate effect. For example, if you change the way values are labeled in a report that’s already displayed, nothing happens because the report has already been constructed. You have to run the report-generating software again to have the changes take effect.
General options
The first tab in the Options window, the General tab, displays a dialog box with options that don’t fit into any of the categories defined by the other tabs. This tab is shown in Figure 2-14.
The options displayed by the General tab follow:
⻬Variable Lists: Lists of variables in your output can be identified by either their labels or their names. You can think of these as short titles and long titles, and you can have your data, by default, tagged by one or the other as they appear in lists. Also, you can have your data appear in alphabetical order by the title you use for it or simply by the order in which the data appears in the file. File order usually makes more sense.
Figure 2-14:
⻬Session Journal:Records a list of all commands executed on the data, in the order they are executed. You can select whether you want to erase the old journal file and start a new one each time and simply over-write the old one, or whether you just want to continuously append the new text onto the end of one long journal. You can also select the direc-tory and file name to become the journal.
⻬Temporary Directory:A workspace for SPSS. If you decide to change it, choose a place containing only files you don’t need.
⻬Recently Used File List:The files you’ve recently opened. The number specifies how many are listed on the menu.
⻬Open the Syntax Window at Start-up:Makes SPSS begin with the syntax window instead of the data editor. Choose this option if you use the scripting language more often than the windowing interface to enter data and run your predefined procedures.
⻬Output: Suppresses scientific notation for small numbers. For example, 12 appears as 12 instead of 1.2e1, which is a little harder to read. SPSS doesn’t say exactly what it considers to be a small number.
⻬Viewer Type at Startup:The viewer to generate at startup. In general, Regular produces a better layout for interactive displays and Draft is more suitable for output that will be written to a file.
⻬Measurement System:Units used to specify the margins between table cells, the width of cells, and the spacing between printed characters. You can use inches, centimeters, or the default, points. (A point is 1⁄
72of
an inch.)
⻬Language:Set to any one of about a dozen choices. It makes life easier if you choose a language you actually know how to read.
⻬Notification:The method the software uses to notify you when the results of a calculation are available. With the Raise Viewer Window option, the display window opens automatically. With the Scroll to New Output option, the window scrolls and exposes the location of the new data. You also can have the system beep, tweet, or sing when an analysis is complete. It’s considered impolite to have it make rude comments when an analysis finishes.
Viewer options
Output from SPSS is formatted for viewing with either the draft viewer or the regular viewer. SPSS thinks in terms of a printed page, but the same layouts are used for displaying data on the screen. The options you can set for the regular viewer can be accessed with the Viewer tab, shown in Figure 2-15.
29
The options in the Viewer tab follow:
⻬Initial Output State:Determines which items are displayed each time you run a procedure. You choose an item by either selecting its name (Log, Warnings, Notes, Title, and so on) from the pull-down list or by selecting its icon. Then you can select whether you want it to appear or remain hidden, how you want its text justified (Align Left, Centered, or Align Right), and whether the information occurrence should be included as part of the log (Display Commands in the Log).
⻬Title Font:The font used for main output titles. It appears at the top of the first page of a report.
⻬Page Title Font:The font used for the title appearing at the top of subsequent pages of a report.
⻬Text Output Page Size:Determined by your printer. The settings are not obvious with most printers, and you may have to experiment with the Width and Length options to get page size just right. It’s not your fault, it’s just the way printers are.
⻬Text Output Font:Determines the font used for the text of your report and labeling on graphs and tables. The font size will also have some effect on the page width and length because the sizes are measured in a count of characters. Note: Some fonts have variable-width characters, which will cause your columns not to align correctly. If you want every-thing to always align in neat columns, use a monospaced font.
Figure 2-15:
Draft viewer options
The draft viewer is a different and generally simpler format for the output of the analysis programs you run. The Draft Viewer options can be set using the window shown in Figure 2-16.
Following are the options in the Draft Viewer tab:
⻬Display Output Items:Determines what is included in draft output. You can have all the commands written to the log, which is how you can have a series of syntax language commands saved so you can copy them later and include them in your own scripts. Sneaky, eh? ⻬Page Breaks Between:Inserts page breaks between procedures and
between items.
⻬Font:Sets the size and type of the font. You can also force the font size to be changed automatically to make the output fit on a page, but when you do that, you also have to specify a maximum number of columns. ⻬Tabular Output:Uses tabs or spaces to separate columns in tables.
Some printers work swell with one but not so good with the other. If tabs work, you may not need to use a monospaced font to line up the columns — but tab spacing can cause other things to get wacky. If you use spaces to position your columns, line wrapping doesn’t happen and each column is set to the width of the longest string of characters that will fit in the column. But there is a maximum number of characters you can set for your columns. You’ll need to experiment to see what happens. How’s your paper budget?
Figure 2-16:
The window used to set the format of the output of the draft viewer.
31
Don’t expect tabbed columns to align on the display. But laying out formats with tabs can be handy for copying the values for pasting into another application.
⻬Repeat Column Headers:Repeats column headers at the top of each page.
⻬Display Box Character:Inserts box characters — a graphic square that can’t be mistaken for any number or letter — as separators between rows and columns. Without this option set, a vertical bar (|) separates columns and a minus sign (–) separates rows.
⻬Column Width:Sets the column width. You can do so only if you have selected Spaces to position the columns. If you specify Autofit, the column width is set to that of the longest label. If you specify a width, labels might wrap to another line.
⻬Text Output:Determines the size and whatnot of each page, but, here again, you have to experiment to see what happens.
Labeling output
Every variable can be identified in two ways: by a label and by a name. In your output, you can specify to have variables identified by one or the other or both. Output labeling is configured using the Output Labels tab, shown in Figure 2-17.
Figure 2-17:
Labeling of data can be set to
You can display the variable names, the variable labels, or both, along with the values for the variables. Longer labels can be descriptive and make your data easier to determine, but they can also screw up some formats. Following are the options in the Output Labels tab:
⻬Outline Labeling:The text used to identify the parts of charts and graphs. ⻬Pivot Table Labeling:The text used to identify the rows and columns
of tables.
Chart options
The default appearance of charts is determined by the settings in the Charts tab, shown in Figure 2-18.
The options in the Chart tab follow:
⻬Chart Template:A file that contains a set of starter settings that you can use for designing a new chart. When you create a new chart, it can use the settings in this configuration window, or it can use this file. You can select any file to be your default starting template. It’s easy to create a chart template: Simply create a chart that has all the configuration set-tings you like and save it so it can be used as the template file.
⻬Font:The default font for the text in any chart you design.
Figure 2-18:
Change the default appearance of a chart with these settings.
33
⻬Style Cycle Preference:How SPSS chooses the styles and colors when laying out data items in a chart. You can have SPSS cycle through colors only, which means that each item included in the graph is identified by its color. With a black and white printer or display, choose Cycle Through Patterns Only, in which each data item is identified by a graphic pattern of line styles and marker symbols.
⻬Style Cycles:Customizes the sequence of colors and patterns to be cycled through.
⻬Chart Aspect Ratio:The ratio of the width to the height of the produced charts, initially set to 1.25. It’s a matter of opinion what ratio looks better. This is another place where you will have to experiment. ⻬Launch JVM at Startup:Starts the Java Virtual Machine when SPSS
starts. SPSS starts more quickly if you turn off this option, but because some chart features use Java, the first chart you display using one of these features will take the delay hit.
⻬Frame:Determines whether charts display an inner frame, an outer frame, both, or neither.
⻬Grid Lines:Displays dividing lines on the scale axis, on the category axis, or on both.
Interactive chart options
An interactive chart can be embedded in another application as an ActiveX component. Some configurations apply only to interactive charts. These items can be set in the Interactive tab, shown in Figure 2-19.
Figure 2-19:
The options in the Interactive tab follow:
⻬ChartLook:For the construction of interactive charts. It is similar to a chart template, which is for static charts. You select the file that you want to use as the basis for the appearance of your new charts. Several predefined files come with the system and are included in the list in this window. You also can create your own file by choosing ChartLook from the menu of the interactive graphics editor and saving the file under a name you load in later as the default.
⻬Data Saved with Chart:Specifies whether you want the data saved with the chart and how. Saving the data with the chart makes it possible for you to reformat the data even after you’ve separated it from the data files. With the chart separated from the data, you can add new data fields and such, but you can include only data present when you saved the chart.
⻬Print Resolution:Prepares an image for the printer. The High Resolution selection looks better but takes longer to print than Low Resolution. The Vector Metafile selection is fairly rapid and produces good results. ⻬Measurement Units:Used to lay out items on the printed chart. ⻬Reading Pre-8.0 Data Files:Necessary for reading data files produced
by old versions of SPSS. You can have the read process assign a scale measurement level to any variable having at least the specified number of variables.
Pivot table options
The tabular output format of SPSS is the pivot table.An example is shown in Figure 2-20, which is the Pivot Tables tab used to set display options for the tables.
The options in the Pivot Tables tab follow:
⻬TableLook:A file that contains your standard pivot table and deter-mines the initial appearance of any new tables you create. Several such files come with the system and are listed in the window. You can also create your own file by choosing TableLook from the menu in the pivot table editor window.
⻬Set TableLook Directory:Sets the currently displayed directory as the one in which your new table files are stored. You can choose any direc-tory you like; clicking this button will cause your chosen direcdirec-tory to appear in this window by default.
35
⻬Adjust Column Widths For:Controls the way SPSS adjusts column widths in pivot tables. They can be adjusted according to the width of the labels or according to the width of the data or labels, whichever is wider. ⻬Default Editing Mode:Double-clicking a pivot table enables it for
edit-ing. This option determines whether that editing will be performed in place or in a separate window opened for the sole purpose of editing.
A few data-handling options
The Data tab, shown in Figure 2-21, can be used to specify how SPSS handles a few special numeric situations:
⻬Transformation and Merge Options:Determines when — not how — results are calculated. You can have SPSS perform calculations immedi-ately, or you can have it wait until it needs the number for something (either another calculation or a displayed value). Both methods have their advantages and disadvantages.
⻬Display Format for New Numeric Variables:Determines how many digits are used in the display of values and how many digits are to the right of the decimal. Width is the total number of characters, including the decimal point. The Decimal Places setting determines the number of digits that appear to the right of the decimal point. If the number of
Figure 2-20:
places to the right is too small, values are rounded to fit. If the number of places is too large, values are put into scientific notation.
⻬Random Number Generator:The method of implementing a random number generator on a computer has been a problem since someone discovered a need for such a number. Computers love to repeat them-selves in a non-random way, so it is an interesting problem. SPSS lets you choose between two ways of doing it: the old way and the new way. If you have no interest in doing the same thing you did in older versions of SPSS (version 12 and earlier), use the Twister.
⻬Set Century Range for 2-Digit Years:A solution to the Y2K problem. I’ll bet you thought that was all over, and it’s true that the problem is gone. But the solutions are still with us and this is one of them. You put in two four-digit years here, and any two-digit value that you supply to identify a year is assumed to be between the two years you specify. This is mostly for old data. If you always use four digits for years in your data, this adjustment will never have to be made.
Currency formats
Different parts of the world use different symbols and formats when writing about currency. The window shown in Figure 2-22 lets you specify the display format of your currency.
Figure 2-21:
Data handling in SPSS can be varied within the limits of the settings of this tab.
37
Following are the options in the Currency tab:
⻬Custom Output Formats:The default format for presenting currency values. The five formats have the unlikely names CCA, CCB, CCC, CCD, and CCE. Those are the only ones you can have, but that has to be enough for anybody. I mean, really, if you work with more kinds of money than that, buy another copy of SPSS. The calculations are always performed the same way — the differences are in the display. You can set the display configuration differently for each one and then switch among them as often as you like.
⻬Sample Output:Displays the printed format of positive and negative currency values. As you switch from one currency selection to another, and as you change the formatting of any of them, the sample displays examples of the format.
⻬All Values:Specifies characters that are displayed at the front and at the back of all values, such as a British pound sign and the cent mark. ⻬Negative Values:Specifies characters placed in the front and back
of negative values. For example, some like to use < and > to surround negative money values.
⻬Decimal Separator:Many currency notations use commas instead of periods to denote the fractional portion of the amount.
Figure 2-22: